Submitted 4 August 2015 Accepted 31 October 2015 Published10 December 2015
Corresponding authors Fr´ed´eric Mah´e, [email protected] Torbjørn Rognes, [email protected] Academic editor Gilles van Wezel
Additional Information and Declarations can be found on page 10
DOI10.7717/peerj.1420
Copyright 2015 Mah´e et al.
Distributed under
Creative Commons CC-BY 4.0
OPEN ACCESS
Swarm v2: highly-scalable and
high-resolution amplicon clustering
Fr´ed´eric Mah´e1, Torbjørn Rognes2,3, Christopher Quince4, Colomban de Vargas5,6and Micah Dunthorn1
1Department of Ecology, Technische Universit¨at Kaiserslautern, Kaiserslautern, Germany 2Department of Informatics, University of Oslo, Oslo, Norway
3Department of Microbiology, Oslo University Hospital, Rikshospitalet, Oslo, Norway 4Warwick Medical School, University of Warwick, Warwick, United Kingdom
5UMR 7144, EPEP– ´Evolution des Protistes et des ´Ecosyst`emes P´elagiques, Station Biologique de Roscoff, CNRS, Roscoff, France
6UMR7144 Station Biologique de Roscoff, Sorbonne Universit´es, UPMC Univ Paris 06, Roscoff, France
ABSTRACT
Previously we presented Swarm v1, a novel and open source amplicon clustering program that produced fine-scale molecular operational taxonomic units (OTUs), free of arbitrary global clustering thresholds and input-order dependency. Swarm v1 worked with an initial phase that used iterative single-linkage with a local clustering threshold (d), followed by a phase that used the internal abundance structures of clusters to break chained OTUs. Here we present Swarm v2, which has two important novel features: (1) a new algorithm ford=1 that allows the computation time of the program to scale linearly with increasing amounts of data; and (2) the new fastidious option that reduces under-grouping by grafting low abundant OTUs (e.g., singletons and doubletons) onto larger ones. Swarm v2 also directly integrates the clustering and breaking phases, dereplicates sequencing reads withd=0, outputs OTU
repre-sentatives in fasta format, and plots individual OTUs as two-dimensional networks.
Subjects Biodiversity, Bioinformatics, Environmental Sciences, Microbiology, Molecular Biology
Keywords Environmental diversity, Barcoding, Molecular operational taxonomic units
INTRODUCTION
Traditionalde novoamplicon clustering methods that can handle large high-throughput sequencing datasets (e.g.,Edgar, 2010;Ghodsi, Liu & Pop, 2011;Fu et al., 2012) suffer from two fundamental problems. First, they rely on an arbitrary fixed global clustering threshold to group amplicons into molecular operational taxonomic units (OTUs). Global clustering thresholds have rarely been justified and are not applicable to all taxa and marker lengths (e.g.,Caron et al., 2009;Nebel et al., 2011;Dunthorn et al., 2012;Brown et al., 2015). Second, there is variability in the clustering results due to amplicon input order (Koeppel & Wu, 2013;Mah´e et al., 2014).
To solve these problems, we previously introduced the open source Swarm v1 program that implemented an initial clustering phase written in C++, then a breaking phase
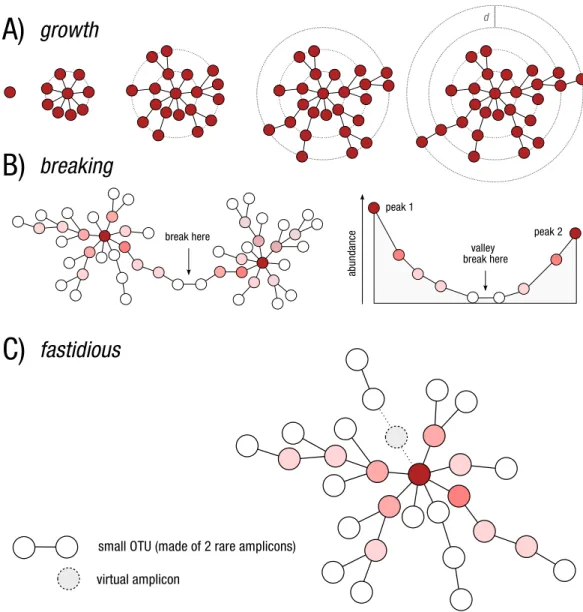
written in Python (Mah´e et al., 2014). Swarm’s clustering phase (Fig. 1A) was novel in its approach to single linkage clustering in that, instead of using a global clustering (e.g.,
Figure 1 Schematic view of Swarm’s clustering and refinement approach.(A) Swarm clusters ampli-cons iteratively by using a small user-chosen local threshold,d, allowing OTUs to grow to their natural limits, where no other amplicons can be added. (B) Swarm takes into account the abundance of each amplicon to produce higher resolution clusters, by not allowing the formation of amplicon chains. The darker the red, the higher the abundance. (C) The fastidious option avoids under-grouping (e.g., the production of small OTUs such as singletons and doubletons) by postulating the existence of virtual linking amplicons to graft smaller OTUs onto larger ones.
small local clustering threshold (d) until no more amplicons could be added. Usingd=1
produced the highest resolution OTUs. Swarm’s breaking phase (Fig. 1B) was novel in that it used the abundance of amplicons to reveal the internal structure of potentially chained OTUs (i.e., a low abundant link between high abundant amplicons). These chained OTUs were then refined by splitting them.
was cumbersome to use. Kopylova et al. (pers. comm., 2015) also found that in comparison to other clustering methods, Swarm v1 tended to produce relatively more low abundant OTUs; e.g., singletons and doubletons. And most importantly, Swarm v1 and other current de novoalgorithms could not cluster today’s largest high-throughout sequencing datasets within a reasonable amount of time (Rideout et al., 2014). Here we introduce Swarm v2 to help solve these problems, as well as to introduce new and useful features.
MATERIAL AND METHODS
Linear complexityde novoclustering approach
Today’s largest amplicon datasets contain hundreds of millions of amplicons and pose a computational challenge tode novoclustering methods. Because of this scalability problem,Rideout et al. (2014)proposed using a mixed clustering approach with an initial closed-reference clustering that compares the amplicons to what is known in taxonomic reference databases to capture most of the data, followed by ade novoclustering with the remaining amplicons. We feel that using onlyde novoclustering is the most powerful approach when working with amplicons from unexplored environments that lack sufficient taxonomic reference databases, or with rare taxa that were previously missed in already-sampled environments. We therefore worked to improve Swarm’s scalability.
Like other currentde novoclustering approaches, Swarm v1 presented an apparent quadratic behavior in that it needs to perform a number of comparisons that grows as the square of the number of amplicons. In Swarm v2, we first reduced computational time by improving the multithreading and making a better usage of multi-core CPUs. We further reduced computational time by using a novel algorithmic approach. This linear complexity approach only applies ford=1, which is Swarm’s default and preferred parameter as it produces the highest resolution clusters.
As background to this linear approach, let us consider a nucleic sequenceSmade of As, Cs, Gs and Ts. A “microvariant” is a sequence with one difference (d=1) to the
original sequenceS. How many distinct microvariants can derive fromS? In a sequenceS of lengthL, each position can be substituted with 3 different bases, so there are 3Lpossible microvariants due to substitutions. Each position inScan be deleted once, so there areL possible microvariants due to deletions. Insertions are more complicated. An insertion can happen before or after each position in the sequenceS, and four different nucleotides can be inserted resulting in 4(L+1)microvariants. However, some insertions will result in the same microvariant: for example, inserting a “G” before or after a “G” will result in the same sequence “GG.” As that situation arises for all positions inSbut one, the maximum number of distinct insertions is not 4(L+1), but 3(L+1)+1=3L+4. In total, the maximum number of microvariants that can be obtained from a given sequenceSof length Lis 3L+L+3L+4=7L+4.
microvariant. The total number of distinct microvariants then drops to its minimum value: 3L+1+3(L+1)+1=6L+5.
The number of distinct microvariants that can be obtained from a sequenceSof length Lthen varies from 6L+5 to 7L+4. In practice, it means that a typical high-throughput
sequencing 16S rRNA sequence of 130 nucleotides will yield at least 785 microvariants and at most 914, and that the number of microvariants will increase linearly with the sequence length. With current sequencing technologies read length increases at a slower rate than read number, and is safe to assume it will continue to do so in the foreseeable future.
Based on these characteristics of microvariants, we switched from an approximate-string comparison approach to an exact-approximate-string comparison approach. That is, for a given amplicon, instead of doing an exact pairwise alignment comparison against all available amplicons in the pool that have yet to be subsumed into an OTU, Swarm v2 generates all possible microvariants of the amplicon and checks whether or not they are present in the amplicon pool using a hash table. This exact-string search approach is extremely fast, and does not depend on the number of available amplicons in the pool. Therefore, the apparent computational complexity changes fromn2ton×L, whereLis the average amplicon length.
Reducing under-grouping
As observed by Kopylova et al. (pers. comm., 2015), Swarm v1 tended to produce relatively more low abundant OTUs; e.g., singletons and doubletons. This problem is due to Swarm’s approach that depends on the existence of a continuous path of linked amplicons. Linking amplicons can be missing, especially when sequencing is shallow. When this occurs, there can be under-grouping of closely related amplicons leading to small OTUs surrounding a larger OTU.
To address this problem in Swarm v2, we introduced a new step—called the fastidious option—to graft low abundant OTUs onto more abundant ones by postulating a linking amplicon (Fig. 1C). A low abundant OTU is defined as an OTU with a total abundance lower than 3, i.e., an abundance of one (singletons) or two (doubletons). That default threshold value can be modified by users with the option -b. In practice, microvariants (independent of the microvariants produced in the clustering phase) are produced for all the amplicons belonging to low abundant OTUs and stored in a Bloom filter (a probabilistic dictionary). Microvariants are then produced for high-abundant amplicons and cross-checked against the Bloom filter. The fastidious option can consume a large amount of memory, but is apparently linear in terms of computation time (see Results). The user does have control over memory usage and can exchange memory space for computation time. As of now, the fastidious option can only be used withd=1, which is Swarm’s default and recommendeddvalue. With higherdvalues, the time and space complexity of our fastidious algorithm grows too fast to be practical.
abundant OTUs. In contrast with an increase ofd, the fastidious option does not slow down computation and does not degrade the clustering resolution; i.e., it reduces the under-grouping of amplicons without inducing much over-grouping (see section “Statistics on mock-communities” inFile S1).
Other new and useful features
In Swarm v2 we introduce a number of options improving both speed and usability. First, there is a simpler user command line interface. For example, the breaking phase is now written in C++and is performed directly during the growth phase, which further significantly reduces computation time. We chose to implement a strict, simple, non-parametric breaking model that prevents any increase in abundance along a continuous amplicon path (Fig. 1B). Breaking of linked chains can be deactivated.
Second, Swarm v2 extends the notion of clustering by allowing the optiond=0. Users can now dereplicate their sequencing reads into strictly identical amplicons (sensuMah´e et al., 2015; i.e., reads that have exactly the same sequences with no substitutions, insertions, or deletions). This fast dereplication approach uses the same algorithm as in VSEARCH (https://github.com/torognes/vsearch).
Third, Swarm v2 can output OTU representative amplicons in fasta format. A representative is the most abundant amplicon of an OTU, and its abundance is updated to reflect the total OTU abundance. OTU representatives are normally used for downstream community-comparative, novel-diversity, and ecosystem-functioning questions.
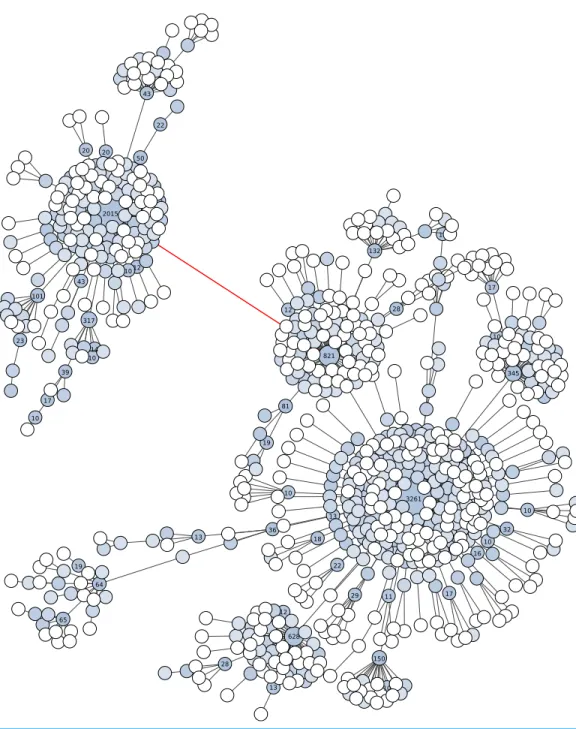
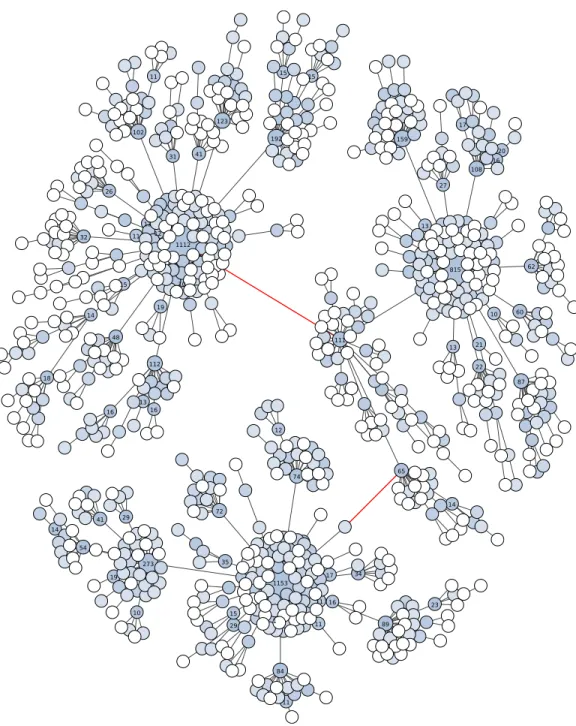
Fourth, Swarm v2 offers the possibility to visualize the internal structure of OTUs, which allows the user to gain further knowledge of its underlying genetic and ecological diversity (Figs. 2and3). These plots are in the form of a network projected in two-dimensions. Edges in these networks only represent the parameterdused; the length of the edges carries no information. The nodes in the networks represent amplicons. The abundance information of these amplicons is represented in three ways: the size of the node, the color of the node, and text when its abundance value is 10 or more.
Analyses
To demonstrate the apparent linear complexity of Swarm v2, we analyzed 16S rRNA reads from the Earth Microbiome Project (Gilbert, Jansson & Knight, 2014), which is the largest amplicon dataset currently available. The following swarm commands were used:swarm -d 1 in.fasta, andswarm -d 1 -f in.fasta. To illustrate over- and
RESULTS AND DISCUSSION
Time and space benchmarks
Ford=1, Swarm’s default parameter, using the full- and sub-datasets of the Earth Mi-crobiome Project we were able to evaluate Swarm v2’s clustering time and memory usage. These timing experiments were obtained with Swarm v2.1.1 on a machine with 1,024 GB of RAM running Red Hat CentOS v6.6 and Linux kernel v3.9.1 on four Intel Xeon E5-4620 processors (2.2 GHz) having a total of 32 physical cores. Swarm was run with 8 threads (op-tion “-t 8”), breaking activated (default behaviour), and memory limited to 240 GB (“-c 245760”). The times indicated below are the averages of four runs. With the sub-dataset of 154,896,650 strictly identical amplicons (representing 1,277,640,415 reads), Swarm with-out the fastidious option took 1 h and 45 min±1 min. With the full-dataset of 314,871,149
strictly identical amplicons (representing 2,254,207,945 reads), Swarm without the fastidious option took 3 h and 41 min±1 min. Doubling of dataset size approximately doubles the run time, confirming the apparent linear time complexity. Therefore, if the size of the Earth Microbiome Project were to increase ten times, it should take about ten times longer to cluster it (less than two days). These fast times of Swarm v2 contrast with the estimated computational time of UCLUST v6.1 as inferred byRideout et al. (2014). Using a smaller partial-dataset of the Earth Microbiome Project consisting of only 660,000,000 reads (that dereplicate into a unspecified number of strictly identical amplicons),Rideout et al. (2014)estimated UCLUST’s runtime to 150 days on a 8-core computer.
With the sub-dataset representing 24 GB of input data, the memory usage of Swarm v2 withd=1 was 41 GB. With the full-dataset representing 49 GB of input data, the memory usage was 86 GB. Memory requirements can therefore be estimated to be approximately equal to the size of the input dataset plus 2/3.
When clustering atd=1 and using the fastidious option, the total computational time of the sub-dataset was 4 h and 59 min±1 min, which resulted in 40.0% fewer OTUs in total. The total computational time of the full-dataset took 11 h and 28 min±5 min, which resulted in 38.3% fewer OTUs in total. This considerable reduction in the number of singletons and doubletons in both datasets helps solve the problem found by Kopylova et al. (pers. comm., 2015). The computation time is about three times longer when using the fastidious option than without it.
The total memory usage ofd=1 with the fastidious option for the sub-dataset was 114 GB, while it was 239 GB (capped) for the full-dataset. This amount of memory might not be available to all users. Therefore we have implemented two options to control and cap memory usage of the fastidious option: by defining the maximum memory footprint, and by adjusting the size of the Bloom filter entries. Both of these options allow users to trade computational time for memory space.
OTU visualizations
The number of nucleotide differences between these two linked OTUs is only two, or about 98.4% similarity. If the breaking phase and fastidious option were applied to these V9 amplicons, nine separate OTUs would have been formed: two high abundant, and seven low abundant. These two high abundant OTUs are taxonomically assigned to different genera of Collodaria (Radiolaria). On the same V9 amplicons, UCLUST v6 (as well as v7 and v8) using a global clustering threshold of 97% similarity produced 37 OTUs (one high abundant, and 36 low abundant). The one high abundant OTU from UCLUST lumped the two Collodaria genera, thus masking meaningful biological data.
With the V4 amplicons (about 380 bp in length), the graph shows three high abundant OTUs linked by one to three low abundant amplicons (Fig. 3). The number of nucleotide differences between these three linked OTUs is only two and four, or about at least 98.9% similarity. If the breaking phase and fastidious option were applied to these V4 amplicons, seven separate OTUs would have been formed: three high abundant, and four low abundant. These three high abundant OTUs are assigned to different taxa of Cnidaria. On the same V4 amplicons, UCLUST v6 (as well as v7 and v8) produced only one OTU with the widely used global clustering threshold of 97% similarity, again masking meaningful biological data.
These amplicon data show that, compared to UCLUST, Swarm v2 can distinguish higher-resolution clusters and reduces both over-grouping and under-grouping on a range of marker lengths. In both of these amplicon examples, Swarm v2 is able to distinguish different taxa, while UCLUST conceals them.
Outlook
We are currently working on a number of fronts to continue making Swarm harder, better, faster, stronger. For example, preliminary experiments indicate that with a novel multi-threading approach ford≥2 a ten-fold increase in speed could be obtained (althoughd≥
2 will still be quadratic in behavior). Internally encoding nucleotides on two bits instead of eight bits may help reduce both memory consumption and computational time. Addi-tional computation time can be saved by merging the fastidious option with the initial clus-tering phase. To facilitate its usage, Swarm v2 can be included in QIIME (Caporaso et al., 2010), which already offers Swarm v1.2, and in Galaxy (Goecks, Nekrutenko & Taylor, 2010).
In summary, Swarm v2 is a highly-scalable approach that uses a local clustering threshold to produce high-resolutionde novoOTUs and reduces low abundant OTUs. Swarm v2 is an optimized C++program able to handle many hundreds of millions
of amplicons. It is open source and freely available athttps://github.com/torognes/ swarmunder the GNU Affero General Public License version 3.
ACKNOWLEDGEMENTS
ADDITIONAL INFORMATION AND DECLARATIONS
Funding
FM and MD were supported by the Deutsche Forschungsgemeinschaft (grant #DU1319/1-1). CQ is funded by an EPSRC Career Acceleration Fellowship—EP/H003851/1. CdeV were supported by the EU EraNet BiodivErsA program BioMarKs (grant #2008-6530) and the French government “Investissements d’Avenir” project OCEANOMICS (ANR-11-BTBR-0008) and the EU FP7 program MicroB3 (contract number 287589). The funders had no role in study design, data collection and analysis, decision to publish, or preparation of the manuscript.
Grant Disclosures
The following grant information was disclosed by the authors: Deutsche Forschungsgemeinschaft: #DU1319/1-1.
EPSRC Career Acceleration Fellowship: EP/H003851/1. EU EraNet BiodivErsA program BioMarKs: #2008-6530.
French government “Investissements d’Avenir” project OCEANOMICS: ANR-11-BTBR-0008.
EU FP7 program MicroB3: 287589.
Competing Interests
The authors declare there are no competing interests.
Author Contributions
• Fr´ed´eric Mah´e and Torbjørn Rognes conceived and designed the experiments, performed the experiments, analyzed the data, wrote the paper, prepared figures and/or tables, reviewed drafts of the paper.
• Christopher Quince and Colomban de Vargas conceived and designed the experiments, contributed reagents/materials/analysis tools, reviewed drafts of the paper.
• Micah Dunthorn conceived and designed the experiments, analyzed the data, wrote the paper, prepared figures and/or tables, reviewed drafts of the paper.
Data Availability
The following information was supplied regarding data availability: https://github.com/torognes/swarm.
Supplemental Information
Supplemental information for this article can be found online athttp://dx.doi.org/ 10.7717/peerj.1420#supplemental-information.
REFERENCES
hypervariable SSU rRNA gene regions.Environmental Microbiology13(2):340–349
DOI 10.1111/j.1462-2920.2010.02332.x.
Brown EA, Chain FJJ, Crease TJ, MacIsaac HJ, Cristescu ME. 2015.Divergence thresholds and divergent biodiversity estimates: can metabarcoding reliably describe zooplankton communities?Ecology and Evolution5(11):2234–2251DOI 10.1002/ece3.1485.
Caporaso JG, Kuczynski J, Stombaugh J, Bittinger K, Bushman FD, Costello EK, Fierer N, Pena AG, Goodrich JK, Gordon JI, Huttley GA, Kelley ST, Knights D, Koenig JE, Ley RE, Lozupone CA, McDonald D, Muegge BD, Pirrung M, Reeder J, Sevinsky JR, Turnbaugh PJ, Walters WA, Widmann J, Yatsunenko T, Zaneveld J, Knight R. 2010.QIIME allows
analysis of high-throughput community sequencing data.Nature Methods7(5):335–336
DOI 10.1038/nmeth.f.303.
Caron DA, Countway PD, Savai P, Gast RJ, Schnetzer A, Moorthi SD, Dennett MR, Moran DM, Jones AC. 2009. Defining DNA-based operational taxonomic units for microbial-eukaryote ecology.Applied and Environmental Microbiology 75(18):5797–5808
DOI 10.1128/AEM.00298-09.
De Vargas C, Audic S, Henry N, Decelle J, Mah´e F, Logares R, Lara E, Berney C, Le Bescot N, Probert I, Carmichael M, Poulain J, Romac S, Colin S, Aury J-M, Bittner L, Chaffron S, Dunthorn M, Engelen S, Flegontova O, Guidi L, Hor´ak A, Jaillon O, Lukeˇs J, Malviya S, Morard R, Mulot M, Scalco E, Siano R, Vincent F, Zingone A, Dimier C, Picheral M, Sear-son S, Kandels-Lewis S, Tara Oceans Coordinators, Acinas SG, Bork P, Bowler C, Gorsky G, Grimsley N, Hingamp P, Iudicone D, Not F, Ogata H, Pesant S, Raes J, Sieracki ME, Speich S, Stemman L, Sunagawa S, Weissenbach J, Wincker P, Karsenti E. 2015.Eukaryotic plankton diversity in the sunlit global ocean.Science348(6237):1261605DOI 10.1126/science.1261605.
Dunthorn M, Klier J, Bunge J, Stoeck T. 2012.Comparing the hyper-variable V4 and V9 regions of the small subunit rDNA for assessment of ciliate environmental diversity.Journal of Eukaryotic Microbiology59(2):185–187DOI 10.1111/j.1550-7408.2011.00602.x.
Edgar RC. 2010.Search and clustering orders of magnitude faster than BLAST.Bioinformatics
26(19):2460–2461DOI 10.1093/bioinformatics/btq461.
Filker S, Gimmler A, Dunthorn M, Mah´e F, Stoeck T. 2015.Deep sequencing uncovers protistan plankton diversity in the Portuguese Ria Formosa solar saltern ponds.Extremophiles
19(2):283–295DOI 10.1007/s00792-014-0713-2.
Fu L, Niu B, Zhu Z, Wu S, Li W. 2012.CD-HIT: accelerated for clustering the next-generation sequencing data.Bioinformatics28(23):3150–3152DOI 10.1093/bioinformatics/bts565.
Ghodsi M, Liu B, Pop M. 2011.DNACLUST: accurate and efficient clustering of phylogenetic marker genes.BMC Bioinformatics12(1):271DOI 10.1186/1471-2105-12-271.
Gilbert J, Jansson J, Knight R. 2014.The Earth Microbiome project: successes and aspirations.
BMC Biology12(1):69DOI 10.1186/s12915-014-0069-1.
Goecks J, Nekrutenko A, Taylor J, The Galaxy Team. 2010.Galaxy: a comprehensive approach for supporting accessible, reproducible, and transparent computational research in the life sciences.
Genome Biology11(8):Article R86DOI 10.1186/gb-2010-11-8-r86.
Guillou L, Bachar D, Audic S, Bass D, Berney C, Bittner L, Boutte C, Burgaud G, De Vargas C, Decelle J, Del Campo J, Dolan J, Dunthorn M, Edvardsen B, Holzmann M, Kooistra W, Lara E, Le Bescot N, Logares R, Mah´e F, Massana R, Montresor M, Morard R, Not F, Pawlowski J, Probert I, Sauvadet A-L, Siano R, Stoeck T, Vaulot D, Zimmermann P, Christen R. 2013.The Protist Ribosomal Reference database (PR2): a catalog of unicellular eukaryote Small Sub-Unit rRNA sequences with curated taxonomy.Nucleic Acids Research
Hartmann M, Howes CG, VanInsberghe D, Yu H, Bachar D, Christen R, Henrik Nilsson R, Hallam SJ, Mohn WW. 2012.Significant and persistent impact of timber harvesting on soil microbial communities in Northern coniferous forests.ISME Journal6(12):2199–2218
DOI 10.1038/ismej.2012.84.
Huse SM, Mark Welch D, Morrison HG, Sogin ML. 2010.Ironing out the wrinkles in the rare biosphere through improved OTU clustering.Environmental Microbiology12(7):1889–1898
DOI 10.1111/j.1462-2920.2010.02193.x.
Koeppel AF, Wu M. 2013.Surprisingly extensive mixed phylogenetic and ecological signals among bacterial Operational Taxonomic Units.Nucleic Acids Research41(10):5175–5188
DOI 10.1093/nar/gkt241.
Kunin V, Engelbrektson A, Ochman H, Hugenholtz P. 2010.Wrinkles in the rare biosphere: pyrosequencing errors can lead to artificial inflation of diversity estimates.Environmental Microbiology12(1):118–123DOI 10.1111/j.1462-2920.2009.02051.x.
Lima-Mendez G, Faust K, Henry N, Decelle J, Colin S, Carcillo F, Chaffron S,
Ignacio-Espinosa JC, Roux S, Vincent F, Bittner L, Darzi Y, Wang J, Audic S, Berline L, Bontempi G, Cabello AM, Coppola L, Cornejo-Castillo FM, D’Ovidio F, De Meester L, Ferrera I,
Garet-Delmas M-J, Guidi L, Lara E, Pesant S, Royo-Llonch M, Salazar G, S´anchez P, Sebastian M, Souffreau C, Dimier C, Picheral M, Searson S, Kandels-Lewis S, Tara Oceans Coordinators, Gorsky G, Not F, Ogata H, Speich S, Stemmann L, Weissenbach J, Wincker P, Acinas SG, Sunagawa S, Bork P, Sullivan MB, Karsenti E, Bowler C, De Vargas C, Raes J. 2015.Determinants of community structure in the global plankton interactome.Science
348(6237):1262073DOI 10.1126/science.1262073.
Logares R, Audic S, Bass D, Bittner L, Boutte C, Christen R, Claverie J-M, Decelle J,
Dolan JR, Dunthorn M, Edvardsen B, Gobet A, Kooistra WHCF, Mah´e F, Not F, Ogata H, Pawlowski J, Pernice MC, Romac S, Shalchian-Tabrizi K, Simon N, Stoeck T, Santini S, Siano R, Wincker P, Zingone A, Richards TA, De Vargas C, Massana R. 2014.Patterns of rare and abundant marine microbial eukaryotes. Current Biology24(8):813–821
DOI 10.1016/j.cub.2014.02.050.
Mah´e F, Mayor J, Bunge J, Chi J, Siemensmeyer T, Wahl B, Paprotka T, Filker S, Dunthorn M. 2015.Comparing high-throughput platforms for sequencing the V4 region of SSU-rDNA in environmental microbial eukaryotic diversity survey.Journal of Eukaryotic Microbiology
62(3):338–345DOI 10.1111/jeu.12187.
Mah´e F, Rognes T, Quince C, De Vargas C, Dunthorn M. 2014.Swarm: robust and fast clustering method for amplicon-based studies.Peer Journal2:e593DOI 10.7717/peerj.593.
Nebel M, Pfabel C, Stock A, Dunthorn M, Stoeck T. 2011.Delimiting operational taxonomic units for assessing ciliate environmental diversity using small-subunit rRNA gene sequences.
Environmental Microbiology Reports3(2):154–158DOI 10.1111/j.1758-2229.2010.00200.x.
Oikonomou A, Filker S, Breiner H-W, Stoeck T. 2015.Protistan diversity in a permanently stratified meromictic lake (Lake Alatsee, SW Germany).Environmental Microbiology
17(6):2144–2157DOI 10.1111/1462-2920.12666.