www.clim-past.net/12/2215/2016/ doi:10.5194/cp-12-2215-2016
© Author(s) 2016. CC Attribution 3.0 License.
Climate trends in northern Ontario and Québec from borehole
temperature profiles
Carolyne Pickler1,2, Hugo Beltrami2, and Jean-Claude Mareschal1
1GEOTOP, Centre de Recherche en Géochimie et en Géodynamique, Université du Québec à Montréal, Montréal, Québec, Canada
2Climate & Atmospheric Sciences Institute and Department of Earth Sciences, St. Francis Xavier University, Antigonish, Nova Scotia, Canada
Correspondence to:Hugo Beltrami (hugo@stfx.ca)
Received: 17 May 2016 – Published in Clim. Past Discuss.: 30 May 2016
Revised: 14 November 2016 – Accepted: 24 November 2016 – Published: 16 December 2016
Abstract. The ground surface temperature histories of the
past 500 years were reconstructed at 10 sites containing 18 boreholes in northeastern Canada. The boreholes, between 400 and 800 m deep, are located north of 51◦N and west and east of James Bay in northern Ontario and Québec. We find that both sides of James Bay have experienced simi-lar ground surface temperature histories with a warming of 1.51±0.76 K during the period of 1850 to 2000, similar to borehole reconstructions for the southern portion of the Su-perior Province and in agreement with available proxy data. A cooling period corresponding to the Little Ice Age was found at only one site. Despite permafrost maps locating the sites in a region of discontinuous permafrost, the ground sur-face temperature histories suggest that the potential for per-mafrost was minimal to absent over the past 500 years. This could be the result of air surface temperature interpolation used in permafrost models being unsuitable to account for the spatial variability of ground temperatures along with an offset between ground and air surface temperatures due to the snow cover.
1 Introduction
Earth’s subsurface thermal regime is governed by the outflow of heat from the interior and by temporal variations in ground surface temperature (GST). The heat flux from the interior of the Earth varies on timescales of the order of a few mil-lions of years in active tectonic regions and several 100 Myr in stable continents. It can be considered as steady state rel-ative to the timescale of climatic surface temperature
varia-tions. To determine the heat flow from the Earth’s interior, temperature–depth profiles are measured in boreholes. In ho-mogeneous rocks with no heat production, the steady-state temperature profile linearly increases with depth. Persistent temporal changes in the ground surface energy balance cause variations of the ground temperature that diffuse downwards and are recorded as temperature anomalies superimposed on the linear steady-state geotherm (e.g. Hotchkiss and Inger-soll, 1934; Birch, 1948; Beck, 1977). The extent to which the ground surface temperature changes are recorded is portional to their duration and amplitude and inversely pro-portional to the time when they occurred. For periodic oscil-lations of the surface temperature, the temperature is prop-agated downward as a damped wave. The amplitude of the wave decreases exponentially with depth over a length scale δ (skin depth) proportional to the square root of the period (δ=√κT /π), whereκis the thermal diffusivity of the rock, ≈10−6m2s−1or
≈31.5 m2yr−1. This damping removes the high-frequency variability that is present in meteorological records and allows for the preservation of the long-term cli-matic trends in the ground temperature signal (e.g. Beltrami and Mareschal, 1995).
Sass et al., 1971; Vasseur et al., 1983). In the 1980s, with increasing concern over global warming, use of borehole temperature–depth profiles to estimate recent (<300 years) climate change became widespread following the study of Lachenbruch and Marshall (1986). This has lead to many local, regional, and global studies (e.g. Huang et al., 2000; Harris and Chapman, 2001; Gosselin and Mareschal, 2003; Beltrami and Bourlon, 2004; Pollack and Smerdon, 2004; Chouinard et al., 2007; Pickler et al., 2016).
Because of the availability of suitable temperature–depth profiles in the Canadian Shield, many studies have been undertaken in central and eastern Canada. The majority of these studies have used temperature–depth profiles from the southern portion of the Superior Province of the Canadian Shield (∼45–50◦N), where many mining exploration holes are readily available and the crystalline rocks are less likely to be affected by groundwater flow than sedimentary rocks. These studies have shown a warming signal of ∼1–2 K over the last ∼150–200 years, following a period of cool-ing about 200–500 yr BP associated with the Little Ice Age (LIA) (e.g. Beltrami and Mareschal, 1992; Wang et al., 1992; Guillou-Frottier et al., 1998; Gosselin and Mareschal, 2003; Chouinard and Mareschal, 2007).
For logistical reasons, mining exploration has been re-stricted to the southernmost part of the Shield and the few holes that have been drilled in northern regions cannot be measured because they are blocked by permafrost. Neverthe-less, a few studies were conducted at higher latitudes. Ma-jorowicz et al. (2004) reconstructed the GST history for 61 temperature–depth profiles between 60 and 82◦N in north-ern Canada. They found strong evidence that GST warming started in the late 18th century and continued until present. Simultaneous inversion of their data yielded a warming of ∼2 K for the last 500 years. Studies on Ellesmere Island (above 60◦N) have shown varying trends, confirming that temperatures do not increase uniformly over Arctic regions. Taylor et al. (2006) reconstructed the 500-year GST history from three boreholes and found a 3 K warming since the LIA minimum, ∼200 yr BP, which is consistent with Bel-trami and Taylor (1995) results and the oxygen isotopes stud-ies on ice cores from the region (Fisher and Koerner, 1994). Chouinard et al. (2007) used three temperature–depth pro-files in a region with continuous permafrost at the northern-most tip of Québec to infer the GST history. They found a very strong and recent warming of∼2.5 K, with the largest part of this warming occurring in the preceding 15 years, i.e. much later than on Ellesmere Island. Because of lack of ade-quate borehole temperature depth profiles in eastern Canada between 51 and 60◦N, the large region between the Cana-dian Arctic and the southern part of the CanaCana-dian Shield has not been studied and the climate trends of the last 500 years for this region remain unclear except for boreholes at Voisey Bay, at 56◦N on the east coast of Labrador, which show al-most no climate signal (Mareschal et al., 2000).
The first motivation of this study is to reduce the gap in data between the Arctic and southeastern Canada. We shall examine 18 temperature–depth profiles measured at 10 sites from eastern Canada to reconstruct the GST histories for the last 500 years. The sites are located in the poorly sampled region north of 51◦N, west and east of James Bay in northern Ontario and Québec. They are to the north of the previous eastern Canada studies and south of the Arctic ones, in a part of the Superior Province where heat flux is extremely low (<30 mW m−2) (Jaupart et al., 2014).
2 Theory
Assuming Earth is a half-space where physical properties only vary with depth, the temperature at depthz,T(z), can be written as (Jaupart and Mareschal, 2011)
T(z)=T0+QoR(z)− z
Z
0 dz′ λ(z′)
z′
Z
0
H(z′′)dz′′+Tt(z), (1)
whereT0is the reference surface temperature,Qothe refer-ence surface heat flux, the integral accounts for the vertical distribution of heat producing elements H(z), andTt(z) is the temperature perturbation at depthzdue to time-varying changes to the surface boundary condition. The thermal depthR(z) is defined as
R(z)= z
Z
0 dz′
λ(z′), (2)
whereλis the thermal conductivity.
The temperature perturbation can be calculated by the fol-lowing equation (Carslaw and Jaeger, 1959):
Tt(z)=
∞
Z
0 z
2√π κt3exp( −z2
4κt)To(t)dt, (3)
whereκ is thermal diffusivity and To(t) is the surface tem-perature at timetbefore present. For a step change in surface temperature, 1T, at time t before present, the temperature perturbationTt(z) is given by Carslaw and Jaeger (1959):
Tt(z)=1Terfc( z
2√κt), (4)
where erfc is the complementary error function. If the GST perturbations are approximated by their mean values 1Tk during K intervals (tk−1, tk), the temperature perturbation is written as follows:
Tt(z)= K
X
k=1
1Tk(erfc z 2√κtk−
erfc z
2√κtk−1
). (5)
1Tk is the average difference between the ground surface temperature during the time interval (tk−1, tk) and the refer-ence surface temperatureT0.
2.1 Inversion
To reconstruct the GST history for each temperature–depth profile, we must invert Eq. (5). The inversion involves solv-ing for the parametersTo,Qo, and1Tk of the temperature– depth profile. Equation (5) yields a system of linear equa-tions in the unknown parameters for each depth where tem-perature has been measured. IfNtemperature measurements
were made in the borehole, a system of N linear equa-tions withK+2 unknowns, To,Qo, and theK values of 1Tk is obtained. However, this system of equations is ill-conditioned and its solution is unstable to small perturba-tions in the temperature data; i.e. a small error in the data results in a very large error in the solution (Lanczos, 1961). Different inversion methods are available to stabilize (reg-ularize) the solution of ill-posed problems (Backus–Gilbert method, Tikhonov regularization algorithm, Bayesian meth-ods, singular value decomposition, Monte Carlo methods). All these inversion techniques have been applied to recon-struct the GST history (e.g. Vasseur et al., 1983; Nielsen and Beck, 1989; Shen and Beck, 1991; Mareschal and Beltrami, 1992; Clauser and Mareschal, 1995; Mareschal et al., 1999). In this paper, we have used the singular value decomposi-tion because it is a very simple method to reduce the im-pact of noise and errors on the solution (Lanczos, 1961). This technique is well documented for geophysical studies (Jack-son, 1972; Menke, 1989) and its application for inversion of the ground temperature history is straightforward (Mareschal and Beltrami, 1992).
For sites including several boreholes with similar surface conditions, the data are inverted simultaneously because it is assumed that they have experienced the same surface perature variations and therefore consistent subsurface tem-perature anomalies. It was expected that consistent trends in the temperature profiles would reinforce each other while er-rors and random noise would cancel each other. However, the resulting improvement in the signal to noise ratio remains marginal unless a sufficiently large number of profiles with the same GST history are available, which is almost never the case. Simultaneous inversion is described in detail and discussed by Beltrami and Mareschal (1992), Clauser and Mareschal (1995), and Beltrami et al. (1997), among others.
3 Description of data
90˚W 80˚W 70˚W 50˚N
60˚N
Nielsen_Island
Lagrande Eleonore
Camp Coulon(3)
Corvet
Eastmain(2) Noront(4)
Musselwhite
Thierry Mine(3) Otoskwin
James Bay
Hudson Bay
ONTARIO QUEBEC
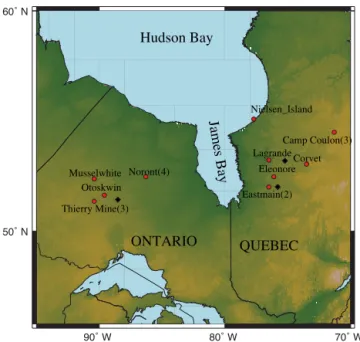
Figure 1.Map of Ontario and western Québec showing the location of sites (red dots). For sites with several boreholes (Camp Coulon, Eastmain, Thierry Mine, and Noront), the number of profiles avail-able is enclosed in parenthesis. Black diamonds show the locations of sites that were discarded.
Thermal conductivity was measured on core samples by the method of divided bars (Misener and Beck, 1960). Radio-genic heat production measurements were also made on core samples but are not needed for corrections because the holes are not deep and the heat production rate is low.
Only 18 holes proved suitable for inversion of the ground surface temperature. Their location and depth can be found in Table 1. Three northern Ontario sites are located in a re-gion of discontinuous isolated patches of permafrost: Mus-selwhite, Thierry Mine, and Otoskwin. One site, Noront, lies near the southern edge of a region with extensive discontinu-ous permafrost. Thierry Mine (0605, 0606, 0608) and Noront (1012, 1013, 1014, 1015) include several boreholes. Six sites are located in northern Québec in a region of discontinuous isolated patches of permafrost (Nielsen Island, La Grande, Eastmain, Eleonore, Corvet, Camp Coulon), with Eastmain (0803, 0804) and Camp Coulon (0712, 0713, 0714) having multiple boreholes. Systematic variations in thermal conduc-tivity observed at Nielsen Island were corrected by using the thermal depth (Bullard, 1939). Some measurements were not used for this study for different reasons (Table 2). Boreholes less than 300 m deep were rejected for being too shallow. When the mean distance to a lake was less than the depth of the hole, or less than 300 m, they were rejected. Furthermore, boreholes were deemed too steep and were rejected when they had a slope of 5 % or more over a distance comparable to the depth. The profile at Miminiska Lake (Ontario) is too shallow to be inverted, the boreholes at Clearwater (Québec) are plunging under a lake that affects the temperature
pro-files, and the borehole at Poste Lemoyne is on the side of a very steep hill and the profile is seriously perturbed by the to-pography. We also discarded one of the temperature profiles at the Eleonore site because the borehole was plunging un-der a recently filled water reservoir and one of the profiles at the La Grande site because it was a few metres away from the edge of a 30 m cliff. The borehole temperature–depth profiles at sites with multiple boreholes were truncated at the depth of the shallowest borehole to ensure that the same period of time was being studied (Thierry Mine at 530 m, Noront at 400 m, Eastmain at 400 m, and Camp Coulon at 400 m) (Bel-trami et al., 2011). The temperature anomaly for each site was calculated by subtracting from the data the estimated steady-state temperature obtained by least-square fitting of a linear function to the bottom 100 m of the profile (Figs. 2– 3). Tests were made to show that, below 300 m, the heat flux does not vary with the selected depth interval (Lévy et al., 2010; Jaupart et al., 2014) and that the reference temperature profile is stable.
4 Results
refer-Table 1.Location and technical information concerning the boreholes used in this study, where rue depth is the depth corrected for the dip of the borehole,λis the thermal conductivity,Qis the heat flux, andQcorris the heat flux corrected for post-glacial warming. The heat flux
for the site is represented by the bold values. The heat flux for each individual hole is in roman.
Site Log ID Latitude Longitude Dip True depth λ Q Qcorr Reference
(◦N) (◦W) (◦) (m) (W m−1K−1) (mW m−2) (mW m−2)
Musselwhite 0601 52◦37′28.3′′ 90◦23′32.7′′ 76 740 2.73 30.7 33 Lévy et al. (2010)
Thierry Mine 28
0605 51◦30′24′′ 90◦21′11′′ 74 802 2.91 26.8 29.7 Lévy et al. (2010) 0606 51◦30′22′′ 90◦21′11′′ 70 530 2.61 24.4 27.0 Lévy et al. (2010) 0608 51◦30′24.3′′ 90◦21′10.7′′ 62 737 2.60 24.6 27.1 Lévy et al. (2010)
Otoskwin 25
015-2 51◦49.5′ 89◦35.9′ 90 602 2.79 20 25 Jessop and Lewis (1978)
Noront 35
1012 52◦44′23.9′′ 86◦17′42.1′′ 68 761 3.2 34.1 37.6 Jaupart et al. (2014) 1013 52◦44′25′′ 86◦17′42.1′′ 55 389 3.1 28.3 34.1 Jaupart et al. (2014) 1014 52◦44′29.9′′ 86◦17′59.9′′ 77 762 3.1 31.7 35.6 Jaupart et al. (2014) 1015 52◦44′25.5′′ 86◦18′11.9′′ 75 806 3.1 29.5 33.4 Jaupart et al. (2014)
Nielsen Island 26
0-77 55◦23.7′ 77◦41.0′ 90 1408 5.5 (≤400 m) – 26.8 Jessop (1968) 2.4 (>400 m)
La Grande 22
0405 53◦31′45′′ 76◦33′15′′ 60 600 2.89 19.2 21.9 Lévy et al. (2010)
Eastmain 34
0803 52◦10′16′′ 76◦27′66′′ 60 398 2.9 28.8 34.1 Jaupart et al. (2014) 0804 52◦10′16′′ 76◦27′66′′ 60 390 2.9 26.7 32.9 Jaupart et al. (2014)
Eleonore 31
0502 52◦42′05′′ 76◦04′46′′ 56 527 2.47 30.7 32.8 Lévy et al. (2010)
Corvet 27
0716 53◦19.072′ 73◦55.760′ 67 479 2.80 24.0 26.8 Lévy et al. (2010)
Camp Coulon 28
0712 54◦47′43′′ 71◦17′09′′ 54 561 3.69 26.4 29.0 Lévy et al. (2010) 0713 54◦47′95′′ 71◦17′20′′ 40 460 3.73 24.5 27.5 Lévy et al. (2010)
0714 54◦47′43′′ 71◦17′34′′ 56 384 – – – Lévy et al. (2010)
ence temperature at Otoskwin, 0.88 K at Musselwhite, 1.85 K at Noront, and 2.85 K at Thierry Mine. It is likely that the Thierry Mine signal was amplified by the clearing of vegeta-tion that took place during the operavegeta-tion of the mine between 1934 and 1950.
Unlike for northern Ontario, a LIA signal was not found for any of the northern Québec sites (Figs. 5–6). A LIA sig-nal was expected because pollen data have suggested that the cooling during the LIA (up to −0.3◦C for North America) was strongest in northern Québec (Gajewski, 1988; Viau and Gajewski, 2009; Viau et al., 2012). However, a cooling sig-nal at∼200 m, which could be associated with the LIA, is observed in the temperature anomaly of CC0713 (Fig. 3). Discontinuities are observed in the temperature anomaly of CC0712 between 100 and 300 m. These are also observed in the temperature gradient and could be due to small wa-ter flows. The onset of the recent climate warming is the same for all the sites (∼100–150 yr BP), except Eleonore, where it began∼200–300 yr BP. The amplitude of the warm-ing varies between 0.5 and 2 K (Figs. 5–6), with the largest warming occurring at Corvet (2.18 K).
5 Discussion and conclusions
Borehole temperature profiles in northern Ontario and Québec consistently show a ground surface temperature in-crease of 1.51±0.76 K above the reference temperature. Most of this increase took place for the period of 1850 to 2000. Thierry Mine shows larger than average warming sig-nals: 2.85 K. The area around the Thierry Mine boreholes (0605, 0606, 0608) was cleared in the 1940s after the first opening of the mine and a satellite image locates all three boreholes∼300 m from a lake. Lakes disturb a profile if they are at a distance less than the depth of the boreholes (Lewis and Wang, 1992). The proximity to the lake along with the change in vegetation cover could explain the enhanced warming signal (Lewis and Wang, 1998; Lewis, 1998). This illustrates the significant influence of non-climatic effects on ground surface temperature reconstructions from borehole temperature–depth profiles.
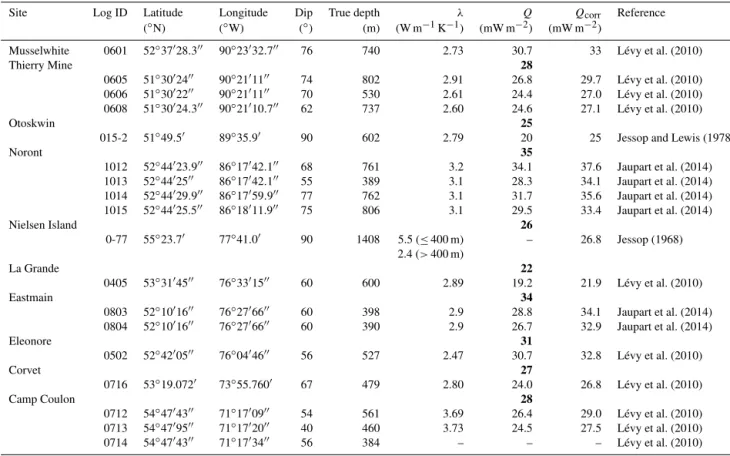
Figure 2. Temperature anomalies for the northern Ontario bore-holes. Holes TM0605, TM0606, and TM0608 are from the Thierry Mine site; holes N1012, N1013, N1014, and N1015 belong to the Noront site. The anomaly is obtained by subtracting the estimated steady-state geotherm obtained by the least-square fit of a straight line to the bottom 100 m of the borehole temperature–depth profile. The black line represents the best linear fit, while the pink and blue lines are the upper and lower bounds, respectively, of the 2σ confi-dence intervals. For N1014, TM0606, and Otoskwin, the upper and lower bounds of the confidence interval are not visible due to the temperature scale. The temperature anomaly at Musselwhite was cut at 650 m.
period has been inferred from different proxies and selected borehole temperature–depth profiles in eastern Canada (e.g. Archambault and Bergeron, 1992; Beltrami and Mareschal, 1992; Wang and Lewis, 1992; Chouinard et al., 2007; Bun-bury et al., 2012). For example, pollen data indicate a pro-nounced LIA cooling in Québec (Viau and Gajewski, 2009; Gajewski, 1988). The lack of LIA signal in the majority of the borehole inversions could be related to a combination of several factors. One is the limited resolution of the in-version of borehole temperature profiles. In the presence of noise, a period of weak cooling between 500 and 200 yr BP followed by strong warming is difficult to resolve. Resolu-tion at Otoskwin is better because the singular value cutoff
Figure 3.Temperature anomalies for the northern Québec bore-holes. CC0712, CC0713, and CC0714 are the boreholes from Camp Coulon; Ea0803 and Ea0804 are the boreholes from Eastmain. The anomaly is obtained by subtracting the estimated steady-state geotherm obtained by the least-square fit of a straight line to the bottom 100 m of the borehole temperature–depth profile. The black line represents the best linear fit, while the pink and blue lines repre-sent the upper and lower bounds, respectively, of the 2σconfidence intervals. For N1014, TM0606, and Otoskwin, the upper and lower bounds of the confidence interval are not visible due to the temper-ature scale. The tempertemper-ature anomaly at Nielsen Island was cut at 600 m.
Years CE
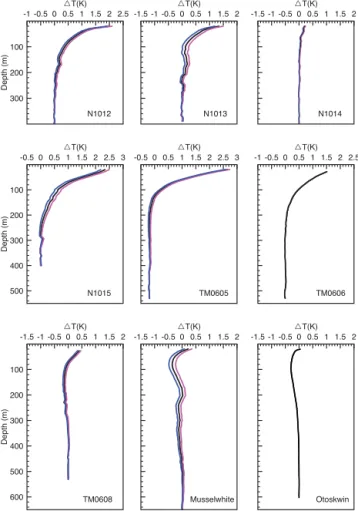
Figure 4.GST histories for the northern Ontario sites determined by inversion of the anomalies. For multiple holes at a given site (Thierry mine and Noront), simultaneous inversion was used. The pink and blue lines represent the inversions of the upper and lower bounds of the anomaly. For Otoskwin, the three lines are super-posed.
Viau et al., 2012), could not be resolved. Also, Chouinard and Mareschal (2007) suggested that the LIA could have started∼100 years earlier in northern Québec than in south-ern Canada. Resolving the LIA would require a borehole deeper than∼400 m, which is not the case of all the holes. Let us also point out that the sampling resolution at Nielsen Island is low, with measurements only every 30 m, which is not sufficient to resolve a LIA signal. While the absence of LIA signal in Québec was unexpected, its absence in north-ern Ontario confirms the findings of Gosselin and Mareschal (2003), who found only two sites with a LIA signal among 33 temperature–depth profiles from northwestern Ontario. They hypothesized that the lack of LIA signal could be due to the influence of Lake Superior because the two sites with LIA signals were above 50◦N and the furthest from Lake Supe-rior. This is not supported by the present study because the
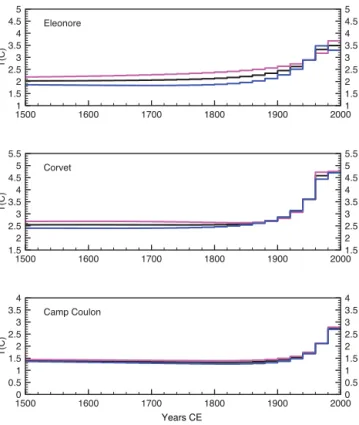
Years CE
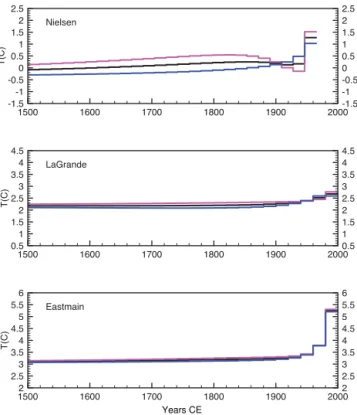
Figure 5.GST histories for the northern Québec sites. Simultane-ous inversion was used for Eastmain, which includes two holes. The pink and blue lines represent the inversions of the upper and lower bounds of the anomaly.
four Ontario sites are several hundreds of kilometres away from Lake Superior. It is also possible that the LIA signal is masked by other physical effects, such as an advance and retreat of permafrost or a change in the precipitation regime and the duration of the ground snow cover during the LIA.
No geographic trends in the GST histories were observed, despite different SAT conditions. Meteorological data from the NOAA weekly dataset and eight general circulation mod-els (GCMs) for the period of 1970–1999 display a longer snow cover duration in northern Québec than in northern On-tario (Brown and Mote, 2009). The higher precipitation is confirmed by proxy reconstructions of lake levels and tree forms (Bégin, 2000; Lavoie and Payette, 1992). Because of the greater snowfall and longer snow cover, the present ground surface relative to air surface temperatures in Québec are warmer than in Ontario. However, these dissimilar condi-tions have not resulted in noticeable discordance between the GST histories between northern Ontario and Québec, sug-gesting that the same differences in precipitation persisted throughout the period reconstructed.
Table 2.Location and technical information concerning boreholes not suitable for this study, whereTois the reference surface temperature
andQois the reference heat flux
Site Log ID Latitude Longitude To Qo Remark Reference
(◦N) (◦W) (◦C) (mW m−2)
Miminiska 0603 51◦34′51′′ 88◦31′09′′ 3.33±0.02 25.8±1.5 Too shallow Lévy et al. (2010) La Grande 0406 53◦31′42′′ 76◦33′49′′ 2.67±0.005 14.1±0.3 Topography Lévy et al. (2010) Eleonore 0503 52◦42′00′′ 76◦04′45′′ 2.56±0.01 27.7±0.6 Reservoir Lévy et al. (2010) Clearwater 0505 52◦12′33′′ 75◦48′38′′ 2.33±0.02 30.6±0.4 Lake Lévy et al. (2010) 0506 52◦12′31′′ 75◦48′23′′ 2.23±0.01 31.3±0.2 Lake Lévy et al. (2010) 0507 52◦12′39′′ 75◦48′23′′ 2.73±0.004 30.5±0.3 Lake Lévy et al. (2010) Poste Lemoyne 0715 53◦27′37′′ 75◦12′21′′ 1.83±0.004 24.5±0.2 Topography Lévy et al. (2010)
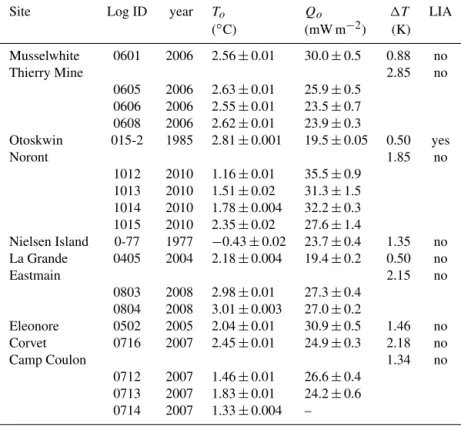
Table 3.Summary of GST history results, whereTois the reference surface temperature,Qois the reference heat flux, and1T is the
difference between the maximal temperature and the reference temperature 500 years before logging.
Site Log ID year To Qo 1T LIA
(◦C) (mW m−2) (K)
Musselwhite 0601 2006 2.56±0.01 30.0±0.5 0.88 no
Thierry Mine 2.85 no
0605 2006 2.63±0.01 25.9±0.5 0606 2006 2.55±0.01 23.5±0.7 0608 2006 2.62±0.01 23.9±0.3
Otoskwin 015-2 1985 2.81±0.001 19.5±0.05 0.50 yes
Noront 1.85 no
1012 2010 1.16±0.01 35.5±0.9 1013 2010 1.51±0.02 31.3±1.5 1014 2010 1.78±0.004 32.2±0.3 1015 2010 2.35±0.02 27.6±1.4
Nielsen Island 0-77 1977 −0.43±0.02 23.7±0.4 1.35 no La Grande 0405 2004 2.18±0.004 19.4±0.2 0.50 no
Eastmain 2.15 no
0803 2008 2.98±0.01 27.3±0.4 0804 2008 3.01±0.003 27.0±0.2
Eleonore 0502 2005 2.04±0.01 30.9±0.5 1.46 no Corvet 0716 2007 2.45±0.01 24.9±0.3 2.18 no
Camp Coulon 1.34 no
0712 2007 1.46±0.01 26.6±0.4 0713 2007 1.83±0.01 24.2±0.6 0714 2007 1.33±0.004 –
(Beltrami and Taylor, 1995; Taylor et al., 2006; Chouinard et al., 2007).
The sites are located in a region described as discontinu-ous permafrost, where ground temperatures are slightly be-low freezing, at least according to the Canadian and world permafrost maps. No sign of permafrost was found at any of the measured sites nor at the sites that were excluded (see Table 2); however, permafrost has been reported in the James Bay lowlands near Eleonore, Eastmain, and La Grande (Thibault and Payette, 2009). Not only are the present av-erage ground surface temperatures well above the freezing point of water, but, except for Nielsen Island, the ground sur-face temperature histories retrieved from inversion also
Years CE
Figure 6.GST histories for the northern Québec sites. Simultane-ous inversion was used for Camp Coulon, which includes more than one hole. The pink and blue lines represent the inversions of the up-per and lower bounds of the anomaly.
between permafrost maps and direct field observations reveal that SAT interpolations are unsuitable to estimate the spatial variations of ground temperatures. This is likely because the maximum thickness of snow exceeds 1 m at the end of the winter remaining on the ground from December to mid-April, resulting in a large offset between the GST and SAT (Zhang, 2005; Grosse et al., 2016). Our study suggests that borehole temperature profiles could be used in the future to assess the reality of the permafrost retreat assumed to have occurred after the LIA (Halsey et al., 1995; Schuur et al., 2008). Furthermore, borehole temperature profiles might be a better means for determining the southern extent of areas of past and present permafrost than current permafrost maps and a useful tool for validation of climate models.
6 Data availability
Appendix A: Detailed site description
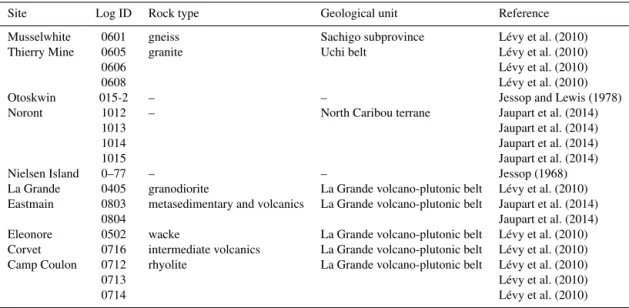
Ten sites, including 18 boreholes, were utilized to reconstruct the ground surface temperature history of northern Ontario and Québec for the past 500 years. A detailed description of the rock type and geological unit of each site can be found in Table A1 and heat flow studies of the region (Jessop, 1968; Jessop and Lewis, 1978; Lévy et al., 2010; Jaupart et al., 2014).
Four sites (Musselwhite, Thierry Mine, Otoskwin, Noront) comprising nine boreholes are located in northern Ontario. The Musselwhite (0601) site is located in a clearing of ∼60 m in diameter with a lake ∼330 m to the west and ∼180 m to the east. Three boreholes (0605, 0606, 0608) are located at Thierry Mine,∼500 m away from a large clear-ing. This clearing is associated with the development of the nearby mine in 1934–1950. Furthermore, all three sites are ∼300 m from a lake. 0605 and 0608 are found in a clearing due to drilling of∼80 m in diameter. The Otoskwin borehole was measured in 1985 and is located∼180 m from the Oto-skwin River. The final four Ontario boreholes (1012, 1013, 1014, 1015) are found in Noront. The sites are fairly flat,
Table A1.Geological unit and rock type concerning the boreholes used in this study.
Site Log ID Rock type Geological unit Reference
Musselwhite 0601 gneiss Sachigo subprovince Lévy et al. (2010)
Thierry Mine 0605 granite Uchi belt Lévy et al. (2010)
0606 Lévy et al. (2010)
0608 Lévy et al. (2010)
Otoskwin 015-2 – – Jessop and Lewis (1978)
Noront 1012 – North Caribou terrane Jaupart et al. (2014)
1013 Jaupart et al. (2014)
1014 Jaupart et al. (2014)
1015 Jaupart et al. (2014)
Nielsen Island 0–77 – – Jessop (1968)
La Grande 0405 granodiorite La Grande volcano-plutonic belt Lévy et al. (2010) Eastmain 0803 metasedimentary and volcanics La Grande volcano-plutonic belt Jaupart et al. (2014)
0804 Jaupart et al. (2014)
Eleonore 0502 wacke La Grande volcano-plutonic belt Lévy et al. (2010)
Corvet 0716 intermediate volcanics La Grande volcano-plutonic belt Lévy et al. (2010) Camp Coulon 0712 rhyolite La Grande volcano-plutonic belt Lévy et al. (2010)
0713 Lévy et al. (2010)
0714 Lévy et al. (2010)
Acknowledgements. The authors are grateful to Christian Chouinard, Claude Jaupart, and our colleagues at the Institut de Physique du Globe de Paris who helped with field measurements and core sample analysis. We appreciate the useful and constructive comments from two reviewers, an anonymous reviewer, and A. E. Taylor, R. Way, and Editor A. Winguth. This work was supported by grants from the Natural Sciences and Engineering Research Council of Canada Discovery Grant (NSERC DG 140576948) and the Canada Research Program (CRC 230687) to H. Beltrami. Computational facilities provided by the Atlantic Computational Excellence Network (ACENET-Compute Canada) with support from the Canadian Foundation for Innovation. H. Beltrami holds a Canada Research Chair in Climate Dynamics. C. Pickler is funded by graduate fellowships from a NSERC CREATE Training Program in Climate Sciences based at St. Fran-cis Xavier University.
Edited by: A. Winguth
Reviewed by: T. Alan and one anonymous referee
References
Archambault, S. and Bergeron, Y.: An 802-year tree-ring chronol-ogy from the Quebec boreal forest, Can. J. Forest Res., 22, 674– 682, doi:10.1139/x92-090, 1992.
Bartlett, M. G., Chapman, D. S., and Harris, R. N.: Snow effect on North American ground temperatures, 1950–2002, J. Geophys. Res.-Earth, 110, F03008, doi:10.1029/2005JF000293, 2005. Beck, A.: Climatically perturbed temperature gradient and their
effect on regional and continental heat-flow means, Tectono-physics, 41, 17–39, doi:10.1016/0040-1951(77)90178-0, 1977. Bégin, Y.: Reconstruction of subarctic lake levels over past
centuries using tree rings, J. Cold Reg. Eng., 14, 192–212, doi:10.1061/(ASCE)0887-381X(2000)14:4(192), 2000. Beltrami, H. and Bourlon, E.: Ground warming patterns in the
Northern Hemisphere during the last five centuries, Earth Planet. Sc. Lett., 227, 169–177, doi:10.1016/j.epsl.2004.09.014, 2004. Beltrami, H. and Mareschal, J.-C.: Ground temperature histories
for central and eastern Canada from geothermal measurements: Little Ice Age signature, Geophys. Res. Lett., 19, 689–692, doi:10.1029/92GL00671, 1992.
Beltrami, H. and Mareschal, J.-C.: Resolution of ground temper-ature histories inverted from borehole tempertemper-ature data, Global Planet. Change, 11, 57–70, doi:10.1016/0921-8181(95)00002-9, 1995.
Beltrami, H. and Taylor, A. E.: Records of climatic change in the Canadian Arctic: towards calibrating oxygen isotope data with geothermal data, Global Planet. Change, 11, 127–138, doi:10.1016/0921-8181(95)00006-2, 1995.
Beltrami, H., Cheng, L., and Mareschal, J. C.: Simultaneous inver-sion of borehole temperature data for determination of ground surface temperature history, Geophys. J. Int., 129, 311–318, doi:10.1111/j.1365-246X.1997.tb01584.x, 1997.
Beltrami, H., Smerdon, J. E., Matharoo, G. S., and Nickerson, N.: Impact of maximum borehole depths on inverted temperature histories in borehole paleoclimatology, Clim. Past, 7, 745–756, doi:10.5194/cp-7-745-2011, 2011.
Birch, A. F.: The effects of Pleistocene climatic variations upon geothermal gradients, Am. J. Sci., 246, 729–760, doi:10.2475/ajs.246.12.729, 1948.
Brown, J., Ferrians, O., Heginbottom, J. A., and Melnikov, E.: Circum-Arctic Map of Permafrost and Ground-Ice Conditions, Version 2., Map, National Snow and Ice Data Center, Boulder (CO), 2002.
Brown, R. D.: Analysis of snow cover variability and change in Québec, 1948–2005, Hydrol. Process., 24, 1929–1954, doi:10.1002/hyp.7565, 2010.
Brown, R. D. and Mote, P. W.: The response of Northern Hemi-sphere snow cover to a changing climate, J. Climate, 22, 2124– 2145, doi:10.1175/2008JCLI2665.1, 2009.
Bullard, E.: Heat Flow in South Africa, P. R. Soc. Lond. A, 173, 474–502, 1939.
Bunbury, J., Finkelstein, S. A., and Bollmann, J.: Holocene hydro-climatic change and effects on carbon accumulation inferred from a peat bog in the Attawapiskat River watershed, Hud-son Bay Lowlands, Canada, Quaternary Res., 78, 275–284, doi:10.1016/j.yqres.2012.05.013, 2012.
Carslaw, H. and Jaeger, J.: Conduction of Heat in Solids, Oxford Science Publications, New York, 1959.
Cermak, V.: Underground temperature and inferred climatic tem-perature of the past millennium, Palaeogeogr. Palaeocl., 10, 1– 19, doi:10.1016/0031-0182(71)90043-5, 1971.
Chouinard, C. and Mareschal, J.-C.: Selection of borehole temper-ature depth profiles for regional climate reconstructions, Clim. Past, 3, 297–313, doi:10.5194/cp-3-297-2007, 2007
Chouinard, C., Fortier, R., and Mareschal, J.-C.: Recent climate variations in the subarctic inferred from three borehole tempera-ture profiles in northern Quebec, Canada, Earth Planet. Sc. Lett., 263, 355–369, doi:10.1016/j.epsl.2007.09.017, 2007.
Clauser, C. and Mareschal, J.-C.: Ground temperature history in central Europe from borehole temperature data, Geophys. J. Int., 121, 805–817, doi:10.1111/j.1365-246X.1995.tb06440.x, 1995. Environment Canada: Canadian climate normals or averages 1981–
2010, National Climate Data and Information Archive, 2010. Fisher, D. A. and Koerner, R. M.: Signal and noise in four
ice-core records from the Agassiz Ice Cap, Ellesmere Is-land, Canada: details of the last millennium for stable iso-topes, melt and solid conductivity, Holocene, 4, 113–120, doi:10.1177/095968369400400201, 1994.
Gajewski, K.: Late Holocene climate changes in eastern North America estimated from pollen data, Quaternary Res., 29, 255– 262, doi:10.1016/0033-5894(88)90034-8, 1988.
García-García, A., Cuesta-Valero, F., Beltrami, H., and Smerdon, J.: Simulation of Air and Ground Temperatures in PIMIP3/CMIP5 Last Millenium Simulation: Implications for Climate Recon-structions from Borehole Temperature Profiles, Environ. Res. Lett., 11, 044022, doi:10.1088/1748-9326/11/4/044022, 2016. González-Rouco, J., Beltrami, H., Zorita, E., and Von Storch, H.:
Gosselin, C. and Mareschal, J.-C.: Recent warming in northwestern Ontario inferred from borehole temperature profiles, J. Geophys. Res.-Sol. Ea., 108, 2452, doi:10.1029/2003JB002447, 2003. Grosse, G., Goetz, S., McGuire, A. D., Romanovsky, V. E., and
Schuur, E. A.: Changing permafrost in a warming world and feedbacks to the Earth system, Environ. Res. Lett., 11, 040201, doi:10.1088/1748-9326/11/4/040201, 2016.
Gruber, S.: Derivation and analysis of a high-resolution estimate of global permafrost zonation, The Cryosphere, 6, 221–233, doi:10.5194/tc-6-221-2012, 2012.
Guillou-Frottier, L., Mareschal, J. C., and Musset, J.: Ground sur-face temperature history in central Canada inferred from 10 selected borehole temperature profiles, J. Geophys. Res., 103, 7385–7397, doi:10.1029/98JB00021, 1998.
Halsey, L. A., Vitt, D. H., and Zoltai, S. C.: Disequilibrium response of permafrost in boreal continental western Canada to climate change, Climatic Change, 30, 57–73, doi:10.1007/BF01093225, 1995.
Harris, R. N. and Chapman, D. S.: Mid-latitude (30–60 N) cli-matic warming inferred by combining borehole temperatures with surface air temperatures, Geophys. Res. Lett., 28, 747–750, doi:10.1029/2000GL012348, 2001.
Heginbottom, J. A.: Permafrost mapping: a review, Prog. Phys. Geog., 26, 623–642, doi:10.1191/0309133302pp355ra, 2002. Hotchkiss, W. and Ingersoll, L.: Post-glacial time calculations from
recent geothermal measurements in the Calumet Copper Mines, J. Geol., 42, 113–142, 1934.
Huang, S., Pollack, H. N., and Shen, P.-Y.: Temperature trends over the past five centuries reconstructed from borehole temperatures, Nature, 403, 756–758, doi:10.1038/35001556, 2000.
Jackson, D.: Interpretation of inaccurate, insufficient, and incon-sistent data, Geophys. J. Int., 28, 97–109, doi:10.1111/j.1365-246X.1972.tb06115.x, 1972.
Jaume-Santero, F., Beltrami, H., and Mareschal, J.-C.: North Amer-ican borehole temperature profiles suitable for climate studies, doi:10.6084/m9.figshare.2062140, 2016.
Jaupart, C. and Mareschal, J.-C.: Heat generation and transport in the Earth, Cambridge University Press, Cambridge, United King-dom, 2011.
Jaupart, C., Mareschal, J., Bouquerel, H., and Phaneuf, C.: The building and stabilization of an Archean Craton in the Supe-rior Province, Canada, from a heat flow perspective, J. Geophys. Res.-Sol. Ea., 119, 9130–9155, doi:10.1002/2014JB011018, 2014.
Jessop, A. and Lewis, T.: Heat flow and heat generation in the Supe-rior province of the Canadian Shield, Tectonophysics, 50, 55–57, doi:10.1016/0040-1951(78)90199-3, 1978.
Jessop, A. M.: Three measurements of heat flow in eastern Canada, Canadian J. Earth Sci., 5, 61–68, doi:10.1139/e68-006, 1968. Lachenbruch, A. and Marshall, B.: Changing climate: Geothermal
evidence from permafrost in the Alaskan Arctic, Science, 234, 689–696, doi:10.1126/science.234.4777.689, 1986.
Lanczos, C.: Linear Differential Operators, D. Van Nostrand, Princeton, N.J., 1961.
Lavoie, C. and Payette, S.: Black spruce growth forms as a record of a changing winter environment at treeline, Quebec, Canada, Arct. Alp. Res., 24, 40–49, doi:10.2307/1551318, 1992. Lévy, F., Jaupart, C., Mareschal, J.-C., Bienfait, G., and Limare,
A.: Low heat flux and large variations of lithospheric thickness
in the Canadian Shield, J. Geophys. Res.-Sol. Ea., 115, B06404, doi:10.1029/2009JB006470, 2010.
Lewis, T.: The effect of deforestation on ground surface temper-atures, Global Planet. Change, 18, 1–13, doi:10.1016/S0921-8181(97)00011-8, 1998.
Lewis, T. J. and Wang, K.: Influence of terrain on bedrock temper-atures, Palaeogeogr. Palaeocl., 98, 87–100, doi:10.1016/0031-0182(92)90190-G, 1992.
Lewis, T. J. and Wang, K.: Geothermal evidence for defor-estation induced warming: Implications for the climatic im-pact of land development, Geophys. Res. Lett., 25, 535–538, doi:10.1029/98GL00181, 1998.
Majorowicz, J. A., Skinner, W. R., and Safanda, J.: Large ground warming in the Canadian Arctic inferred from inver-sions of temperature logs, Earth Planet. Sc. Lett., 221, 15–25, doi:10.1016/S0012-821X(04)00106-2, 2004.
Mareschal, J., Poirier, A., Rolandone, F., Bienfait, G., Gariépy, C., Lapointe, R., and Jaupart, C.: Low mantle heat flow at the edge of the North American continent, Voisey Bay, Labrador, Geophys. Res. Lett., 27, 823–826, doi:10.1029/1999GL011069, 2000. Mareschal, J.-C. and Beltrami, H.: Evidence for recent warming
from perturbed geothermal gradients: examples from eastern Canada, Clim. Dynam., 6, 135–143, doi:10.1007/BF00193525, 1992.
Mareschal, J.-C., Rolandone, F., and Bienfait, G.: Heat flow vari-ations in a deep borehole near Sept-Iles, Québec, Canada: Paleoclimatic interpretation and implications for regional heat flow estimates, Geophys. Res. Lett., 26, 2049–2052, doi:10.1029/1999GL900489, 1999.
Matthews, J. A. and Briffa, K. R.: The “Little Ice Age”: Re-evaluation of an evolving concept, Geogr. Ann. A, 87, 17–36, doi:10.1111/j.0435-3676.2005.00242.x, 2005.
Menke, W.: Geophysical Data Analysis: Discrete Inverse Theory, vol. 4, Academic Press, San Diego, 1989.
Misener, A. and Beck, A.: The measurement of heat flow over land, Interscience, New York, 1960.
Nicault, A., Boucher, E., Tapsoba, D., Arseneault, D., Berninger, F., Bégin, C., DesGranges, J., Guiot, J., Marion, J., Wicha, S., and Begin, Y.: Spatial analysis of black spruce (Picea mariana (Mill.) BSP) radial growth response to climate in northern Québec– Labrador Peninsula, Canada, Can. J. Forest Res., 45, 343–352, doi:10.1139/cjfr-2014-0080, 2014.
Nielsen, S. and Beck, A.: Heat flow density values and paleocli-mate determined from stochastic inversion of four temperature-depth profiles from the Superior Province of the Cana-dian Shield, Tectonophysics, 164, 345–359, doi:10.1016/0040-1951(89)90026-7, 1989.
Phillips, D.: Climatic Atlas of Canada series 1, Tech. rep., Canadian Climate Center, Ottawa (ON), 2002.
Pickler, C., Beltrami, H., and Mareschal, J.-C.: Laurentide Ice Sheet basal temperatures during the last glacial cycle as inferred from borehole data, Clim. Past, 12, 115–127, doi:10.5194/cp-12-115-2016, 2016.
Pollack, H. N. and Smerdon, J. E.: Borehole climate reconstruc-tions: Spatial structure and hemispheric averages, J. Geophys. Res.-Atmos., 109, 8586–8596, doi:10.1029/2004JD005056, 2004.
pa-leoclimatic implications, J. Geophys. Res., 76, 8586–8596, doi:10.1029/JB076i035p08586, 1971.
Schuur, E. A., Bockheim, J., Canadell, J. G., Euskirchen, E., Field, C. B., Goryachkin, S. V., Hagemann, S., Kuhry, P., Lafleur, P. M., Lee, H., Mazhitova, G., Nelson, F. E., Rinke, A., Romanovsky, V., Shiklomanov, N., Tarnocai, C., Venevsky, S., Vogel, J. G., and Zimov, S. A.: Vulnerability of permafrost carbon to climate change: implications for the global carbon cycle, BioScience, 58, 701–714, doi:10.1641/B580807, 2008.
Shen, P. and Beck, A.: Paleoclimate change and heat flow den-sity inferred from temperature data in the Superior Province of the Canadian Shield, Palaeogeogr. Palaeocl., 98, 143–165, doi:10.1016/0031-0182(92)90194-A, 1992.
Shen, P. Y. and Beck, A. E.: Least squares inversion of borehole temperature measurements in functional space, J. Geophys. Res.-Sol. Ea., 96, 19965–19979, doi:10.1029/91JB01883, 1991. Taylor, A., Wang, K., Smith, S., Burgess, M., and Judge,
A.: Canadian Arctic Permafrost Observatories: detecting con-temporary climate change through inversion of subsurface temperature time series, J. Geophys. Res., 111, B02411, doi:10.1029/2004JB003208, 2006.
Thibault, S. and Payette, S.: Recent permafrost degradation in bogs of the James Bay area, northern Quebec, Canada, Permafrost Periglac„ 20, 383–389, doi:10.1002/ppp.660, 2009.
Vasseur, G., Bernard, P., de Meulebrouck, J. V., Kast, Y., and Jolivet, J.: Holocene paleotemperatures deduced from geothermal measurements, Palaeogeogr. Palaeocl., 43, 237–259, doi:10.1016/0031-0182(83)90013-5, 1983.
Viau, A. and Gajewski, K.: Reconstructing millennial-scale, re-gional paleoclimates of boreal Canada during the Holocene, J. Climate, 22, 316–330, doi:10.1175/2008JCLI2342.1, 2009. Viau, A., Ladd, M., and Gajewski, K.: The Climate of
North America during the past 2000 years reconstructed from pollen data, Global Planet. Change, 84–85, 75–83, doi:10.1016/j.gloplacha.2011.09.010, 2012.
Wang, K. and Lewis, T. J.: Geothermal evidence from Canada for a cold period before recent climatic warming, Science, 256, 1003– 1005, doi:10.1126/science.256.5059.1003, 1992.
Wang, K., Lewis, T. J., and Jessop, A. M.: Climatic changes in cen-tral and eastern Canada inferred from deep borehole tempera-ture data, Global Planet. Change, 6, 129–141, doi:10.1016/0921-8181(92)90031-5, 1992.