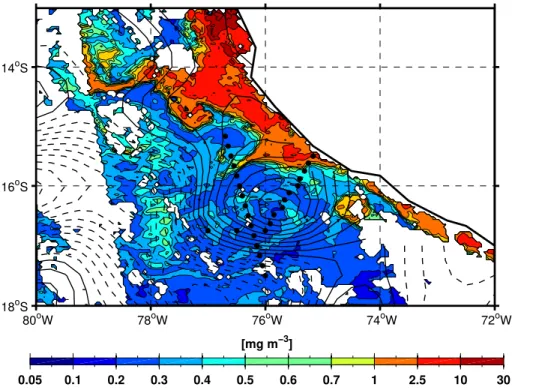
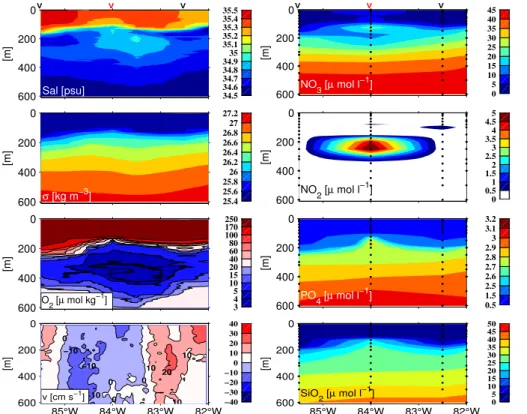
On the role of mesoscale eddies for the biological productivity and biogeochemistry in the eastern tropical Pacific Ocean off Peru
Texto
Imagem


Documentos relacionados
The probability of attending school four our group of interest in this region increased by 6.5 percentage points after the expansion of the Bolsa Família program in 2007 and
Na hepatite B, as enzimas hepáticas têm valores menores tanto para quem toma quanto para os que não tomam café comparados ao vírus C, porém os dados foram estatisticamente
Extinction with social support is blocked by the protein synthesis inhibitors anisomycin and rapamycin and by the inhibitor of gene expression 5,6-dichloro-1- β-
É importante destacar que as práticas de Gestão do Conhecimento (GC) precisam ser vistas pelos gestores como mecanismos para auxiliá-los a alcançar suas metas
Neste trabalho o objetivo central foi a ampliação e adequação do procedimento e programa computacional baseado no programa comercial MSC.PATRAN, para a geração automática de modelos
Ousasse apontar algumas hipóteses para a solução desse problema público a partir do exposto dos autores usados como base para fundamentação teórica, da análise dos dados
A infestação da praga foi medida mediante a contagem de castanhas com orificio de saída do adulto, aberto pela larva no final do seu desenvolvimento, na parte distal da castanha,
No caso e x p líc ito da Biblioteca Central da UFPb, ela já vem seguindo diretrizes para a seleção de periódicos desde 1978,, diretrizes essas que valem para os 7
