* Corresponding author.
E-mail: [email protected] (M. Fera)
© 2017 Growing Science Ltd. All rights reserved. doi: 10.5267/j.ijiec.2016.6.003
International Journal of Industrial Engineering Computations 8 (2017) 119–140
Contents lists available at GrowingScience
International Journal of Industrial Engineering Computations
homepage: www.GrowingScience.com/ijiec
The role of uncertainty in supply chains under dynamic modeling
M. Feraa*, F. Fruggierob, A. Lambiasec, R. Macchiarolia and S. Mirandac
aSecond University of Naples, Department of Industrial and Information Engineering, Via Roma 29, 81031 Aversa (CE), Italy
bUniversity of Basilicata, School of Engineering, Via Ateneo Lucano 10, 85100 Potenza, Italy
cUniversity of Salerno, Department of Industrial Engineering, Via Giovanni Paolo II 132, 84084 Fisciano (SA), Italy
C H R O N I C L E A B S T R A C T
Article history: Received April 4 2016 Received in Revised Format June 16 2016
Accepted June 27 2016 Available online June 27 2016
The uncertainty in the supply chains (SCs) for manufacturing and services firms is going to be, over the coming decades, more important for the companies that are called to compete in a new globalized economy. Risky situations for manufacturing are considered in trying to individuate the optimal positioning of the order penetration point (OPP). It aims at defining the best level of information of the client’s order going back through the several supply chain (SC) phases, i.e. engineering, procurement, production and distribution. This work aims at defining a system dynamics model to assess competitiveness coming from the positioning of the order in different SC locations. A Taguchi analysis has been implemented to create a decision map for identifying possible strategic decisions under different scenarios and with alternatives for order location in the SC levels. Centralized and decentralized strategies for SC integration are discussed. In the model proposed, the location of OPP is influenced by the demand variation, production time, stock-outs and stock amount. Results of this research are as follows: (i) customer-oriented strategies are preferable under high volatility of demand, (ii) production-focused strategies are suggested when the probability of stock-outs is high, (iii) no specific location is preferable if a centralized control architecture is implemented, (iv) centralization requires cooperation among partners to achieve the SC optimum point, (v) the producer must not prefer the OPP location at the Retailer level when the general strategy is focused on a decentralized approach.
© 2017 Growing Science Ltd. All rights reserved
Keywords: Supply chain Order penetration point Uncertainty
1. Introduction
Supply chain management (SCM) is generally divided into two main categories of issues: strategic and tactical. These two elements are present in many research approaches, but for the problem of locating the optimal order penetration point (OPP), the tactical and strategic decisions for supply chains (SCs) are merged. OPP, as defined by Olhager in 2003, is the one that ’sets the stage of the value chain of production, where a particular product is connected to a customer's request’ (Olhager, 2003).
(Petrovic, 2001). The uncertainty for the SC is linked to the stochastic behaviour of the volume of demand, customer requirements and changes in delivery times (Chauhan et al., 2009; Shukla et al., 2013). To meet the CS uncertainty, many authors have suggested using an approach based on cooperation between the different agents of the system. The economic externalities (due to the mismatch between information actors in the SC) can be reduced through a collaborative approach (Kwon et al., 2011; Hülsmann et al., 2008). The collaborative approach (that guarantees good results many times) can be used whenever a mathematical formulation and a simulation model are implemented in the design of an SC (Sambasivan et al., 2013; Efendigil & Önüt, 2012).
When the word ’collaborative’ is used, it needs to be meant as the management of the relations between actors of the SCs, paying attention to both strategic and tactical issues. It represents the functional integration of many interdependent activities that are capable of being translated in terms of money flows connected to goods, services and generally to the SC processes. To use this way to understand and design SCs, many theoretical models are available. It is worth noting that in SCM, both physical and information management structures are influenced by the coordination level between the SCs actors. Through the application of these models, it is possible to achieve a level of optimization that alters the storage and flow of information; moreover, these models are able to incorporate the impact of information technology tools, leading to the possibility of designing a distinct set of node connections to simulate and translate the collaborative issues, thus defining new SC substructures.
The main effects of SC performance that a collaborative approach can provide are as follows:(i) a general risk reduction and the achievement of competitive advantages, (ii) inventory level reduction, (iii) total cost reduction, (iv) lower customer rotation and (v) reduction in delivery lead time and revenue enhancements. To achieve these results, the main variables to be analysed are the price, quantity, shipment conditions (ex-works, free on board, etc.) and time, which are the main levers to obtain a coordinated SC (Tsay, 1999). In the literature there are present several coordination mechanisms for the price: (i) quantity discounts (Fugate et al., 2006), (ii) revenues shared (Kanda & Deshmukh, 2008), (iii) refund and part-return policy (Padmanabhan & Png, 1997; Sahin & Robinson, 2002) and (iv) sharing tariffs of the two actors involved (Fugate et al., 2006). For all the other variables not related to the price, coordination mechanisms are mainly constructed on flexibility capacity (Eppen & Iyer, 1997), allocation rules, i.e. rules for allocating the capacity among the different Retailers (Cachon & Lariviere, 2001), exclusive dealing (Besanko & Perry, 1993), policy management of inventory for vendor management (Sahin & Robinson, 2002; Waller et al., 1999), revenues growing for products with high variance of demand and outsourcing cost (Cheung & Lee, 2002), planning, forecasting and replenishment managed in a collaborative way (Esper & Williams, 2003; Kanda & Deshmukh, 2008), quick response (Sahin & Robinson, 2002), efficient customer response (Lohtia & Subramaniam, 2004), postponement (Pagh & Cooper, 1998) and the order penetration as introduced earlier (Yu et al., 2001). It is important to note that different OP points have effects on the design of SCs and the tactical and strategic perspective in its management.
Fig. 1. Order Penetration Point as tactical and strategic link among supply
/ International Journal of Industrial Engineering Computations 8 (2017)
collaboration with all the others actors in the SC. It influences the level of trust— related to the belief, decisions and actions in SCM (McEvily et al., 2003)—among SC echelons. The trust plays an essential role in the coordination process (Sako, 1994); indeed one of the most important research issues in this field is related to the idea of connecting all the actors in this “game” through a unique approach, translating the problem in a mathematical way.
This paper aims to build a system dynamics model to investigate the role of OPP in a collaborative strategy in order to assure performances reliable for the SCs. The authors want to suggest strategic and tactical choices in terms of OPP for the maximization of overall revenues and incomes that come from SCM.
2. Investigating SCs trends in literature references
The aim of this section is to identify the main paths—which are historically discussed and recognized— for SC uncertainty management. Authors present a bibliographic analysis to let the reader define the context (type of supply), mechanism (vertical integration among partners in centralized and decentralized forms) and tools (information exchange) of the simulation scenarios that will be implemented in the next sections of this paper.
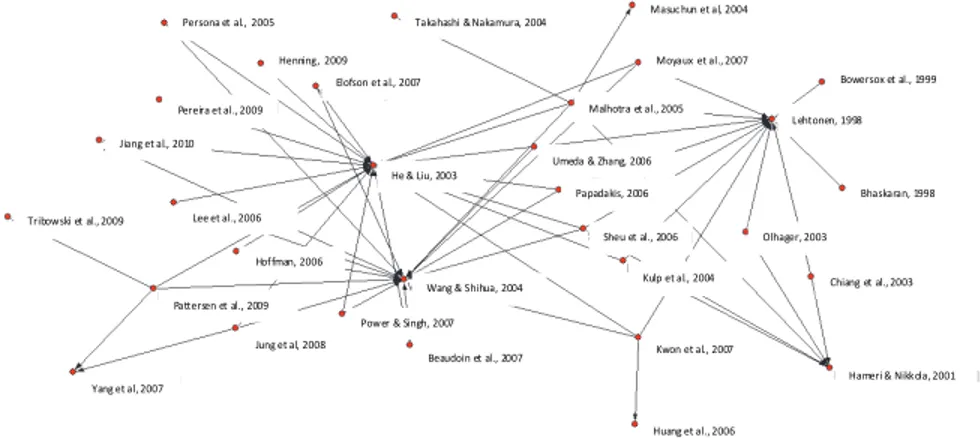
For this literature analysis, the Web of Science (WoS as per Thompson Reuters) is used. Researches on WoS were done for many publication years (1970–2015) and for several topics, all related to the terms ’Uncertainty’ and ’SC’. A selection among all the papers available was done, in such papers with more than 20 citations are included; this has led to the identification of 31 research papers, and each paper has a mean of 16.53 citations per year. A literature network was created to ease readers in their understanding, based on the static and dynamic interaction of knowledge. A main path analysis was performed (Colicchia & Strozzi, 2012), and a Pajek tool was used (http://pajek.imfm.si). The design of a SC is recognized in its strategic role historically (Lehtonen, 1998). The SC performances are monitored by the business strategy decision-makers, and generally, they are modified by the amount of trust and information sharing among the SC’s actors (Bowersox & Calantone, 1998).
Fig. 2. Reporting on static and dynamic interaction in the management of SCs: Citation Network of
relevant (>20 citations) trends for the WoS database in SC management
Interdependence between the actors' decisions; intensity of the relationships between actors; trust and information sharing between the actors; inventory system; information technology capabilities and the coordination structures (meant as SC architecture) are identified as strategic decisions for SCM, because they influence the enterprise in the long run. Collaboration in the SC is influenced by its structure, and because collaboration is difficult to implement, many times the echelons of the SC suffer from a lack of coordination mechanisms with several operative consequences even if it is demonstrated that coordination enhances the performances of both the supplier and the Retailer (Sheu et al., 2006). It is
Persona et al., 2005
Henning, 2009
Takahashi & Nakamura, 2004
Elofson et al., 2007
Masuc hun et al, 2004
Bowersox et al., 1999
L ehtonen, 1998
Bhaskaran, 1998
Olhager, 2003
Chiang et al., 2003
Hameri & Nikkola, 2001
Huang et al., 2006 Kwon et al., 2007
Kulp et al., 2004
Sheu et al., 2006
Papadakis, 2006
Umeda & Zhang, 2006
Malhotra et al., 2005
Moyaux et al., 2007
Beaudoin et al., 2007
Power & Singh, 2007
Wang & Shihua, 2004
Jung et al, 2008
Yang et al, 2007
He & Liu, 2003
Tribowski et al., 2009
Jiang et al., 2010
Lee et al., 2006
Hoffman, 2006
Pereira et al., 2009
important to underline that in the past, the main elements to achieve collaboration were put up as evidence. Indeed, based on a survey conducted in the industrial districts of northern Taiwan, it is possible to understand that the position in the network and the firm sizes are key factors—in terms of business success—for coordination and consequently, for the management of the SC (Wang et al., 2004).
Before starting to speak about the uncertainty, it is important to present the main causes of instability and uncertainty in SCM. Generally, it is possible to speak of horizontal integration (i.e. when a resource is shared between several actors of SCs) and of vertical integration (when it is possible to connect with and align the raw material of an actor with its final product). These two main categories of strategic design issues lead to instability of the SC processes due to their own statistic behaviours. This paper analyses only the role of vertical integration in SC performances. Therefore, with regard to the instability of the SC due to the vertical tactics, it is worth noting that stable performances, of the SC, can be achieved through controlling production schedules, extended to all the SC actors through sharing and management of information (Henning, 2009). If the control of the production schedule is not performed, instability arises and leads to high average inventory levels (Bhaskaran, 1998).
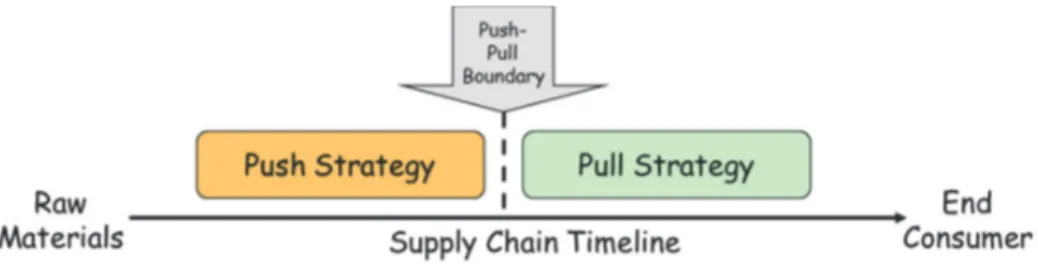
Another possible approach to enhancing the performances of SCs is the adoption of direct market strategies that can improve the manufacturing profitability for the SC. Moreover, this strategy increases the capability of negotiation and cooperation to allow SC performances to mature. As result of the application of this strategy, it is important to note that it is accompanied by wholesale price reduction with great margins for the Retailer. This strategy is accompanied by a retailer's stocks equilibrium that is generally produced by establishing an adequate balance between the push and pull approaches to satisfy demand (Chiang et al., 2003). To apply these strategies, several tactics could be used. The balancing between the planning for Manufacturing To Order (MTO) and for Manufacturing To Stock (MTS) is one of these; in SCs, they contribute to create different production variabilities and variances in the amount of safety stock required to satisfy a fixed service level (Ma et al., 2004). Moreover, there is the demand respond tactic (i.e., pull), which can lead to lower risk exposure after a sales or production disruption (Papadakis, 2006). Therefore, in general, it is possible to say that the direct market strategy improves reliability in marketplace service, but it requires integration among partners.
Even if this paper considers vertical integration for SCs, let us introduce the main issues of the horizontal integration strategy. Horizontal integration is the most important contributor to the cost-containment of the SC management process (Won et al., 2007). To implement it, the integration of the data among trading partners is required to enable effective management of the SC (Power& Singh, 2007). The partnership enables knowledge creation, operational efficiency and information exchange; collaboration and cooperation are fertile opportunities for advancing in SC optimization (Malhotra et al., 2005). Moreover, the partnership in SCM may reduce the risks of the bullwhip effect. To understand better which are the levers amenable for implementing a horizontal strategy, it is important to remember the decision-making model for supplier selection published by Cheng et al. (2006); this fuzzy model identifies the price, quality and delivery performance as the relevant variables for strategic selection of a partner between SC actors (Cheng et al., 2006).
Coordinating the different points of view between the Retailer (buyer driven) and the manufacturer (supplier driven) may help uncertainty management (Yang et al., 2007). Obviously, this difference between the SC actors is possible only if a cluster creation is made (i.e., between collectors, connectors, collaborators and so on). Therefore, the possibility of creating clusters can easily lead to a SC change. In fact, based on empirical data involving 281 Australian organizations, the structural changes and close collaboration with trading partners are required to realize a cost-effective perspective on SCs. The creation of an echelon as a collective customer in SCs can be a key factor in improving the overall performances in terms of service level and cost for centralized SCs (Elofson & Robinson, 2007).
/ International Journal of Industrial Engineering Computations 8 (2017)
(Umeda & Zhang, 2006). Coordination provides the possibility of managing and reducing the stochasticity of the process, which influences storage capacity between the echelons in the SC. In fact, for example, the coefficients of variation for the lead times were recognized as related to WIP (it increases when WIP increases) (Pettersen & Segerstedt, 2009). It is worth noting that the inventory level and the customer demand are recognised as the main contributors to the stochastic nature of SCs(Beaudoin et al., 2007).
To confirm the importance of customer demand in SCM, it is possible to cite a paper that demonstrated that the demand forecast can positively influence performances of small SCs (lower than four echelons) (Yan et al., 2003). Moreover, it is demonstrated that the continuous updating of the demand information can benefit the SC cost (that is demonstrated to be convex and differentiable with respect to order quantity). Moreover, another possibility of reducing the stochastic behaviour of the SCs is to manage and adjust the bidding behaviour; this management can help to respond effectively to changes in the SC and in the demand in the market (He et al., 2003).
On continual investigation of the role of OPP in SCs, the importance of demand volume and its volatility (generally expressed as Coefficient of Variation) for the production and the delivery lead-time becomes evident (Olhager, 2003). For enterprises, this is the main issue tied to the inventory problem (Hameri & Nikkola, 2001). It is worth noting that the investment required to achieve the minimum inventory level (that is the main effect in the post-OPP operations) and the maximum manufacturing efficiency (that is the main effect in the pre-OPP operations) affects customer service and also has effects on the operations costs. To facilitate improvement in the previously mentioned elements (i.e. the inventory level and the manufacturing efficiency), it is important to share information regarding the inventory levels and customers’ needs, which are generally are associated with higher measures of manufacturer performance (Kulp et al., 2004). The capacity to control both the previous variables and the ones related to them is typical of the hybrid control mechanism that generally is required (Takahashi & Nakamura, 2004). Starting from the external conditions of the market, it is possible to outline situations in which a pure push strategy outperforms a pull strategy in terms of customer service level and throughput. Even if, in general, the pull strategy reduces inventory levels in the SC (Masuchum et al., 2004). So, it is possible to affirm that the OPP location is relevant for the success of SCM.
In the general context of SC optimisation, it important to always remember the role of the bullwhip effect (Moyaux et al., 2007) that is influenced by several variables, such as the inventory management, lot-sizing, market supply, operations uncertainty and information sharing process.
The performances of the SCs obtained through integration are differentially associated with manufacturer performance. For example, vendor inventory management (in terms of collaborative planning or replenishment among all SC actors) is positively related to the increase of the margins for the manufacturer. Another example of relations between variables is the one between the higher prices of the Wholesaler and the lower stock-outs level of the Retailer and manufacturer. Moreover, collaboration between the SC actors for the creation of a new product or service is positively related to the performances of the entire SC (Hoffman et al., 2006). In this context of relations, great importance has to be laid on IT strategies, which can make the SC more robust and resilient to the uncertainties of the market and foster and help order management (Pereira, 2009). These relations are also observed on the online market where the navigability, price savings and security are equally important to create an SC success (Lee et al., 2006); in the online SC’s case, it is important to consider that to face the uncertainty and obsolescence in the products sold, the consignment stock strategy is generally suggested for implementation (Persona et al., 2005).
be present). A minimum amount of information sharing between the manufacturer and the third-party logistics provider (3PL) is considered to be the most important factor to implement decentralized planning fully (Jung et al., 2008).
After IT solutions, another technology that can help in the integration of information all along the SC is Radio Frequency Identification (i.e., RFiD); this technology is demonstrated to help in the standardization of the supply chain and in SC Event Management (SCEM) (Tribowski et al., 2009). Another hypothesis at the base of our model is that this technology is adopted in the proposed centralised coordination mechanisms. This choice is due to the will of the authors to reinforce the collaboration concepts between all the actors of the SC that can lead an increase in each player’s profit in the SC (Jiang et al., 2010).
2.1. Managing uncertainty in the SC
The problem of uncertainty in SCs produces risk, and it is related to SCs’ performances. Uncertainty in SCs is the final manifestation of factors influencing supply scenarios (Olhager, 2003). The main issues, on which the researchers focus, are: (i) SC inventory management, (ii) vendor selection, (iii) transport planning, (iv) production/distribution planning and (v) procurement-production-distribution planning. All these issues are reported to be planning strategy problems for SCs. Uncertainty in planning is the cause of errors, and generally, it influences the variability in SC performances, such as the variation in production and delivery lead times and the variation in stock levels (choosing a right mix between the push and pull strategies). Consequentially, it is possible to affirm that uncertainty management is correlated with the problem of effects measuring the strategic decisions in SC management and of its accuracy.
So, this literature review aims at individuating the contributions by the international scientific literature for the planning methods used to understand and manage uncertainty in SCs. Moreover, this study introduces the concept of measuring the effect of strategic decisions.
Numerous methods for uncertainty management in SCs use fuzzy logic (FL) as a tool. Many contributions use FL, introducing measures of performances for the SCs that are detectable and theoretically based. FL is used for modelling uncertainty and to understand and manage its effects on SCs oriented to the flow-process management and driven by the market. Peidro et al. (Peidro et al., 2009) used a fuzzy linear programming model to simulate the behaviours of a SC. Other authors used FL to face the inventory management issue (Petrovic et al., 1998; Petrovic et al., 1999; Giannoccaro et al., 2003; Carlsson & Fullér, 2002). FL also contributed to modelling the vendor selection strategies (Kumar et al., 2004; Amid et al., 2006). Similar investigations use FL for modelling uncertainty in transportation (e.g., for the time and quantity) between several echelons in SCs (Chanas et al., 1993; Julien, 1994; Liu & Kao, 2004; Liang, 2006). Moreover, other fields of application of FL in SCs are the planning of the correct production-distribution system and the investigation of the effects of different strategies for procurement-production-distribution (Sakawa et al., 2001; Liang, 2007; Selim et al., 2008; Aliev et al., 2007; Chen & Chang, 2006; Torabi & Hassini, 2008).
/ International Journal of Industrial Engineering Computations 8 (2017)
The system dynamics simulation technique is reported to be the main technique to represent, simulate and estimate the behaviours of the several subjects involved in an SC; even if in 2012, Tako and Robinson (Tako & Robinson, 2012) wrote a literature review regarding the techniques used in the SC context. Making a comparison between discrete event simulation (DES) and system dynamics (SD), they revealed that both DES and SD are good for the purpose of representing the different elements characterizing an SC. Actually, Lee and Chung (2012) used SD to understand and find possible representation and simulation scenarios of the inventory levels for the several players of a SC. Also, SD was used to represent the information sharing process in a SC (Feng, 2012). Moreover, it is possible to affirm that SD and FL may be able to report the role of strategy for demand forecasting for SCs (Campuzanoa et al., 2010). In general, as evident from the previous sentences, a comparison between DES and SD is possible; here, the authors want to mark the different application fields of these two methods. SD is recognized as the best technique to discuss regarding the added value of strategic and tactical decisions in SCs (Ashayeri & Lemmes, 2006), while the DES technique, using typical simulation software, is recognized as the leader in SC simulation of case-based scenarios (Lee et al., 2002; Persson & Araldi, 2009). Recently, a combination of DES and agent-based modelling was found to be the solution that allows the overcoming of the problem of simulating the dependencies between several partners in SCs (Long & Zhang, 2014).
In general, it is important to say that SCM is not just related to determining a consistent approach with the specific characteristics of the SC in analysis, but it also requires the identification of the correct performance measures. It is worth noting that SCs are quite difficult to measure, and this is for several reasons, such as the identification of the key points to be measured (financial and nonfinancial facets), social aspects, environmental aspects, technical parameters, customer satisfaction and product availability, etc. Between all these aspects, it is important to note that in the past few years, the environmental impact has grown in importance with the development of green and sustainable concepts for SCs (Sarkis et al., 2011). To make possible the involvement of all these aspects for SC management, the tools to be used are Balanced Scorecard (BS) and economic evaluation methods, which consider the costs and revenues from an SC system (Li et al., 2005; Pettersson & Segerstedt, 2013; Bhagwat & Sharma, 2007; Tracht et al., 2013). In our survey, we decided to investigate in-depth the financial methods, such as the net present value (NPV), to assess the goodness of a specific SC. In particular, NPV is used as an objective function to be maximized for SC optimization as also done by several literature sources (Chen, 2012; Bogataj et al., 2011; Naim, 2006). The NPV application enhances the strategic role of any SC decisions, reinforcing the concept in which any decision in an SC has a strategic influence in terms of investment. Indeed, the strategic facets are measured using a financial parameter, such as the annuity stream or NPV (Grubbström, 1986).
This paper discusses strategic decisions for the management of uncertainty in SCs. This paper uses one of the most used tools (as it is evident from the literature mentioned above) for modelling an SC and its behaviour rules, i.e. SD, and for interpreting the effects of the model, it uses NPV.
3. Modelling SCs scenarios under system dynamics
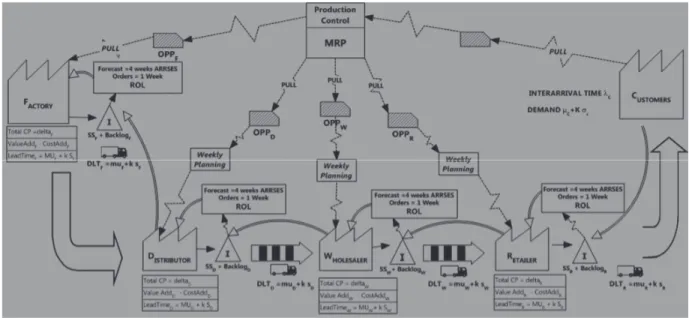
absence of closed-loop relations, so they use a ‘centralized’ system for the information in conformity with the previous definition.
Fig. 3. Mixing strategies for MTS and MTO penetration in SCs
If the SC analysed is not characterised by the last situation (i.e. there is a closed-loop scheme for the relation), each member of the SC uses forecasts for its own demand, including safety stock, and after that, it proceeds with order placement according to a demand forecast for its immediate downstream echelon. Each echelon deals with the maximization of the individual annuity stream measured in terms of NPV.
For this purpose, since the information sharing level is a fundamental factor in the simulation experiments presented in this paper, it is important to introduce the maximum and minimum levels of information sharing; this variable can range from ‘no-information’ to ‘complete’ information sharing.
Another fundamental issue to be discussed is related to the stochastic behaviour of the main SC variables. The traditional inventory models in SCs often use normal distributions and only focus on the forecast accuracy, not paying attention to the stock units’ locations, and the main SC variables, i.e. demand and lead time. In general, SC models consider the impact of several stocking scenarios, i.e. upstream and downstream for the actor considered. This kind of analysis generally leads to the creation of a stock that is capable of absorbing the variations of the variables before cited.
In the simulation model, a multi-echelon production system is considered. An SC is composed of four echelons. At the material flow level, each level consists of one inventory. Each echelon forecasts downstream demand (towards the end-consumer/s). At echelon n, the input at time t is the order rate ( ), which is determined by feeding forward the forecast of sales ( ) and feeding back the error in inventory and the work in progress ( ) to raise the actual value of the stream, which is calculated
through the cash flow ( ) of stocks. Direct (management and maintenance costs and financial
charges) and indirect costs (shortage and obsolescence costs), generally indicated as C(t) (Fig.6) related to the inventory, which are able to have a financial facet through the real payment (net value of & ) (Grubbström & Thorstenson, 1986; Grubbström & Kingsman, 2004) compared with the revenues actualized (i-rate in Fig.6).
/ International Journal of Industrial Engineering Computations 8 (2017)
arrive into the system at price p, which has been negotiated previously between the echelons. The error in will generate, as said before, an accumulation of stocks that influences the required service level ( ). It is important to say that all the problems involved in SC management will be dumped on the stock levels; in fact, forecast models try to reduce these effects on stocks, reducing the errors in lot-sizing, and generally, the forecast is upgraded in a closed-loop approach, adjusting the forecasting solution to the actual data available. Passing now to the other main actor in the single echelon, it is worth noting that the production department is dependent on the upstream levels, i.e. by the n-1 levels of echelons positioned behind it and by the flow of goods that is then based on the forecast and service level assumptions, which are dependent on the revenues and costs of the business. The replenishment strategy influences the amount of stocks in store at the echelon n level, and this, consequently, changes the purchasing cost for the customer from the supplier, limiting the future customers’ requests if these facets affect the price, which may increase and/or some stock-outs may occur.
Investments in SCs are generally put on a horizon of several years, so according to the time of investment, we get an annuity stream in SCM.
In the system, it is assumed that demand arrives according to a Poisson process with rate . Independent item demand rates are assumed to vary daily (t) and with sporadic surges in demand; to create a general distribution law, the Lyapunov Central Limit conditions are applied (Billingsley, 1986). Upon arrival, demand is normally distributed with mean and standard deviation σ that could be managed according to a k value based on Service Level (i.e., SLi with n=1,…,4) considerations (Rice, 1995).
Provisions for handling the uncertainty of domain are incorporated in decisions based on forecasting. A forecast horizon less than a product’s total Lead Time (i.e., LT) is assumed. LTn changes between
echelons. It is assumed in normal probability distribution. It is mainly divided into two blocks: 1) Production Lead Time (i.e., PLTn with n= 1,…,4) and Delivery Lead Time from/to echelon (i.e., DLTn
with n=1, …, 4) (Bertrand J.W.M. and Wortmann J.C., 1981). PTLn + DLTn forces echelon n to make
production decisions based on the forecasted consumption. Mean (i.e., mun) and standard deviation (i.e.,
sn) at echelon n are in the value stream map of figure 3. Demand at all points of supply is assumed with no trend and Adaptive Response Rate Single Exponential Smoothing is applied (i.e., ARRSES). The Tracking Signal measurement is obtained and looped to keep the forecast unbiased as changes in the pattern data occur. Continuous inventory review is applied, which means inventory is monitored continuously and orders can be placed at any time according to the replenishment strategy. This implies variability of quantity and order time intervals.
5). Applying the VMI strategy, considerable advantages in terms of the annuity stream could be gained from the Wholesaler.
Fig. 4. A Bullwhip Scenario under decentralized Management control (Q.ty report)
Fig. 5. Reporting about annuity stream under the condition of Bullwhip
Fig. 6. Reporting about Annuity Stream under coordination based on VMI strategy
Here, customer demand is changed in order to set conditions, as per EU recommendations (European Commission, 2003), for small- and medium-sized enterprises. According to the total balanced sheet,
Q 1 Q 2 Q 3 Q 4 Q 1 Q 2 Q 3 Q 4 Q 1 Q 2 Q 3 Q 4 Q 1 Q 2 Q 3 Q 4 Q 1 Q 2 Q 3 Q 4
2012 2013 2014 2015 2016
0 50 100 wdg
re ta ile r (wdg) whole sa le r (wdg) distributor (wdg) fa ctory (wdg)
12 13 14 15 16
0 10.000 20.000 30.000 40.000 50.000 e uro/wk
NP V_R NP V_W NP V_D NP V_F
12 13 14 15 16
-10.000 0 10.000 20.000 30.000 40.000 50.000 e uro/wk
/ International Journal of Industrial Engineering Computations 8 (2017)
demand by the customer for 102 unit/week realized an annual turnover of streams in the supply of ≤ 2 M€ (i.e., micro supply), demand for 103 unit/week produces 2 M€ ≤ turnover ≤ 10 M€ (i.e., small supply), and finally, demand 104 unit/week realizes 2 M€ ≤ turnover ≤ 50 M€ (i.e., medium supply).
An alternative location of OPP has been evaluated, including a measure of alteration in performance, i.e.
∆ with n alternatively F–factory, D-Distributor, W-Wholesaler or R-Retailer, based on a fixed acceptance, i.e., Δacpt, rate.
∆ , , , max, , , , , ,∆ , , , 1 (1)
Fig. 7. Control architecture for SCs management: CENTRALISED CONTROL [OBJ
MAX ∑ NPV t )] & DECENTRALISED CONTROL [OBJ MAX NPV t )]] - where t is the time
of strategy investment; I is the generic echelon with i=1,…,4.
The values in the table are reported according to eq.1. Δacpt means acceptable values of variation, which
is fixed at 10% as per the literature (Borgonovo, 2004). IND is set to whatever ΔNPV ≤ 0.1. Time
simulation and the number of replications was chosen as per Law and Kelton's (2000) (Law, 2000) approach with a Bonferroni correction due to multiple performance measures (Quinzi, 2004). The DoE limit in the analysis is set as per literature (Montgomery, 2012). NPV after 4 years from the strategy investment is considered.
In this analysis, authors accept the consideration of Harris (1913) who defined inventory holding costs and its related strategy in supply as an opportunity cost related to the customer/system satisfaction. Besides the capital inventory cost, there may be other out-of-pocket expenses, such as transportation, management, storage, spoilage, shrinkage and insurance to be accounted for the supply. These are included in the payment cost. Moreover, the reward from sales is included for revenue evaluation. Thus, using the consideration of Grubbström (Grubbström & Kingsman, 2004), according to the time of
ORDER
SUPPLYING
RESULT OF ORDER
INVENTORY ON HAND(t)
ACCEPTED ORDERS [DLT(t); p]
mu(t); s(t); SL; CP;PLT(t);DLT(t); C(t); irate
INV(t); WIP(t);LT(t); C(t); irate
AS(t)
NPV
Forecast
CLIENT
SUPPLIER δ (t); λ(t)
δ (t)
p; δ (t)
INV(t)
investment, these become the cash flow of revenues and payment, and they are then transformed into an annuity stream. This yields the NPV of configuration at issue at the level i into supply. NPV is intended to be the equivalent cash flow generating the same NPV of a zeroth/first order approximation of the annuity stream (i.e., Annual Cost: AC).
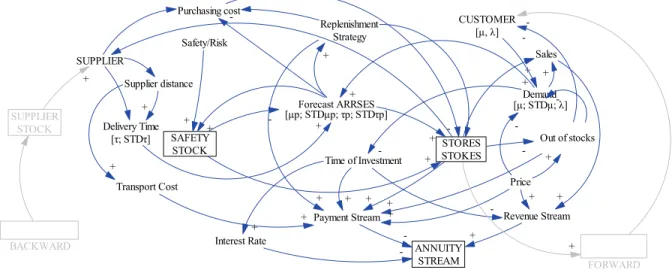
Fig. 8. CLD of generic echelon i of SC - Backward & Forward relation in grey characters
4. The role of OPP in echelon strategy whenever the decentralized approach comes out
First, let us consider the Retailer. If the Retailer only incurs inventory-related costs (that is, the costs related to order variance are constant and zero, as a consequence of which there is no stock-out probability, and under the condition of non-obsolescence of the product, the minimum is the warehousing cost) the position of OPP does not depend on demand (in terms of quantity). Retailers could get optimal performance with OPP varying randomly backward into supply (Fig. 9). This could beget considerable advantages under the condition of coalition between echelons of supply. Increasing product demand volatility driven in second quartile probability, Retailers could reduce performance in NPV by transmitting information on the customer’s order into the supply. Under this condition, the backward-moving OPP does not remarkably influence Retailer costs and strategies for optimisation. This means that if echelons in supply are able to control customer preferences in unseasonal and high-frequency demand, Retailers do not need to worry about OPP location. Pull strategies are preferable for Retailers under the condition of high-volume demand. Here, if volatility in demand moves casually around the trend, the Wholesaler is in the preferable position of order penetration. Otherwise, whatever the increase in seasonality, OPP moves backwards up to the Factory under the condition of unstable delivery time. If an inadequate forecast generates a stock-out amount, Retailers prefer a joint purchase order quantity strategy under the condition of limited orders (demand nearby the first quartile in probability) and average standard deviation (after second quartile) in demand. As volatility in demand increases, the position of OPP moves backward to the Wholesaler, while accepting the Distributor and Factory positions with limited (under 5% variation) reduction in the annuity stream. Flexibility in the position of the order is guaranteed here under limited variation (under optimum of about 7%) of NPV. Thus, the push strategy is preferable for supply when the demand volatility is above the second percentile. The Wholesaler gets leadership in supply (it maintains the key role regarding information) when demand volatility is above the third percentile. Increasing the stock-out cost and standard deviation in demand (above the 50th percentile) in a situation in which Warehouse costs influence the Retailer’s cash flow, the
Factory gets the optimum position of OPP. Variation in NPV for the Retailer is remarkable if supply is organized with an OPP that moves forward/backward when the demand is over-planned. Push strategies are preferable for the Retailer whenever the volatility in demand is above the second quartile; a push/pull
ANNUITY STREAM STORES STOKES Forecast ARRSES Delivery Time [τ; STDτ]
[ p; STD p; τp; STDτp]
Supplier distance SUPPLIER + + Demand + Price
Out of stocks
+ -Payment Stream + Revenue Stream + Sales + + + CUSTOMER [ , ] + Transport Cost + + - + Safety/Risk SAFETY STOCK + + + + Time of Investment
[ ; STD ; ]
/ International Journal of Industrial Engineering Computations 8 (2017)
strategy for supply is suggested when STD is above the 75th percentile. OPP in the Wholesaler is
preferable for the growth of cash flow for the Retailer. OPP moves backwards until the Distributor and the Factory if market origins stock-out of upper medium entity and STD of upper 75th percentile and
product originate from medium to upper Warehouse costs. These factories make preference in pull strategies.
If supply performances are investigated in order to preserve the Wholesaler in the chain, under the condition of limited volatility of demand and when limited products (either of them under the first quartile in probability) are moving in supply, the Distributor has to maintain the central information role in order penetration (Fig. 9). Flexibility in the OPP strategy is maintained under conditions of limited volume of product in supply. If demand manifests a trend and seasonality that could considerably increase volume of demand from standard planned conditions, with different configurations of costs (i.e., Warehouse and stock ones) and with the upper first quartile of instability of demand (i.e., STD), supply considerably gains from optimality, setting OPP. It moves backwards from the Wholesaler to the Factory as STD increases. The Retailer is in the preferable position of OPP when demand maintains stability over time. While increasing the influence of stock-outs in terms of cost per unit per time, the Warehouse prefers the pull approach. Moving OPP backwards into supply remains the optimal strategy in the Wholesaler’s interest under the condition of volatility in demand. The Wholesaler has to transmit information about ordering backwards to the Distributor and then to the Factory whenever the lead-time variability increases and demand becomes chaotic. The pull strategy is required whenever it is not possible to plan demand.
Fig. 9. Annuity Stream contour plot with different OPP location in: 1=RETAILER; 2=WHOLESALER;
3=DISTRIBUTOR; 4=FACTORY under different incidence of holding and stock-out (demand in small range) amount
For the Distributor in decentralised SC under limited demand for the product and stable planning conditions, a stock-out does not influence its profit (Fig. 9). The push strategy is preferable for the Distributor when the volume of the product increases in an upward trend and seasonality effects occur. In markets with a considerable quantity of the product (above 10,000 weekly, a medium SC is set), and in situations of unstable forecasting conditions, OPP has to move backwards to supply until the Factory echelon if the Distributor’s profits are going to be optimised. If stability of demand occurs, the push
OPP ST D [ % ] 4 3 2 1 0,50 0,25 0,00 > – – – – – < 14500 14500 15000 15000 15500 15500 16000 16000 16500 16500 17000 17000 NPV R [k euro] Contour Plot of NPV R [keuro] vs STD [%]; OPP
OPP ST D [ % ] 4 3 2 1 0,50 0,25 0,00 > – – – – < 15000 15000 16000 16000 17000 17000 18000 18000 19000 19000 NPV W [k euro]
Contour Plot of NPV W [keuro] vs STD [%]; OPP
OPP ST D [ % ] 4 3 2 1 0,50 0,25 0,00 > – – – < 15000 15000 16000 16000 17000 17000 18000 18000 NPV D [keuro] Contour Plot of NPV D [keuro] vs STD [%]; OPP
OPP ST D [ % ] 4 3 2 1 0,50 0,25 0,00 > – – – < 8000 8000 10000 10000 12000 12000 14000 14000 NPV F [keuro]
strategy could be alternatively applied to supply if the Distributor wants to optimize its performances in terms of NPV. The Distributor can exchange information, and it need not be worried about them, with echelons in supply in any condition under the 75th percentile of demand volume. Here, there is a reduction
of NPV greater than generally maintained (under 9%), and it is limited to a 5% reduction of NPV when cutbacks in stock-out cost per unit of the product in time occur (under the 50th percentile) and forecasting
conditions are arranged (predictability and volatility of demand and lead time is around the 50th
percentile). Speculative strategies between actors in supply are possible in cases in which the company bets on a single scenario.
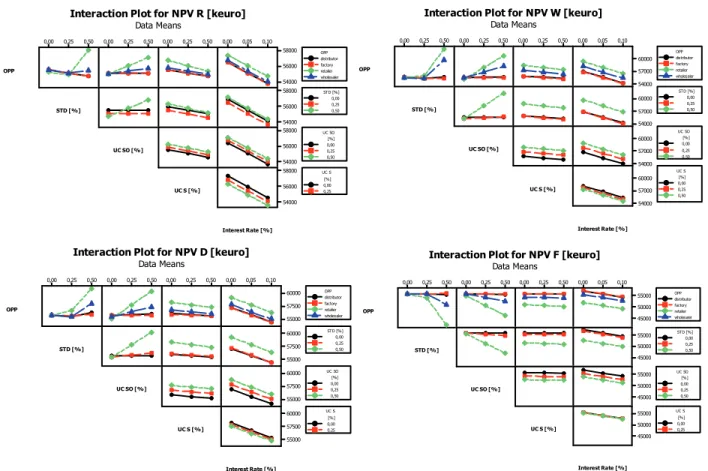
Fig. 2. Interaction Plot of main factors for NPV performances in DECENTRALIZED CONTROL
ARCHITECTURE
Increasing probability to incur in stock-out, and whatever this manifests cost that are almost equal to product cost, the Factory remains the key element (i.e., the leader) in supply, and it has to maintain the knowledge of order, so the Distributor needs to worry about the information it transmits and communicates—while improving a pure pull strategy in supply. As discussed above, under any condition of unpredictability of demand and lead time, the position of order penetration has to be maintained at the Retailer’s end if the Factory wants to reduce its payment streams and aims at improving its annuity stream. This means that the Factory has to use the push approach if the forecast in demand could fail (Fig.9). Here, the Factory is going to influence—a non-cooperation game is set up— the echelon’s performance as well as overall rewards. This notwithstanding, the Factory would be able to optimize its net profits. This strategy guarantees the Factory security from bullwhipping. From limited to low variation in demand under predictable delivery times (under the 50th percentile in probability), the OPP location does not exert remarkable influence over the Factory streams (under 10% of the optimal variation of NPV is manifested). This does not make any difference in performance if demand is stable in time. Moreover, considering the incidence of warehousing in terms of cost as the cost of the product is growing, moving forward into supply and is reported in comparison with stock-outs. Mainly fixed in
0,50 0,25
0,00 0,00 0,25 0,50 0,00 0,25 0,50 0,00 0,05 0,10 58000 56000 54000 58000 56000 54000 58000 56000 54000 58000 56000 54000 OPP STD [%]
UC SO [%]
UC S [%]
Interest Rate [%]
distributor factory retalier wholesaler OPP 0,00 0,25 0,50 STD [%] 0,00 0,25 0,50 [%] UC SO 0,00 0,25 [%] UC S Interaction Plot for NPV R [keuro]
Data Means
0,50 0,25
0,00 0,00 0,25 0,50 0,00 0,25 0,50 0,00 0,05 0,10
60000 57000 54000 60000 57000 54000 60000 57000 54000 60000 57000 54000 OPP STD [%]
UC SO [%]
UC S [%]
Interest Rate [%]
distributor factory retalier wholesaler OPP 0,00 0,25 0,50 STD [%] 0,00 0,25 0,50 [%] UC SO 0,00 0,25 0,50 [%] UC S Interaction Plot for NPV W [keuro]
Data Means
0,50 0,25
0,00 0,00 0,25 0,50 0,00 0,25 0,50 0,00 0,05 0,10
60000 57500 55000 60000 57500 55000 60000 57500 55000 60000 57500 55000 OPP STD [%]
UC SO [%]
UC S [%]
Interest Rate [%]
distributor factory retalier wholesaler OPP 0,00 0,25 0,50 STD [%] 0,00 0,25 0,50 [%] UC SO 0,00 0,25 [%] UC S Interaction Plot for NPV D [keuro]
Data Means
0,50 0,25
0,00 0,00 0,25 0,50 0,00 0,25 0,50 0,00 0,05 0,10
55000 50000 45000 55000 50000 45000 55000 50000 45000 55000 50000 45000 OPP STD [%]
UC SO [%]
UC S [%]
Interest Rate [%]
distributor factory retalier wholesaler OPP 0,00 0,25 0,50 STD [%] 0,00 0,25 0,50 [%] UC SO 0,00 0,25 [%] UC S Interaction Plot for NPV F [keuro]
/ International Journal of Industrial Engineering Computations 8 (2017)
terms of the cost involved in purchase, maintaining safety stocks is unable to remarkably condition performance of the Factory in terms of the annuity stream. The pull strategy is generally not preferable for the Factory in any condition of demand and instability of market. OPP could be moved backwards or forward in supply under limited (under 7%) variation of the annuity stream.
5. The role of OPP in echelon strategy whenever centralized approach is coming out
Under a centralized control mechanism, the inventory decisions are made by a single decision-maker whose objective is to minimize system-wide cost (Fig.10).
Holding cost (UC_S in Fig. 10) influences the NPV of supply if stock-out costs are of a limited amount (≤0.25 €/unit*time)). If the product matches the limited amount of obsolescence and shortage cost does not occur, in a stable and trusty market, the demand rate does not influence the position of OPP that could be maintained at any echelon of supply if marginal changes in optimization performances are accepted.
In stable markets (with no correlation between events, this permits reference to the first quartile of cumulative standard deviation of demand), OPP does not influence global revenues if products have limited obsolescence (under the first quartile in cost per unit per time). The stability of the market is not relevant if the product requires high costs in maintaining and stock-out probability is limited. Here, OPP requires to be settled at the lowest level of supply (i.e., Retailers). Fixed warehousing costs with limited holding cost (0.25 ≤ Wh_c ≤0.5) in a small or medium market allows OPP fluctuations even though an optimal collocation of the pull/push hinge is admitted. In this case, the position of OPP moves forward from the Factory to the Retailer in a stable (first quartile in demand variation) market with limited unit stock-out cost. In cooperative supplies handling a huge amount of products (cumulative demand rate near 104 unit/week—medium enterprises), there exists optimum OPP. Volatility in demand influences Warehouse costs while preferring batch orders although seasonality in demand occurs. Here, pull supplies, under conditions of unstable market and relevant shortage cost per unit per time (i.e., OPP in the Factory), is required for the optimisation of overall performances. A pure push strategy in supply is required whenever stock-out cost is of a limited amount of unit per time (first quartile). OPP moves backwards as uncertainty in market increases. Here, the Warehouse cost influences the OPP location: the Retailer is preferable over the Factory location.
The performance of cost in supply is mainly influenced by stock and stock-out costs. The latter requires the careful definition of operations and a replenishment strategy while influencing inventory strategy. OPP movement from upstream to downstream is required as global contingency influences the stability of the market. There are two major driving forces shifting the OPP backwards: (i) reducing uncertainty in delivery time and demand and (ii) reducing the cost of stocks by optimising inventory strategies. In these cases, when the lead time is controllable (variance under one unit point) or alternatively fixed, work in process and the risk of obsolescence and reliance on forecast reduces. A reduction in manufacturing efficiency as well as in forecasting performances (optimal values in smoothing have to be set) improves probability (i.e., obsolescence and stock-out) to obtain optimal performance while shifting OPP forward.
6. Conclusion
sometimes suggested but mainly the Retailer dominates scenarios. Nash equilibrium could be arranged in this situation.
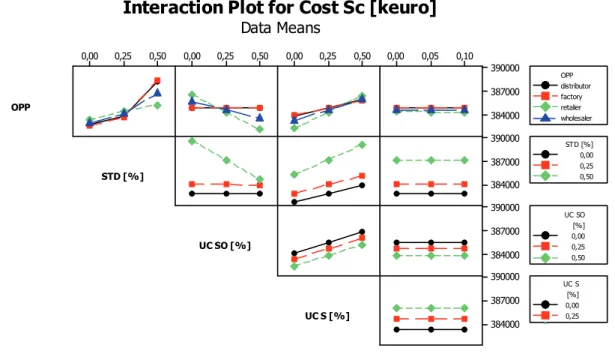
Fig. 11.Sensitiveness analysis under different simulation scenarios in four echelons of SCs with
centralised control strategy: Annuity Stream (cost) and NPV reports are reported under different configuration scenarios.
Legend cell: [Position of the OPP opt, alternative collocation OPP∆ , , , ]- IND= no preference
.
acpt Δ evaluated according eq.1 with fixed 10% of
∆ , , ,
between echelons.
Stokes in the SC is the buffer of goods and services that players offer to the customer. Also, stokes is the amount of annuity stream connected to stochastic amounts of order at stochastic intervals. The inventory
0,50 0,25
0,00 0,00 0,25 0,50 0,00 0,25 0,50 0,00 0,05 0,10
390000
387000
384000
390000
387000
384000
390000
387000
384000
390000
387000
384000 OPP
STD [%]
UC SO [%]
UC S [%]
Interest Rate [%]
distributor factory retalier wholesaler OPP
0,00 0,25 0,50 STD [%]
0,00 0,25 0,50 [%] UC SO
0,00 0,25 [%] UC S
Interaction Plot for Cost Sc [keuro]
/ International Journal of Industrial Engineering Computations 8 (2017)
pattern is the payment/reward amount that the management decides according to a defined replenishment strategy.
Players in the SC should make re-engineering efforts to minimize volatility in customers’ order and lead time while creating the most accurate forecast strategy. This generally supports growth in the annuity stream, and it optimizes the value of investment in time. An optimal optimisation strategy in a centralized SC requires players to first understand their own demand. Then, based on the characteristics of the product and its related market (i.e., price, demand rate and volatility and stock-out cost), the correct strategy in inventory management can be established. Confirming risk pooling concepts, a centralized control approach manifests lower inventory levels without affecting the service level.
The strategy in inventory prefers the push approach (OPP for the Retailer) and cooperation between players in supply is not required if uncertainty in deliveries and unpredictability occur as forecasted. Higher demand uncertainty leads to a SC based on realised demand: pull customer-driven supply. This is true whenever small and medium quantities are moved and the incidence of stock-out cost and Warehouse management costs is limited to a small percentage per unit per time in comparison with product cost. Normally, small and medium SCs suffer from scarce capital resources, and this can condition the inventory strategy. In this condition, moving OPP backwards from the Retailer to the Distributor and eventually to the Factory will help in dealing with great stock-out and Warehouse management costs. Alternative strategies, moving from push to pull, can be admitted in micro-centralized SCs with limited volatility in demand and lead times.
The Factory has to know the costumer’s requirements and trend (i.e., OPP for the Factory) whenever a competitive (decentralized) SC is set under conditions of almost chaotic environments. Here, the Factory does not absolutely prefer a Retailer-driven SC. As the Factory treats raw materials and consequently, has the lowest price of the product in supply, it prefers be organized in the push approach (i.e., OPP for the Distributor or the Wholesaler) whenever small and medium quantities are moved under limited forecasting conditions.
The Distributor generally prefers a Retailer-driven SC under uncertainty in small- and medium-sized environments and whenever stock-out draws on the upper medium value of volume per time. Here, the Distributor has to share information about customers’ orders in a timely and accurate manner while suffering a Factory-driven supply if optimization in its performances is to manifest.
OPP for the Retailer remains the preferable strategy for individual Wholesaler optimisation and whenever the Retailer forecasts to follow the current demand under different configurations of supply in terms of volatility in demand and uncertainty of the domain.
Reasonable performances of the SC could be achieved from altruistic Retailers when stability in demand occurs and stock-out cost does not remarkably influence the annuity stream. Re-engineering efforts at the Factory level are not required in decentralized supply under stable predictability conditions. Altruistic behaviour is suggested for the Distributor and the Wholesaler to gain individually optimal performance in terms of NPV. The Retailer is generally the leader in the SC, but this sometimes does not guarantee optimal global performances in a centralised approach.
References
Amid, A., Ghodsypour, S. H., & O’Brien, C. (2006). Fuzzy multiobjective linear model for supplier selection in a supply chain. International Journal of Production Economics, 104(2), 394-407. Ashayeri, J., & Lemmes, L. (2006). Economic value added of supply chain demand planning: A system
dynamics simulation. Robotics and Computer-Integrated Manufacturing, 22(5), 550-556.
Bhagwat, R., & Sharma, M. K. (2007). Performance measurement of supply chain management: A balanced scorecard approach. Computers & Industrial Engineering, 53(1), 43-62.
Beaudoin, D., LeBel, L., & Frayret, J. M. (2006). Tactical supply chain planning in the forest products
industry through optimization and scenario-based analysis. Canadian Journal of Forest
Research, 37(1), 128-140.
Bertrand, J. W., & Wortmann, J. J. (1981). Production control and information systems for component-manufacturing shops (Doctoral dissertation, Elsevier Scientific Publishing Company).
Besanko, D., & Perry, M. K. (1993). Equilibrium incentives for exclusive dealing in a differentiated products oligopoly. The RAND Journal of Economics, 24(4), 646-667.
Bhaskaran, S. (1998). Simulation analysis of a manufacturing supply chain.Decision Sciences, 29(3), 633.
Billingsley, P. (1986). Probability and Measure, 2nd ed. New York: p. 371: Wiley.
Bogataj, M., Grubbström, R. W., & Bogataj, L. (2011). Efficient location of industrial activity cells in a global supply chain. International journal of production Economics, 133(1), 243-250.
Borgonovo, E., & Peccati, L. (2004). Sensitivity analysis in investment project evaluation. International Journal of Production Economics, 90(1), 17-25.
Bowersox, D. J., & Calantone, R. J. (1998). Global logistics. Journal of International Marketing, 83-93. Cachon, G. P., & Lariviere, M. A. (2001). Contracting to assure supply: How to share demand forecasts
in a supply chain. Management science, 47(5), 629-646.
Carlsson, C., & Fullér, R. (2002). A fuzzy approach to taming the bullwhip effect. In Advances in Computational Intelligence and Learning (pp. 247-262). Springer Netherlands.
Campuzano, F., Mula, J., & Peidro, D. (2010). Fuzzy estimations and system dynamics for improving supply chains. Fuzzy Sets and Systems, 161(11), 1530-1542.
Chen, C. T., Lin, C. T., & Huang, S. F. (2006). A fuzzy approach for supplier evaluation and selection in supply chain management. International Journal of Production Economics, 102(2), 289-301. Chen, P. Y. (2012). The investment strategies for a dynamic supply chain under stochastic
demands. International Journal of Production Economics, 139(1), 80-89.
Cheung, K. L., & Lee, H. L. (2002). The inventory benefit of shipment coordination and stock rebalancing in a supply chain. Management Science,48(2), 300-306.
Chiang, W. Y. K., Chhajed, D., & Hess, J. D. (2003). Direct marketing, indirect profits: A strategic analysis of dual-channel supply-chain design. Management science, 49(1), 1-20.
Colicchia C. & Strozzi, F. (2012). Supply chain risk management: A new methodology for a systematic.
Supply Chain Management: An International Journal,17(4), 403 - 418.
Chauhan, S. S., Dolgui, A., & Proth, J. M. (2009). A continuous model for supply planning of assembly
systems with stochastic component procurement times. International Journal of Production
Economics, 120(2), 411-417.
Chanas, S., Delgado, M., Verdegay, J. L., & Vila, M. A. (1993). Interval and fuzzy extensions of classical transportation problems. Transportation Planning and Technology, 17(2), 203-218.
Chen, S. P., & Chang, P. C. (2006). A mathematical programming approach to supply chain models with fuzzy parameters. Engineering Optimization, 38(6), 647-669.
Efendigil, T., & Önüt, S. (2012). An integration methodology based on fuzzy inference systems and neural approaches for multi-stage supply-chains.Computers & Industrial Engineering, 62(2), 554-569.
Elofson, G., & Robinson, W. N. (2007). Collective customer collaboration impacts on supply-chain performance. International Journal of Production Research, 45(11), 2567-2594.
Eppen, G. D., & Iyer, A. V. (1997). Backup agreements in fashion buying—the value of upstream flexibility. Management Science, 43(11), 1469-1484.
Esper, T. L., & Williams, L. R. (2003). The value of collaborative transportation management (CTM): its relationship to CPFR and information technology.Transportation Journal, 42(4), 55-65.
/ International Journal of Industrial Engineering Computations 8 (2017)
Esmaeili, M., Aryanezhad, M. B., & Zeephongsekul, P. (2009). A game theory approach in seller–buyer supply chain. European Journal of Operational Research, 195(2), 442-448.
Esmaeili, M., Aryanezhad, M. B., & Zeephongsekul, P. (2009). A game theory approach in seller–buyer supply chain. European Journal of Operational Research, 195(2), 442-448.
Feng, Y. (2012). System Dynamics Modeling for Supply Chain Information Sharing. Physics Procedia, 25, 1463 – 1469 .
Fisher, M. L., Hammond, J. H., Obermeyer, W. R., & Raman, A. (1994). Making supply meet demand in an uncertain world. Harvard Business Review, 72, 83-83.
Fugate, B., Sahin, F., & Mentzer, J. T. (2006). Supply chain management coordination mechanisms. Journal of Business Logistics, 27(2), 129-161.
Giannoccaro, I., Pontrandolfo, P., & Scozzi, B. (2003). A fuzzy echelon approach for inventory management in supply chains. European Journal of Operational Research, 149(1), 185-196.
Grubbström, R. W., & Kingsman, B. G. (2004). Ordering and inventory policies for step changes in the unit item cost: a discounted cash flow approach.Management science, 50(2), 253-267.
Grubbström, R. W., & Thorstenson, A. (1986). Evaluation of capital costs in a multi-level inventory system by means of the annuity stream principle.European Journal of Operational Research, 24(1), 136-145.
Hameri, A. & Nikkola, J., 2001. Order penetration point in the paper supply chain. Paperi Ja Puu-Paper and Timber, 83(4), 299-302.
Harris, F. M. (1913). How Many Parts to Make at Once. Factory, The Magazine of Management10:2, 135–136, 152. Reprinted in Operations Research 38:6 (1990), pp. 947-950.
He, M., Leung, H. F., & Jennings, N. R. (2003). A fuzzy-logic based bidding strategy for autonomous agents in continuous double auctions. IEEE Transactions on Knowledge and data Engineering, 15(6), 1345-1363.
Henning, G. P. (2009). Production scheduling in the process industries: current trends, emerging challenges and opportunities. Computer Aided Chemical Engineering, 27, 23-28.
Hoffman, J. M., Shah, N. D., Vermeulen, L. C., Schumock, G. T., Grim, P., Hunkler, R. J., & Hontz, K.
M. (2006). Projecting future drug expenditures-2006. American Journal of Health-system
Pharmacy, 63(2), 123-138.
Hülsmann, M., Grapp, J., & Li, Y. (2008). Strategic adaptivity in global supply chains—competitive advantage by autonomous cooperation. International Journal of Production Economics, 114(1), 14-26.
Iannone, R., Miranda, S., & Riemma, S. (2007). Supply chain distributed simulation: An efficient architecture for multi-model synchronization. Simulation Modelling Practice and Theory, 15(3), 221-236.
Iannone, R., Miranda, S., Riemma, S., Sarno, D. (2010), A model for vendor selection and dynamic evaluation, IFIP WG 5.7 International Conference on Advances in Production Management Systems: New Challenges, New Approaches, APMS 2009, Bordeaux. IFIP Advances in Information and Communication Technology, (338) AICT, 283-290.
Iannone, R., Martino, G., Miranda, S., & Riemma, S. (2015). Modeling fashion retail supply chain through causal loop diagram. IFAC-PapersOnLine, 48(3), 1290-1295.
Jiang, G., Hu, B., & Wang, Y. (2010). Agent-based simulation of competitive and collaborative mechanisms for mobile service chains. Information Sciences,180(2), 225-240.
Julien, B. (1994). An extension to possibilistic linear-programming. Fuzzy Sets and Systems, 64, 194-206.
Jung, H., Chen, F. F., & Jeong, B. (2008). Decentralized supply chain planning framework for third party logistics partnership. Computers & Industrial Engineering, 55(2), 348-364.
Kanda, A., & Deshmukh, S. G. (2008). Supply chain coordination: perspectives, empirical studies and research directions. International Journal of Production Economics, 115(2), 316-335.
Kulp, S. C., Lee, H. L., & Ofek, E. (2004). Manufacturer benefits from information integration with retail customers. Management Science, 50(4), 431-444.
Kwon, O., Im, G. P., & Lee, K. C. (2011). An agent-based web service approach for supply chain collaboration. Scientia Iranica, 18(6), 1545-1552.
Lanzillotto, A., Martino, G., Gnoni, M. G., Iannone, R. (2015). Impact analysis of a cross-channel retailing system in the Fashion industry by a simulation approach. 14th International Conference on Modeling and Applied Simulation, MAS 2015, Bergeggi; Italy; 21 September 2015 through 23 September 2015, 79-88.
Law, A. M., Kelton, W. D., & Kelton, W. D. (1991). Simulation modeling and analysis (Vol. 2). New York: McGraw-Hill.
Lee, Y. H., Cho, M. K., Kim, S. J., & Kim, Y. B. (2002). Supply chain simulation with discrete– continuous combined modeling. Computers & Industrial Engineering, 43(1), 375-392.
Lee, Y., & Kozar, K. A. (2006). Investigating the effect of website quality on e-business success: An analytic hierarchy process (AHP) approach. Decision support systems, 42(3), 1383-1401.
Lee, C. F., & Chung, C. P. (2012). An inventory model for deteriorating items in a supply chain with system dynamics analysis. Procedia-Social and Behavioral Sciences, 40, 41-51.
Lehtonen, J. M. (1998). Analysis of the Order Penetration Point Alternatives in the Nordic Paper Industry Supply Chains. In Strategic Management of the Manufacturing Value Chain (pp. 277-286). Springer US.
Leng, M., & Parlar, M. (2010). Game-theoretic analyses of decentralized assembly supply chains: Non-cooperative equilibria vs. coordination with cost-sharing contracts. European Journal of Operational Research, 204(1), 96-104.
Liang, T. (2006). Distribution planning decisions using interactive fuzzy multi-objective linear programming. Fuzzy Sets and Systems, 157, 1303–1316.
Liang, T. (2007). Applying fuzzy goal programming to production/transportation planning decisions in a supply chain. International Journal of Systems Science, 38, 293-304.
Liu, S. T., & Kao, C. (2004). Solving fuzzy transportation problems based on extension principle. European Journal of operational research, 153(3), 661-674.
Li, S., Rao, S. S., Ragu-Nathan, T. S., & Ragu-Nathan, B. (2005). Development and validation of a measurement instrument for studying supply chain management practices. Journal of Operations Management, 23(6), 618-641.
Lohtia, R., & Subramaniam, R. (2004). Efficient consumer response in Japan: Industry concerns, current status, benefits, and barriers to implementation.Journal of Business Research, 57(3), 306-311. Long, Q., & Zhang, W. (2014). An integrated framework for agent based inventory–production–
transportation modeling and distributed simulation of supply chains. Information Sciences, 277, 567-581.
Montgomery, D.C. (2012). Design and Analysis of Experiments. 8th edition ed. s.l.:Wiley & Sons Inc. Ma, J., Nozick, L. K., Tew, J. D., Truss, L. T., & Costy, T. (2004). Modelling the effect of custom and
stock orders on supply-chain performance. Production Planning & Control, 15(3), 282-291.
Malhotra, A., Gosain, S., & Sawy, O. A. E. (2005). Absorptive capacity configurations in supply chains: gearing for partner-enabled market knowledge creation. MIS Quarterly, 145-187.
Masuchun, W., Davis, S., & Patterson, J. W. (2004). Comparison of push and pull control strategies for supply network management in a make-to-stock environment. International Journal of Production Research, 42(20), 4401-4419.
McEvily, B., Perrone, V., & Zaheer, A. (2003). Trust as an organizing principle. Organization Science, 14(1), 91-103.
Miranda, S., Fera, M., Iannone, R., & Riemma, S. (2015). A multi-item constrained EOQ calculation algorithm with exit condition: a comparative analysis. IFAC-PapersOnLine, 48(3), 1314-1319. Moyaux, T., Chaib-draa, B., & D'Amours, S. (2007). Information sharing as a coordination mechanism
/ International Journal of Industrial Engineering Computations 8 (2017)
Naim, M. (2006). The impact of the net present value on the assessment of the dynamic performance of e-commerce enabled supply chains. International Journal of Production Economics, 104, 382–393. Ni, D., & Li, K. W. (2012). A game-theoretic analysis of social responsibility conduct in two-echelon
supply chains. International Journal of Production Economics, 138(2), 303-313.
Olhager, J., 2003. Strategic positioning of the order penetration point. International Journal of Production Economics, 85, 319–329.
Peidro, D., Mula, J., Poler, R., & Verdegay, J. L. (2009). Fuzzy optimization for supply chain planning under supply, demand and process uncertainties. Fuzzy Sets and Systems, 160(18), 2640-2657. Persson, F., & Araldi, M. (2009). The development of a dynamic supply chain analysis tool—Integration
of SCOR and discrete event simulation. International Journal of Production Economics, 121(2), 574-583.
Petrovic, D., Roy, R., & Petrovic, R. (1998). Modelling and simulation of a supply chain in an uncertain environment. European Journal of Operational Research, 109(2), 299-309.
Petrovic, D., Roy, R., & Petrovic, R. (1999). Supply chain modelling using fuzzy sets. International Journal of Production Economics, 59(1), 443-453.
Pettersson, A. I., & Segerstedt, A. (2013). Measuring supply chain cost. International Journal of Production Economics, 143(2), 357-363.
Tracht, K., Niestegge, A., & Schuh, P. (2013). Demand planning based on performance measurement systems in closed loop supply chains. Procedia CIRP, 12, 324-329.
Padmanabhan, V., & Png, I. P. (1997). Manufacturer's return policies and retail competition. Marketing Science, 16(1), 81-94.
Pagh, J. D., & Cooper, M. C. (1998). Supply chain postponement and speculation strategies: how to choose the right strategy. Journal of Business Logistics, 19(2), 13.
Papadakis, I. S. (2006). Financial performance of supply chains after disruptions: an event study. Supply Chain Management: An International Journal, 11(1), 25-33.
Pereira, J. (2009). The new supply chain’s frontier: Information management. International Journal of Information Management, Volume 29, p. 372–379.
Persona, A., Grassi, A., & Catena, M. (2005). Consignment stock of inventories in the presence of obsolescence. International Journal of Production Research, 43(23), 4969-4988.
Petrovic, D., 2001. Simulation of supply chain behaviour and performance in an uncertain environment.
International Journal of Production Economics, Volume 71, pp. 429 - 438.
Pettersen J.A. & Segerstedt A., 2009. Restrictedwork-in-process:A study of differences between Kanban and CONWIP. Int. J. Production Economics, Volume 118, pp. 199-207.
Power, D., & Singh, P. (2007). The e-integration dilemma: The linkages between Internet technology
application, trading partner relationships and structural change. Journal of Operations
Management, 25(6), 1292-1310.
Quinzi, A., 2004. A Sequential Stopping Rule For Determining The Number Of Replications Necessary
When Several Measures Of Effectiveness Are Of Interest. Proceedings of Tenth U.S. Army
Conference on Applied Statistics.
Rice, J. (1995). Mathematical Statistics and Data Analysis (Second ed.). s.l.: Duxbury Press, ISBN 0-534-20934-3.
Sakawa, M., Nishizaki, I., & Uemura, Y. (2001). Fuzzy programming and profit and cost allocation for a production and transportation problem. European Journal of Operational Research, 131(1), 1-15. Sambasivan, M., Siew-Phaik, L., Mohamed, Z. A., & Leong, Y. C. (2013). Factors influencing strategic
alliance outcomes in a manufacturing supply chain: role of alliance motives, interdependence, asset specificity and relational capital. International Journal of Production Economics, 141(1), 339-351. Shukla, N., Choudhary, A. K., Prakash, P. K. S., Fernandes, K. J., & Tiwari, M. K. (2013). Algorithm
portfolios for logistics optimization considering stochastic demands and mobility allowance. International Journal ofProduction Economics, 141(1), 146-166.

![Fig. 7. Control architecture for SCs management: CENTRALISED CONTROL [ OBJ MAX ∑ NPV t )] & DECENTRALISED CONTROL [ OBJ MAX NPV t )]] - where t is the time of strategy investment; I is the generic echelon with i=1,…,4](https://thumb-eu.123doks.com/thumbv2/123dok_br/18165959.329364/11.918.95.775.210.762/architecture-management-centralised-control-decentralised-control-strategy-investment.webp)