New Construction for Commercial Building
(Restaurant) By Considering The Green
Building Strategies
1MF Baharom, 1K.Ahmad, 1M.N.M Nasir, 1W.M Bukhari, 1H.I Jaafar
UniversitiTeknikal Malaysia Melaka,
Faculty of Electrical Engineering, Durian Tunggal,Melaka email: mohamad.faizal@utem.edu.my
Abstract— The Green Building Index (GBI) is one of green building strategies that are needed in order to decrease the human technologies and waste made by them. Moreover, GBI is the latest green building strategies that been implemented in the new building construction in Malaysia. It is proven as the building sector consumes 40% of the total energy consumption in the world, thus increasing the environmental problems. Mechanical, cooling, lighting and ventilating spaces consume by far the most energy in buildings. Besides the energy consumption, the cost needed to develop the new building also been increased. This project sought to provide an understanding on the new construction of commercial building (restaurant) which is selected with the objectives which to design all the electrical installation including the lighting system, air-conditioner, switch socket outlet (SSO), protection system, and cable selection in the commercial building (restaurant) based on the Malaysia’s GBI, to analyze the lighting system by using DIALux software and all the connected electrical loads after implementing the GBI standards, and lastly to analyze the energy consumption as well as the cost in the new construction for commercial building (restaurant). The electrical installation and building design are done by using AutoCAD software whereas the lighting system is analyzed by using DIALux software. The load calculation, energy and cost consumption are been analyzed based on the GBI and electrical standards. Based on the results obtained, the overall energy and cost consumptions in the commercial building had been improved after implementing the green building strategies. The overall electrical installation in the building will be based on energy efficiency criteria of the GBI assessment criteria on the non-residential (commercial) building which having the highest point. An electrical installation design, AutoCAD design, load calculation, energy and cost consumption are made by implementing the green building strategies as to achieve the gold rating in GBI classifications.
Keywords- Green Building Strategies, New Construction Commercial Building (Restaurant)
I. GREEN BUILDING INDEX (GBI)
Due to increasing industrial facilities and developments in technology, energy use has been increasing all over the world. This causes environmental problems such as global warming and climate change. Therefore, governments around the world are implementing various policies to reduce the energy use, especially in buildings. Energy consumption in buildings accounts for 40% of total energy consumption in the world. About 15% of energy consumption in buildings is consumed by lighting systems [1]. On May 21, 2009, new chapter of Malaysia environmental responsive building begins with the launching of Malaysia’s GBI. The GBI rating system rates the new constructing building on environmental impact based on six criteria which are Energy Efficient, Indoor Environment Quality, Sustainable Site and Management, Material and Resources, Water Efficiency, and Innovation. Chief Minister YAB Lim Guan Eng said, ‘Penang may impose the GBI accreditation as a criterion for several upcoming development projects [2], this was a good start for Malaysian to apply GBI in their living environment.
TABLE I. GBI Classification and Ratings [3]
GBI Classification
POINTS GBI RATING
86+ points Platinum
76 to 85 points Gold
66 to 75 points Silver
Malaysia’s Green Building Index (GBI) used to help people who involves with construction field will find out the weakness of Malaysia construction building and find the solution by implementing the GBI. Moreover, the increase in the environment education knowledge of Malaysian would promote the effective ways to benefits the green buildings and green awareness. [2] The Green Building practice expands and complements the classical building design concerns of economy, utility, durability, and comfort.
TABLE II. Comparison between “Green Building” and “Non-Green Buildings” [4]
Building Type Green Buildings Non-Green buildings
Energy consumption Low High
Indoor Environment Quality Very good Good
Emission Low High
Waste Management Highly Efficient Efficient
Building Material Environmentally Friendly Not Environmentally Friendly
Project Practices Sophisticated Normal
Feasibility >5% than Threshold Threshold
II. PROJECT BACKGROUND
As for this project, energy efficient (EE) criteria of GBI standards are taken seriously. It concludes in the electrical installation design in the new construction of commercial building (restaurant) such as in the lighting design. This project covers in constructing a fast food restaurant. It typically includes the following spaces; dining room, corridor, kitchen, chiller and freezer room, dining outdoor, customer switch room, EP room, male toilet, female toilet, female prayer room, male prayer room, hose reel pump room and parking lots. Fig. 1 shows the overall view of new non-residential restaurant.
III. GREEN BUILDING STRATERGIES
A. Electrical Designs
Fig. 2. AutoCAD Electrical Design
Fig. 2 shows the overall electrical design for the restaurant. The design need to be well structured and organized. By using the normal design in the restaurant, the evaluation of energy which will be used inside the restaurant is conducted. This study will focus on the all the electrical installation including the lighting system, air-conditioner, and switch socket outlet (SSO) to evaluate the energy saving performance. Electrical installation for every single room includes lighting design, air-condition, switch socket outlets (S.S.O), fans, and other electrical equipment. In implementing the green building strategies, lighting strategies have to be the main start as it plays the biggest role in constructing green building.
B. Lighting Strategies
The lighting design stage will begin with the proper planning from the building electrical plan. The building space and room concept will determine the lighting application that can be applied. Before the lamps are chosen, there are several things that must be considered as it is suitable to implement it in the projects. In the midst of things to be considered are luxes, cou, lumen, room index, and mounting height. Every type of lamps, have different ballast that must be consider. [5]
TABLE III. Lamps Efficiency and Service Life
Type of Lamp Lumens per watt Average lamp life in Hours
Incandescent 8-25 1000-2000
Fluorescent 60-600 10000-24000
High Pressure Sodium (HPS) 45-110 12000-24000
Low Pressure Sodium (LPS) 80-180 10000-18000
Metal halide 60-100 10000-15000
LED 28-79 25000-100000
Basic design behind the lighting design is the lumen method. General lighting requirements must be determined for that surface such as number of foot-candles (lumen per square foot), room area, light loss due to room proportions, colour of walls, the coefficient of utilization and maintenance factor. The formulas used are shown below:
= × × × (2)
. = × × × (3)
= [ ] (4)
The parameter to measure the Light Lost Factor (LLF) also considered. Here, Ballast Factor (BF) set to 95%, Room Surface Dirt Depreciation (RSDD) set to 97%, Lamp Lumen Depreciation (LLD) set to 85% and Luminaire Dirt Depreciation (LDD) set to 90%. These parameters stated above will be used to evaluate the lighting performance in order to achieve energy saving criteria.
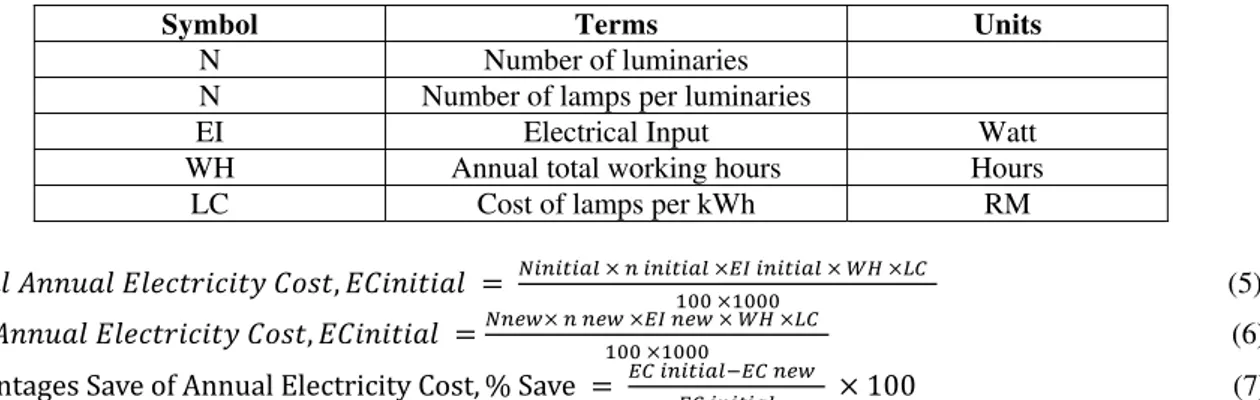
TABLE IV. Details of Lamps Cost Consumption
Symbol Terms Units
N Number of luminaries
N Number of lamps per luminaries
EI Electrical Input Watt
WH Annual total working hours Hours
LC Cost of lamps per kWh RM
, = × × × × × (5)
, = × × × × × (6)
Percentages Save of Annual Electricity Cost, % Save = × (7) Besides that, the cost consumption is also important in designing the new construction commercial building (restaurant). The table and formulas above shows the cost calculation of the lighting installation. The next stage is to analyze the lighting that been chosen. This can be done by managing the lighting simulations.
C. Lighting Simulations
The software selected for designing the lighting system is DIALux software. [4]As the type of lamp that being used is LED lightings, all of this type of lamps that used in this area is taken from DIALux software lighting database. The first step to calculate the number of lighting used in each room is by measuring the area of the room. After that, decide the mounting height in every room. So that the measurement can be measure properly and the total amount of light will be define.
TABLE V. General Lighting Requirements
ID Ground Area
(m2) Room Cavity Ratio (RCR) Room Index Light Loss Factor No. of Luminaries
Dining Room (Indoor) 171.74 13.715 0.36 0.8 33
Corridor 19.91 8
Kitchen 122.76 7
1
1
26
Chiller and Freezer Room 16.12 4
Dining Room (Outdoor) 141.94 33
Consumer Switch Room 14.74 3
EP Room 2.24 1
Male Toilet 8.89 4
Female Toilet 8.95 4
Female Prayer Room 6.69 3
Male Prayer Room 6.05 3
Hose Reel Pump Room 6.24 2
Outdoor Lighting (Façade) 738.53 32
Table V shows the lighting requirements to analyse the lighting performance in the restaurant. The room cavity ratio for the restaurant is 13.71 while the room index and light loss factor for the restaurant analysis are 0.36 and 0.8. These parameters stated above will be used to evaluate the lighting performance in order to achieve energy saving criteria. The number of lighting for bigger ground area will have higher amount compare to the small area. This is important to ensure good lighting condition the specific area.
The software selected for designing the lighting system is DIALux software. As the type of lamp that being used is LED lightings, all of this type of lamps that used in this area is taken from DIALux software lighting database. The first step to calculate the number of lighting used in each room is by measuring the area of the room. After that, decide the mounting height in every room. So that the measurement can be measure properly and the total amount of light will be define.
Fig.3. Light Distribution Base on False Colour Rendering
Fig.3 shows the light distribution based on the false colour rendering. The white colour presents the brightest zone with 18.85 lux whereas the black colour presents the darkest zone with zero lux. The colour rendering for each zones in the restaurant is shown in Table 4.2. Every zone consist its own colour rendering based on the amount of lighting used in the area. The amount of lighting is shown in Table VI.
TABLE VI. Color Rendering and Light Distribution Analysis
COLOUR RENDERING LIGHT DITRIBUTION
Dining Room
(Ind
oor)
Corridor
Chiller and F
reezer Room
Cus
tomer
Switch
Room
Dining Ou
td
oor
EP Ro
Ma
le T
o
ilet
Fema
le T
o
ilet
Fema
le Pray
er Ro
om
Based on [8] standard point 6.3, the light power density allowed for restaurant must not exceed 15 W/m2. Table VI show that the lighting strategies for the restaurant have been divided into 14 zones and all the zones are well-lighted. The kitchen consumed the highest lighting load for indoor area which is1138 watt with 9.27 W/m2 light power density followed by indoor dining room that consumed 825 watt with 4.80 W/m2 light power density. The outdoor dining room consumed the same lighting load but it differs in the light power density of 5.81 W/m2 due to the different ground area. As for the façade lighting, this area consumed 1920 watt lighting load and 2.59 W/m2 light power density. Lastly, the street lighting area consumed 1760 watt of power load with 0.69 W/m2 light power density. The remaining zones consumed low lighting load and the power densities for these zones are still in the range of 0-15 W/m2.
Hose
Reel P
u
mp Room
Outd
o
o
r Lig
h
ting
(F
aç
ade)
Fig.4. Power Distribution for Lighting Based on the Area
Based on the Fig.4, it shows that power consumption for indoor lightings is the highest compared the other three areas which are outdoor lightings, façade lightings, and street lightings. These may due to the number of rooms inside the indoor area. They are 10 zones in the indoor lighting whereas only two areas in the outdoor lighting, one area for façade lighting, and one area for street lighting.
Fig.5. Power Consumption for Indoor Lightings Based on Zones
The Fig. 5 shows that kitchen has the highest power consumption for indoor lightings which is 1138W. Kitchen is the most critical area in the restaurant due to the food preparation area. The staff needs to have good lighting while preparing foods and it is important to avoid danger in the kitchen. Based [5], indoor light requirements vary depending on the task to be carried out in working environments. It is normal to have higher lighting power consumption in the kitchen compared to the other areas because kitchen is the most critical working area compared with the others.
33%
22% 32%
13%
Power Distribution for Lightings Based on The Area
Indoor
Street
Façade
Outdoor
0 200 400 600 800 1,000 1,200
Power (Watt)
Area
Fig.6. Illumination Level for LED Lightings Based on Zones
LED-based lighting are low-voltage and low-current requirements, high switching speed, high reliability, robustness, absence of mercury, compact size, lower maintenance costs and high efficacy. Figure 4.7shows that the illumination levels of LED lamps in all the 14 zones of the restaurant are perfectly matched the standard of Jabatan Kerja Raya (JKR). The façade lighting consists the highest lux which is 398.25 lx followed by dining room outdoor which is 398.3 lx. The other zones have a good lux level in their area as the lux level is well-fitted. Based on JKR Standard, it stated that the luminance distribution in the field of view controls the adaptation level of the eyes, which affect task visibility. Therefore, the illumination level for each area must be in good condition. For example, the kitchen plays a major works and it need needs to have a good luminance in order a person perceives and carries out the visual task quickly, safely and comfortably.
Fig.7. Total Annual Cost between LED and Non-LED Lightings Based on Zones
The Fig.7 shows that the Light Emitting Diode (LED) lamps annual total cost are much lower than Non-LED lamps. Even though the cost for each LED lamp is higher which is in average of RM 20 to RM 100 for each lamp compared to the Non-LED lamp with average of RM 5 to RM 20 per lamp, the annual total cost of LED lamps will be lower due to the higher lamp life rating. Based on Table 3, the lamp life rating for LED is the highest which between 250000 hours to 50000 hours compared to the other type of lamp. Based on [17], the LED implementation will not reduce the capital cost due to installation, but it will give a better result in term of return of investment. In order to meet the GBI requirement, all the lighting is individual switch where the size of individual switched lighting zones is not exceed 100m2 for 90% of the area.
0 50 100 150 200 250 300 350 400 450
LED Illumination Level (lux) Based on Zones
LED Illumination Level (lux)
0 200 400 600 800 1000 1200
Cost (RM)
Area
Annual Cost between LED and Non-LED Lightings Based on Zones
LED
D. Exit Sign and Emergency Light
TABLE VII. Exit Sign and Emergency Light Load Details
2 x 13W EXIT SIGN C/W INTEGRAL GEAR
1 x 13W RECESSED SELF CONTAINED EMERGENCY LIGHT FITTING
Current (A) 13 13
QTY 14 13
Load (Watt) 0.04 0.04
Power Consumption (W) 0.56 0.52
Table VII shows the energy consumption of additional lightings which are Exit Sign and Emergency Light. These lighting do gave additional power consumption to the lighting system power consumption as it will be lights on for 24 hours. The use of LED type lamps have decrease the amount of energy used for these types of lighting. Besides lighting, HVAC also used high energy consumption in the building. Based on the power consumption analysis in [8], HVAC consumed 54% of the overall energy consumption in the building. Therefore, HVAC also need to have its green strategies.
E. Heating, Ventilation, and Air-Conditioner (HVAC) Strategies
The three central functions of heating, ventilation, and air-conditioning are interrelated, especially with the need to provide thermal comfort and acceptable indoor air quality within reasonable installation, operation, and maintenance costs. Basically, an air conditioner is a device that used to cool the area focused by lowering the temperature
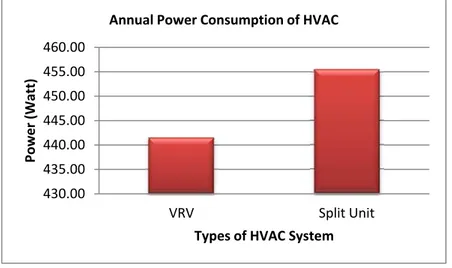
Fig.8. Total Annual Power Consumption between VRV and Split Unit Air-Conditioner
The Variable Refrigerated Volume (VRV) type air-conditioner is been selected to be used in the restaurant as it have a greater energy savings compared to the other type of air-conditioner. Fig.8 shows the total annual power consumption of the VRV air-conditioner and split unit air-conditioner. The total annual power consumption of the VRV air-conditioner is 441.50kWh which is lower compare to the split unit air-conditioner with 455.52 kWh. The total cost of the VRV conditioner is RM 64862 which is higher compare to the split unit conditioner with RM53430 but VRV conditioner has higher energy efficiency compared to the split unit air-conditioner. VRV air-conditioner includes both one unit of compressor with 22.4kW rated capacity with 12 indoor units while split unit air-conditioner includes one unit of compressor 2.0kW and one indoor unit. The rated capacity of VRV air-conditioner with 12 indoor units is much lower compared to the rated capacity of split unit air-conditioner with only one indoor unit. Besides that, to compare the space used, split unit air-conditioner needs higher amount of space compared to the VRV air-conditioner.
F. Switch Socket Outlets (S.S.O) Strategies
Socket is the part of main element in the electrical installation design. Generally the plug is the movable connector attached to an electrically operated device's mains cable, and the socket is fixed on equipment or a building structure. To reduce the risk of electric shock, plug and socket systems is added up with safety features. Sockets are designed to prevent exposure of bare live contacts. The exposed contacts present in some sockets are used exclusively for earthing or the other word grounding.
430.00 435.00 440.00 445.00 450.00 455.00 460.00
VRV Split Unit
Power (Watt)
Types of socket used in the restaurant are radial and ring. The selection of this socket was based on amount if socket on the circuit. Those sockets installed using the radial method, where consist of a few number of socket in the circuit. However, for socket that more than six, ring type is more applicable because it save cost and if any sock et breakdown, other sockets still can be used.
Fig.9. Power Consumption for Different Type of SSO
Kitchen is intense energy user, putting food service facilities among the biggest energy consumers per square foot of all commercial buildings. In a typical food service facility, food preparation, water heating, and refrigeration combined represent nearly 60 percent of total energy use, making those systems excellent targets for energy savings. Based on Fig.9, the power consumed by 30A TP Isolators are the highest which is 140 kW as they are been used in the kitchen. Most of the kitchen equipment used high power rating such as ovens, fryers, air-conditioner, and steam cookers. Besides that, the installation of SSO is based on the need of statement as they are only been used in a certain demands and period of time.
G. Load Demand and Main Substation Board Profile
Fig.10. Overall Power Consumption in the Restaurant
0 20000 40000 60000 80000 100000 120000 140000 160000
Power (Watt)
Types of SSO
Power consumption for Different Type of SSO
0.00 50.00 100.00 150.00 200.00 250.00 300.00 350.00
Lighting HVAC SSO Other Electrical
Equipment
Power (kW)
Types of Electrical Equipment
Power Consumption of Electrical Equipments in The Restaurant
TCL (kW)
Based on Fig.10, the SSO consumed the highest power consumption in the restaurant which is 292 kW compared to the lighting with 7.91 kW, HVAC (air-conditioner) with 67.20 kW, and other electrical equipments such as ceiling fan and exhaust fan with 20 kW. The power consumption of SSO may due to the amount of isolators used in the kitchen. The uses of isolators are need for giving electrical supply to the cooking and food preparation appliances such as fryers, refrigeration, freezer, grills, and ovens. Most of these appliances used high energy of consumption. As for comparison between the total connected load and the maximum demand, the HVAC which is conditioner do not have any difference in both of that. The diversity factor for air-conditioner is 1.0 where it shows that the air-air-conditioners are been used for 24 hours per day. The lighting system has great energy consumption where it is being the lowest energy consumer based on the green strategies that have been implemented in the lighting system. Besides that, the lamps only lights on during night only due to the daylight factor. The calculation for overall energy consumption is shown in Appendix C.
H. Cable sizing and Protective Device Selection
TABLE VIII. Cable Sizing and Protective Devices Selection
Distribution Board Type of Protective
Device Cable Type and Size
DB 1 (LIGHTING) 100A MCCB 4x1C, 50 mm2 PVC Cu, TRUNKING
DB 2 (HVAC) 100A MCCB 4x1C, 50 mm2 PVC Cu, TRUNKING
DB 3 (HVAC) 100A MCCB 4x1C, 50 mm2 PVC Cu, TRUNKING
DB 4 (HVAC) 100A MCCB 4x1C, 50 mm2 PVC Cu, TRUNKING
DB 5 (ISO) 200A MCCB 4x1C, 120 mm2 PVC/PVC Cu, TRUNKING
DB 6 (SSO) 100A MCCB 4x 50 mm2 PVC Cu, CONDUIT/TRUNKING
Table VIII shows the types of protective devices and cable used for each loads. The distribution board consist single types of loads but it differs to the air-conditioner as it needs three distribution boards. This is due to the number of indoor units in each VRV type air-conditioner which each compressor is connected to the maximum of 12 indoor units of air-conditioner. The overall results of protective device and cable sizing are shown in appendix F1, F2, F3, and F4. Most of the cable that are selected is Poly-Vinyl Chloride (PVC) copper type because copper is a good conductor and PVC material is used for the cable sheath because it has good insulation that can withstand 80°C and above. The cable is normally placed in trunking or conduit as it will help to minimize the space used and to make the cable in a proper management.
IV. CONCLUSION
REFERENCES
[1] B. Sun, P.B. Luh, Q.S. Jia, Z. Jiang, F. Wang, and C. Song, “Building Energy Management: Integrated Control of Active and Passive Heating, Cooling, Lighting, Shading, and Ventilation Systems," IEEE Trans., Automation Science and Engineering, vol. 10, pp.588– 602, July 2013.
[2] Grace Chen, “Green effort to save water”, The Star Online, published on April 10, 2009.
[3] Green Building Index, GBI Malaysia, 2009. Green Building Index, GBI Malaysia. [Online]Available at:http://www.gbimalaysia.com/index.html [Accessed 13 September 2012].
[4] Shamsiah, T.N., 2012. The Malaysian Times. [Online] Available at: http://www.themalaysiantimes.com.my/malaysia-singaporecan-further-promote-green-via-cooperation [Accessed 23 October 2012].
[5] Khurana, Inderjeet Singh and Michaelowa, “Indian Urban Building Sector: CDM Potential through Energy Efficiency in Electricity Consumption,” Aug. 2004, No. 289.
[6] David V. Chadderton, “Building Services Engineering”, 5th ed., London: Taylor & Francis, 2007, pp. 260-279.
[7] F. Maréchal DF, and E. Jochem. “Energy in the perspective of the sustainable development : the 2000 W society challenge,” conservation & recycling, 2005, Vol. (44) 3, pp. 245-262.
[8] Malaysia Standard 1525: 2007, “Code of Practice on Energy Efficiency and use of Renewable Energy for Non-Residential or Commercial Building”
[9] Malaysia Standard Specification for Lighting (2008). Jabatan Kerja Raya Malaysia. JKR/SPJ/2008.
[10] Brian Cook. “High efficiency lighting in industry and commercial buildings,” Power Engineering Journal, 1998, Vol. (12) 5, pp. 197 - 206
[11] Anonymous, “DIALux Version 4.4 User Manual,” DIAL Gmbh Publishing 2007, Lüdenscheid, 19-117.
[12] Nazmi EKREN, Bahtiyar DURSUN and Ercan AYKUT, “Lighting Computer Programs in Lighting Technology,” G.U. Journal of Science, Vol. 21(1), pp. 15-20, 2007
[13] K. Mukhopadhyay and D. Chakraborty, “Energy intensity in India during pre-reform and reform period – An Input-Output Analysis,” 15th International Input-Output Conference, China, July 2005.
[14] P. Boyce and P. Raynham, “The SLL Lighting Handbook”, London: The society of light and lighting, 2009, pp. 173- 184.
[15] Al-Tamimi Nedhal A. M., “Uplamping and its energy saving in industrial and office lighting,” master’s thesis, University School of Design, Mysore, India, 2005, unpublished.
[16] Azri Amirrudin , Boon Cheong Chew, “Implement The Energy Efficiency (Ee) System According to The Green Building Index (GBI): Case Study At Panasonic Industrial Devices Semiconductor Malaysia (PIDSCMY)”, Power and Energy Conversion Symposium (PECS 2012), Melaka, Malaysia, Nov 2012.
[17] MF Baharom, AM Kassim, R Omar, MK Nor, ZH Bohari, MF Sulaima, WM Bukhari, KB Mohamad, NS Jalil, “Performance Study on Energy Efficiency by Considering Energy Saving Strategies for Restaurant Type Focusing at Indoor Lighting”, Australian Journal of Basic & Applied Sciences, Vol. 8 (2), February 2014.
[18] Ernawati Mustafa Kamal, Syarmila Hany Haron, Norhidayah Md Ulang, Faizal Baharum, “The Critical Review on The Malaysian Construction Industry”, Journal of Economics and Sustainable Development, Vol. 3(13), pp. 81-87, 2012.
[19] Yan Ji and Stellios Plainiotis (2006): Design for Sustainability. Beijing: China Architecture and Building Press. ISBN 7-112-08390-7 [20] Rock and Zhu, “Designer's Guide to Ceiling-Based Air Diffusion”, ASHRAE, Inc. New York, 2002
![TABLE II. Comparison between “Green Building” and “Non-Green Buildings” [4]](https://thumb-eu.123doks.com/thumbv2/123dok_br/18162353.328940/2.892.95.800.224.429/table-ii-comparison-green-building-non-green-buildings.webp)