Ann. Geophys., 25, 2099–2102, 2007 www.ann-geophys.net/25/2099/2007/ © European Geosciences Union 2007
Annales
Geophysicae
AnGeo
Communica
tes
Identification of active fossil bubbles based on coordinated VHF
radar and airglow measurements
R. Sekar1, D. Chakrabarty1, S. Sarkhel1, A. K. Patra2, C. V. Devasia3, and M. C. Kelley4 1Physical Research Laboratory, Ahmedabad, India
2National Atmospheric Research Laboratory, Gadanki, India
3Space Physics Laboratory, Vikram Sarabhai Space Center, Thiruvananthapuram, India 4School of Electrical and Computer Engineering, Cornell University, Ithaca, NY, USA Received: 13 July 2007 – Accepted: 5 October 2007 – Published: 6 November 2007
Abstract. Plasma irregularity structures associated with an Equatorial Spread-F (ESF) event were recorded by the In-dian VHF Radar on 26–27 April 2006 near midnight hours. The plasma structures were found to be isolated without hav-ing bottomside structure. They moved predominantly down-ward and the structures were found to be less turbulent than their post-sunset counterparts. However, the structures were characterized by meter-scale size irregularities. These struc-tures are identified for the first time as plasma depletion structures using simultaneous, collocated measurements of OI 630.0 nm airglow intensity variations. The variation of the base height of ionospheric F layer over dip equator is also presented to buttress the result. Further, these plasma structures are shown to be “active fossil bubbles”.
Keywords. Ionosphere (Equatorial ionosphere; Ionospheric irregularities; Plasma waves and instabilities)
1 Introduction
The depleted plasma region commonly known as plasma bubbles associated with equatorial spread F events have been observed (Kelley, 1985) by several techniques and simulated theoretically (Ossakow, 1981; Sekar et al., 1994) by nonlin-ear numerical models. Seed perturbations in the ambient electron density with appropriate background ionospheric conditions evolve nonlinearly under the action of general-ized Rayleigh-Taylor instability mechanism to form plasma bubbles. The background ionospheric conditions such as the F-region peak height and steep plasma density gradients are, in general, suitable during post sunset time for the genera-tion of such plasma bubbles. These plasma bubbles evolve nonlinearly and penetrate F-region peak altitude and thereby, account for the generation of irregularities in topside of the
Correspondence to:R. Sekar ([email protected])
ionosphere. During that time period, meter-scale (m-scale) irregularities are found throughout the plasma depletion.
The background ionospheric conditions near midnight are not conducive, in general, except during some magnetically active times (Chakrabarty et al., 2006) for further devel-opment of plasma bubbles. In addition to that, westward electric field during nighttime decelerates the growth of the plasma bubbles. Sometimes, the remnants of such plasma bubbles drift zonally into the field of view of measuring in-struments causing spread F like signatures. These kind of non-evolving remnant plasma bubbles are generally termed as “fossil bubbles”. On most of the occasions, the m-scale structures detectable by VHF radars disappear during this non-evolving phase leaving larger scale structures in place (Basu et al., 1978). However, the reported fossil structures in this communication have m-scale irregularities.
These fossil bubbles normally drift towards east with am-bient plasma motion. Though, the electron density is de-pleted inside such bubbles, they tend to move downward similar to the ambient plasma. In general, they detach from where they are originated and may appear as detached patches after post-midnight. Several indications of the pres-ence fossil bubbles were obtained using earlier studies. In addition to Basu et al. (1978), Argo and Kelley (1986) us-ing digital ionosonde with capability to identify echo loca-tion, tentatively identified a “fossil plume” which was ob-served as isolated scattering patches moving with ambient plasma. The implications of the “fossil bubble” in the devel-opment of post-midnight onset of ESF during June solstice of the solar minimum period where the ionosphere back-ground condition was not conducive for plasma instability mechanism, were discussed in detail by Sastri (1999). Re-cently, Fukao et al. (2005) discussed the implication of mov-ing structures from west of EAR VHF radar site usmov-ing beam steering technique. None of these techniques were capable of identifying whether the structures were depleted plasma re-gion or enhanced rere-gion which normally moves downward.
2100 R. Sekar et al.: Observation of active fossil bubble
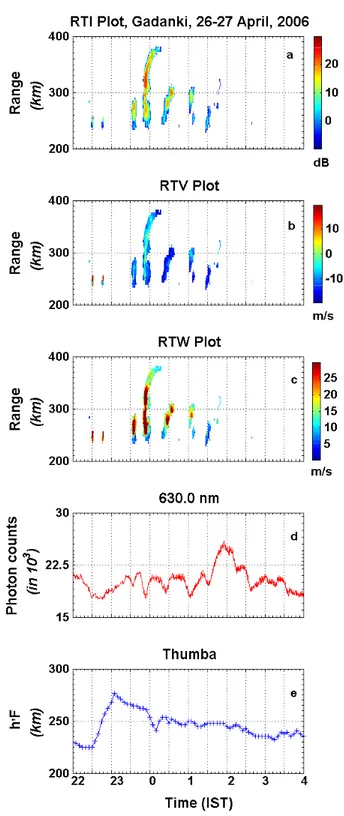
Fig. 1.Equatorial Spread F (ESF) structures on 26–27 April 2006 as
revealed by(a)Range-Time-Intensity (RTI) plot,(b)
Range-Time-Velocity (RTV) plot,(c)Range-Time-Width (RTW) along with
cor-responding temporal variations in OI 630.0 nm airglow (maximum
measurement error∼±160 photon counts) measurements and the
base of the F layer (uncertainty ∼±5 km) over dip equator are
shown in(d)and(e).
It is essentially due to the fact that the return echo strength of a VHF radar is proportional to square of electron density fluctuations while it is well known that the bubbles cannot be detected by ground based ionosondes. In this commu-nication, an example is provided for “fossil bubbles” which have m-scale irregularities. A possible physical scenario is also invoked wherein the “fossil bubbles” can still be ”ac-tive” enough to allow generation of m-scale irregularities.
2 Details of observations
Coordinated observations from Gadanki (13.5◦N, 79.2◦E, dip lat 6.3◦N) were carried out on a campaign mode dur-ing April 2006 usdur-ing VHF radar in ionospheric mode and OI 630.0 nm airglow observations with a narrow band pho-tometer. The VHF radar operates at 53 MHz and can attain a maximum power aperture product of 3×10¹⁰W m2. The radar was operated in ionospheric mode wherein the beam was oriented (14.8◦N from zenith) orthogonal to the geo-magnetic field lines. The details of the radar are available in the literature (Rao et al., 1995). The nighttime airglow emis-sions (OI 630.0 nm and 777.4 nm) from thermosphere alti-tudes (∼250 km and F region peak altitude) have been mon-itored using a temperature controlled narrow band (0.3 nm) optical photometer whose field of view (3◦) was chosen to nearly coincide with radar beam width. The details of this photometer (Sekar et al., 2004) and coordinated observations (Chakrabarty et al., 2005, 2006) are available in the litera-ture. In addition to these techniques, the layer height move-ments of the F-region over the dip equator which correspond to zonal electric fields were obtained from the ionosonde ob-servations located at Thumba. Due to technical reasons, the channel corresponding to 777.4 nm airglow emission was not operational on this night.
3 Results
Figure 1 depicts the combined results obtained on 26–27 April 2006 by the three independent techniques described in the previous section. The horizontal axis corresponds to time in IST (Indian standard time = Universal time, UT+5.5 h) which is common to all subplots. The time-intensity (RTI), time-velocity (RTV) and range-time-width (RTW) maps obtained from VHF radar echoes are given in panels (a), (b) and (c). The colour codes in them correspond to strength of return echoes in Fig. 1a, line of sight Doppler velocities in Fig. 1b and spectral width in the unit of velocity in Fig. 1c. A number of isolated plumes with-out having bottom side structures are observed on this night. The vertical columnar intensity variations of 630.0 nm air-glow emission corresponding to the same time interval are depicted in Fig. 1d. Corresponding to isolated plumes struc-tures in Fig. 1a, reductions or depletions in the 630.0 nm
R. Sekar et al.: Observation of active fossil bubble 2101 airglow intensities are noted. Depletions in airglow
intensi-ties are observed at∼23:30,∼24:00, ∼00:30, ∼01:00 and
∼01:30 h. In addition to these, some other variations in 630.0 nm airglow emission are also observed before 23:30 h and after 02:00 h in Fig. 1c which are not directly associ-ated with ESF structures and will not be discussed further. The layer height variations over the dip equator (Thumba) which correspond to zonal electric field during nighttime are depicted in Fig. 1e. The importance of these isolated struc-tures obtained∼23:30,∼21:00,∼01:00 and∼01:30 h will be discussed in the following section.
4 Discussion
Though the strength of the backscattered echoes correspond-ing to the ESF structures till 00:30 h on 27 April 2006 were relatively intense (see Fig. 1a), they remained stationary or moved downward (see Fig. 1b). The ESF structures began to weaken after 00:30 h although the movements continued to be downward. The downward movement of these struc-tures are evidenced both by Doppler velocities and from the location of the lower boundary of the structure compared to other structures. The variation of the base height of F region in the lowest panel also verifies the slow downward motion. The spectral widths corresponding to all the five structures are625 m/s. As these spectral widths are small compared to the corresponding width (>50 m/s) for well developed ESF structure. Thus these structures were less turbulent. This supports that these structures are not in evolutionary stages.
The airglow intensity recorded depletions corresponding to all these five structures. This airglow intensity is directly proportional to electron density. Further, as these structures are isolated patches, depleted airglow intensities can be taken to be due to the presence of plasma depletion structures with respect to background. It is to be noted here that the vari-ations in 630.0 nm airglow intensity not only depend on the electron density variations but also depend inversely on the layer height variation. In order to ensure the airglow intensity variations recorded corresponding to these ESF structures are essentially due to plasma depletions, the F-region layer height variations (Fig. 1e) are examined. The F-region height remained nearly stationary or was moving downward during these intervals. Downward motion of the F layer generally increases the 630.0 nm airglow intensity. Therefore, based on the airglow intensity variations, radar plots corresponding to these ESF structures and ionosonde observations, it can be inferred that these structures are “fossil bubbles” which were not moving upward as that of the conventional plasma bubble in developing phase.
It is important, nevertheless, to understand how such fos-sil bubbles can maintain 3 m-scale irregularities and remain “active”. A close scrutiny of Fig. 1 reveals that the irregu-larities are located mostly on the rising edge of the airglow depletions. As pointed out by Woodman and La Hoz (1976),
a narrow field of view detector acts like a slit camera and for a frozen-in structure moving east, the viewpoint is that of looking south along the earth’s magnetic field lines. Thus, the active region is on the western edge of the fossil bub-ble. Such a region has a density gradient pointing westward. This gradient is unstable to the wind driven Instability (Kel-ley, 1989) if the eastward wind exceeds the plasma drift, as it must for an F region dynamo. During the pre-midnight hours similar to the present case, the wind and plasma drifts ap-proach each other and the growth rate decreases reducing the backscattered intensity corresponding to these irregularities. The spectral widths corresponding to the pre-midnight hours are expected to be less since the r.m.s. velocity is propor-tional to (U−V), whereUis the eastward wind andV is the eastward plasma drift whereas during post sunset hours, it is proportional tog/νin, whereνin is the ion-neutral collision
frequency andg is acceleration due to gravity. For higher altitudes, this velocity is much larger than (U−V). Thus the neutral wind driven instability is suggested to destabilize the fossil bubbles and make them active.
5 Summary
An example of identifying “fossil bubbles” associated with ESF using coordinated measurements of VHF radar and air-glow is obtained. Downward moving plume structures and corresponding depletions in OI 630.0 nm airglow intensity reveal that these structures are “fossil bubbles”. The layer height variations support the conclusion that the recorded airglow intensity variations are only to plasma density de-pletions. Analysis of the location of the 3 m irregularity structures suggest strongly that these are due to neutral wind driven instability.
Acknowledgements. The authors thank the Director and the staff members of the National Atmospheric Research Laboratory for their cooperation in making the observational campaign successful. This work is supported by the Department of Space, Government of India.
Topical Editor M. Pinnock thanks one anonymous referee for her/his help in evaluating this paper.
References
Argo, P. E. and Kelley, M. C.: Digital Ionosonde Observations Dur-ing Equatorial Spread F, J. Geophys. Res., 91, 5539–5555, 1986. Basu, S., Basu, Su., Aarons, J., McClure, J. P., and Cousins, M. D.: On the coexistence of kilometer- and meter-scale irregularities in the nighttime equatorial F region. J. Geophys. Res., 83, 4219– 4226, 1978.
Chakrabarty, D., Sekar, R., Narayanan, R., Devasia, C. V., and Pathan, B. M.: Evidence for the interplanetary electric field ef-fect on the OI 630.0 nm airglow over low latitude, J. Geophys. Res., 110, A11301, doi:10.1029/2005JA011221, 2005.
2102 R. Sekar et al.: Observation of active fossil bubble
Chakrabarty, D., Sekar, R., Narayanan, R., Patra, A. K., and Deva-sia, C. V.: Effect of interplanetary electric field on the devel-opment of an spread F event, J. Geophys. Res., 111, A12316, doi:10.1029/2006JA011884, 2006.
Fukao, S., Yokoyama, T., Yamamoto, M., Maruyama, T., and Saito, S.: Onset of F-region plasma plumes observed with Equatorial Atmosphere Radar in Indonesia, Proceedings of XXVIII URSI General Assembly, New Delhi, 2005.
Hanumath Sastri, J.: Post-midnight onset of spread F at Kodaikanal during the June solstice of solar minimum, Ann. Geophys., 17, 1111–1115, 1999,
http://www.ann-geophys.net/17/1111/1999/.
Kelley, M. C.: Equatorial spread F: recent results and outstanding problem, J. Atmos. Sol. Terr. Phys., 47, 745–752, 1985. Kelley, M. C.: The Earths ionosphere: Plasma physics and
electro-dynamics, International Geophysics Series, vol. 43, Academic Press, 1989.
Ossakow, S. L.: Spread F theories: A review, J. Atmos. Terr. Phys., 43, 437–452, 1981.
Rao, P. B., Jain, A. R., Kishore, P., Balmuralidhar, P., Damle, S. H., and Vishwanathan, G.: Indian MST radar, System description and sample vector wind measurements in ST mode, Radio Sci., 30, 1125–1138, 1995.
Sekar, R., Suhasini, R., and Raghavarao, R.: Effects of vertical winds and electric fields in the nonlinear evolution of equatorial spread F, J. Geophys. Res., 99, 2205–2213, 1994.
Sekar, R., Chakrabarty, D., Narayanan, R., Sripathi, S., Patra, A. K., and Subbarao, K. S. V.: Characterization of VHF radar observa-tions associated with equatorial Spread F by narrow-band optical measurements, Ann. Geophys., 22, 3129–3136, 2004,
http://www.ann-geophys.net/22/3129/2004/.
Woodman, R. F. and La Hoz, C.: Radar observations of F region equatorial irregularities, J. Geophys. Res., 81, 5447–5466, 1976.