SRef-ID: 1432-0576/ag/2004-22-3129 © European Geosciences Union 2004
Annales
Geophysicae
Characterization of VHF radar observations associated with
equatorial Spread F by narrow-band optical measurements
R. Sekar1, D. Chakrabarty1, R. Narayanan1, S. Sripathi2, A. K. Patra2, and K. S. V. Subbarao3
1Physical Research Laboratory, Ahmedabad, India 2National MST Radar Facility, Gadanki, Tirupati, India
3Space Physics Laboratory, Vikram Sarabhai Space Center, Thiruvananthapuram, India
Received: 21 October 2003 – Revised: 28 May 2004 – Accepted: 8 June 2004 – Published: 23 September 2004 Part of Special Issue “Equatorial and low latitude aeronomy”
Abstract. The VHF radars have been extensively used to investigate the structures and dynamics of equatorial Spread F (ESF) irregularities. However, unambiguous identification of the nature of the structures in terms of plasma depletion or enhancement requires another technique, as the return echo measured by VHF radar is proportional to the square of the electron density fluctuations. In order to address this issue, co-ordinated radar backscatter and thermospheric airglow in-tensity measurements were carried out during March 2003 from the MST radar site at Gadanki. Temporal variations of 630.0-nm and 777.4-nm emission intensities reveal small-scale (“micro”) and large-small-scale (“macro”) variations during the period of observation. The micro variations are absent on non-ESF nights while the macro variations are present on both ESF and non-ESF nights. In addition to the well-known anti-correlation between the base height of the F-region and the nocturnal variation of thermospheric airglow intensities, the variation of the base height of the F-layer, on occasion, is found to manifest as a bottomside wave-like structure, as seen by VHF radar on an ESF night. The micro variations in the airglow intensities are associated with large-scale irregu-lar plasma structures and found to be in correspondence with the “plume” structures obtained by VHF radar. In addition to the commonly observed depletions with upward movement, the observation unequivocally reveals the presence of plasma enhancements which move downwards. The observation of enhancement in 777.4-nm airglow intensity, which is char-acterized as plasma enhancement, provides an experimental verification of the earlier prediction based on numerical mod-eling studies.
Key words. Airglow and aurora; equatorial ionosphere; ion-spheric irregularities
Correspondence to:R. Sekar ([email protected])
1 Introduction
associated with the large-scale equatorial Spread F struc-tures. The Doppler velocities inside some of the structures are predominantly upward which are generally associated with a plasma bubble. However, downward velocities in-side the structures are also not uncommon (Patra et al., 1997; Rao et al., 1997; Laakso et al., 1994). The structures ob-served by VHF radar moving with downward drift could be associated with plasma enhancements under certain condi-tions. On the other hand, the “fossil” bubble (plasma deple-tion in non-evoludeple-tionary phase), under the acdeple-tion of westward ambient electric field, can also move downward. Thus, the presence of downward movement in the RTV (Range-Time-Velocity) map need not unequivocally indicate the presence of enhancement structures. As the radar technique alone is inadequate to identify the nature of the structures, simulta-neous airglow measurements have also been carried out to characterize the VHF radar observations.
Airglow photometry in multiple wavelengths can serve as a potentially complementary technique to address the above issue. The structures in ESF, particularly those with large-scale sizes, have been studied using scanning optical pho-tometers (Takahashi et al., 1989; Sipler et al., 1981) and all-sky imagers (Weber et al., 1978; Sahai et al., 1994; Mendillo et al., 1997; Sinha et al., 1996). Depletions and enhance-ments in airglow intensities during ESF events (Mendillo et al., 1985; Sinha et al., 1996) have been recorded by im-agers. Thermospheric airglow emissions like 630.0-nm from ∼250–300 km altitude region and 777.4-nm from the F-region peak altitude have generally been used as tracers to record the modulations in the F-region ionization. It is known that the 630.0-nm emission line intensity during nighttime is proportional to the electron density, as the emission process is an outcome of dissociative recombination ofO2+with the ambient electron. Similarly, the 777.4-nm emission inten-sity due to the radiative recombination process ofO+
is pro-portional to the square of the electron densities. However, the temporal variation in 777.4-nm emission intensity is di-rectly proportional to the product of electron density and its variation. In view of these aspects, both these thermospheric emission line intensities are used to infer the modulations in the F-region ionosphere. The modulations in the temporal variation of nocturnal airglow intensities have been found to be associated with the variations in the F-layer heights (Bar-bier, 1959), with the well-known equatorial reverse plasma fountain (Kulkarni and Rao, 1972; Sridharan et al., 1993; Sekar et al., 1993), with the meridional wind reversal associ-ated with midnight temperature anomaly (Herrero and Meri-wether, 1980) and plasma depletions (Sipler et al., 1981). Most of the earlier studies have been carried out using pho-tometers having a broad spectral range (band width ranging from 0.6-nm to a few nm) and as a consequence, without the requirement of stringent temperature tuning of the inter-ference filters used. On the other hand, the airglow imagers which have been usually deployed for ESF investigations are devices aimed at having large spatial coverage (large field of view) and hence filters with large bandwidth are used. A narrow band (∼0.3-nm) photometer, along with the ALTAIR
radar (Sipler et al., 1981), was operated to obtain all-sky map of airglow intensities which revealed airglow depletions. Al-though the plasma drift velocities obtained by the photome-ter were compared with the line-of-sight neutral wind veloci-ties measured by a collocated airglow spectrometer, the vari-ations in the airglow intensity were not compared with the ESF structures obtained by the radar.
In order to unravel the association of the variations in the airglow intensity with the ESF structures revealed by VHF radars, a co-ordinated campaign was conducted at Gadanki (13.5◦
N, 79.2◦
E, dip lat. 6.3◦
N) by simultaneously operat-ing the MST radar and a narrow pass-band photometer. Co-ordinated observations are available for a few nights. In this communication, we present the range-time-intensity (RTI) and range-time-velocity (RTV) maps obtained by the VHF radar with the emission intensities from the thermospheric airglow lines of 630.0-nm and 777.4-nm on an ESF and a non-ESF night.
2 Experimental details
The mesosphere-stratosphere-troposphere (MST) radar at Gadanki is a high power coherent pulsed radar. It operates at 53 MHz and can attain a maximum power aperture prod-uct of 3×10¹⁰ Wm2. The radar system consists of (i) a to-tal of 1024 three element Yagi antennas arranged in two or-thogonal sets, (ii) 32 high power transmitters, (iii) 32 units of transmit-receive duplexes, and (iv) a phase coherent re-ceiver. A detailed description of various subsystems (Rao et al., 1995) and the observation of equatorial Spread F ir-regularities using this radar for the first time (Patra et al., 1995) were reported earlier. In order to obtain echoes from field aligned ESF irregularities, the radar beam was oriented 14.8◦
N from zenith which makes the beam transverse to the Earth’s magnetic field at F-region altitudes.
A multi-wavelength scanning nighttime photometer has recently been developed at the Physical Research Laboratory to study the airglow emission intensities from the thermo-sphere and mesothermo-sphere. This photometer comprises of three sections, namely the front-end optics, the filter section and a detector section. A front end optics, containing a camera and collimating lenses, along with a field stop (field-of-view of ∼3◦
which is similar to the VHF radar beamwidth), is used to collimate the beam. The filter section is kept in the collimated portion of the beam. A rotating platform consist-ing of four filter assemblies is arranged in such a way that one of the filter assemblies becomes optically aligned with the front end optics and the detector attached beneath the fil-ter section. Narrow band (band width∼0.3-nm) temperature tuned interference filters are used in these filter assemblies. A typical filter assembly consists of a brass chamber enclosed in thermally insulated housing that provides isolation from the environment. The temperature of the brass chamber is controlled using a bi-polar temperature controller which em-ploys Peltier elements and AD-590 temperature sensors (ac-curacy of ∼0.1◦
on the cathode of a photomultiplier tube (S-20; EMI 9863) housed in a temperature controller unit provided by EMI. A reasonably fast scanning mirror assembly was attached on top of the front end optics. The rotation of the filter platform and the mirror scanning are controlled by a computer. How-ever, in the present communication, results obtained from vertical direction only are discussed.
In addition to the VHF radar and optical measurements, information on the ionospheric height parameter h’F are ob-tained from a digital ionosonde (KEL make, Model IPS42) which is being systematically operated from SHAR, a station 100 km east of Gadanki. The temporal resolution of the iono-grams obtained for the present campaign is only 15 minutes.
3 Results
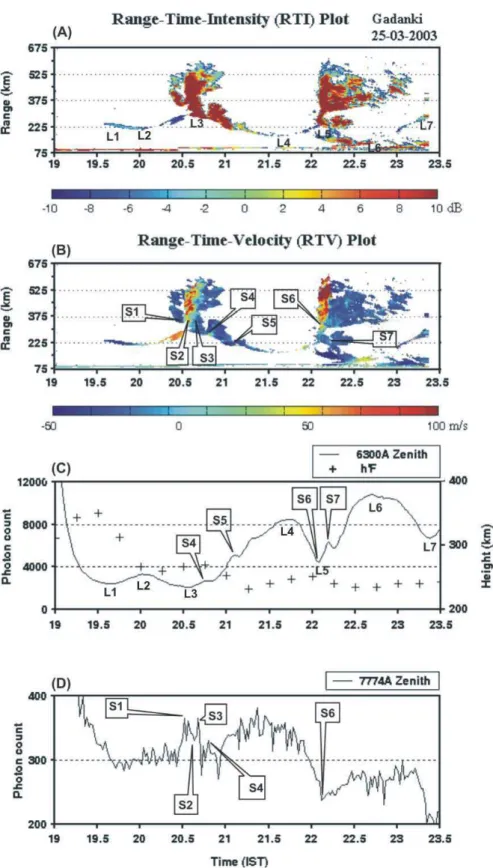
Figure 1 depicts composite results obtained from both VHF radar and airglow photometer on 25 March 2003 when ESF was present. The horizontal axis corresponds to time in IST (Indian Standard Time, IST=Universal Time, UT+5.5 h) which is common for all the subplots. The range-time-intensity (RTI) and range-time-velocity (RTV) of the radar echoes are plotted in subplots (A and B). The colour codes in them correspond to the intensity of return echoes in (A) and line-of-sight Doppler velocities in (B). The vertical colum-nar intensities of 630.0-nm and 777.4-nm airglow emissions are depicted in (C) and (D) subplots of Fig. 1. The RTI map in Fig. 1A consists of wave-like bottomside structures and vertically rising and/or slanted plume structures in the height region above 350 km. The velocities in the bottom-side structures are predominantly downward except during 20.25 to 20.5 and 21.75 to 22.25 IST. The velocities inside plume structures are upward in certain regions and down-ward in other regions. Downdown-ward velocities of the order of 50 m/s are also seen. The temporal variation of the 630.0-nm airglow intensities in Figure 1C comprises of a monotonic decrease during the initial phase along with macro and mi-cro variations in the later phase. The mami-cro variations are marked at the nodal points by alphanumerical letters L1 to L7. It is to be noted that any variation in the airglow in-tensity which spans in time≤15 min and in amplitude∼2–3 times more than the statistical noise level (square root of the count level) is considered to be a “micro” variation. They are marked at the regions of mutual correspondence by the tips of the pointers emanating from the symbol boxes denoted by “S”. These boxes are placed suitably to avoid cluttering and to prevent them obscuring the structures shown by the radar map. In Fig. 1C, the micro variations are denoted by S4 to S7. Note that the symbols corresponding to micro variations are marked in the RTV maps instead of the RTI maps for the purpose of clarity. The altitude variation of the base height of the F-region (h’F) obtained from the ionograms over SHAR, a station 100 km east of the radar site is also plotted in Fig. 1C along with the temporal variation of the 630.0-nm intensity. The macro variations in the 777.4-nm airglow intensity in Fig. 1D are reasonably similar with those in the 630.0-nm
intensity corresponding to Fig. 1C. In addition to them, mi-cro variations are seen in between 20.5 to 20.75 IST, which are denoted by S1 to S3. Note that these micro variations are present only in 777.4-nm intensities corresponding to high altitude plume structures in Fig. 1A. The micro variations such as S4 and S6 are present in both the emission lines while the micro variation denoted by S7 is present only in 630.0-nm emission line.
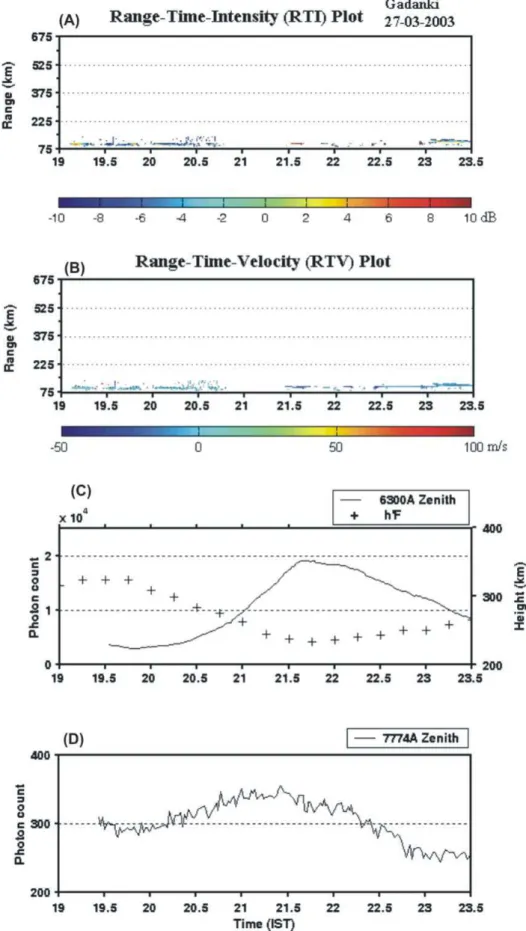
Figure 2, consisting of similar subplots (2A-D), depicts the corresponding temporal variations on a night (27 March 2003) when ESF activity was not present. As expected, there is no VHF radar structure in the F-region, only some E-region structures. In subplots 2C and 2D micro variations above the statistical noise are not seen. However, macro variation in the airglow intensity corresponding to the F-region base height (h’F) variation is observed. The temporal variation of the F-region base height depicted in the subplot 2C is found to be in anti-correlation with the macro variation present in 630.0-nm intensity.
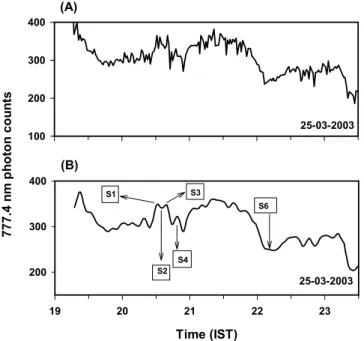
The 777.4-nm emission intensities on both nights are, in general, less intense compared to the 630.0-nm emission in-tensities as the radiative recombination rate responsible for 777.4-nm emission is orders of magnitude smaller than the dissociative recombination rate. Further, the quantum effi-ciency of the photomultiplier tube used in the present opti-cal experiment is less in the wavelength regime of 777.4-nm compared to 630.0-nm. Thus, the statistical noises are higher in 777.4-nm emission intensities. In order to reduce the sta-tistical noise in 777.4-nm intensity variation, the following procedure is adopted. The time series data obtained on 25 March 2003 were subjected to Fourier analysis and a low pass filter (frequencies more than 6 cycles/h are eliminated) was applied in the frequency domain and a reconstruction was made in the time domain. Figure 3 depicts the recon-structed data along with the original one. All the micro vari-ations marked in Fig. 1 are clearly seen in the reconstructed data.
4 Discussion
25-03-2003 100 200 300 400 25-03-2003 Time (IST)
19 20 21 22 23
7 7 7 .4 n m ph oton c o u n ts 200 300 400 S1 S2 S3 S4 S6 (A) (B)
Fig. 3.(A)Nocturnal variation of 777.4-nm intensity on 25 March 2003 as observed by the photometer and(B)reconstructed variation after the removal of high frequency components in the frequency domain.
processes, like the reverse fountain effect and/or the mid-night temperature anomaly, may also contribute to the above mentioned departure in amplitude. However, the similarities in the macro variations of both the line emissions (630.0-nm and 777.4-(630.0-nm) suggest that these macro variations are mainly due to the altitude variations of the F-layer. As the macro variations in airglow intensity primarily depend on the base height variation of the F-region, they are also found on the nights when ESF is not observed (see Fig. 2). On cer-tain equatorial Spread F nights, variations in the F-region base height manifest as a bottomside large scale wave-like structure, depending on the amplification by Rayleigh-Taylor instability mechanism of large-scale perturbation associated with the F-region layer movement.
The micro variations observed in 630.0-nm and 777.4-nm intensities are found to be in correspondence with the plume structures in RTI maps. Those plume structures, whose roots extend up to 250 to 300 km altitude region, such as S4 to S7, register their presence as micro variations in 630.0-nm inten-sity and those plume structures which spread over F-region peak altitude register their signatures only in 777.4-nm inten-sity. For example, the structures in the RTI maps correspond-ing to S1 to S3, have optical signatures only in 777.4-nm and not in 630.0-nm intensity. In addition to the micro variations (see S2 and S6) corresponding to plasma depleted structures, micro variations (see S1, S3 and S7) corresponding to plasma enhancement structures are also observed. Some of these mi-cro variations (see S1 and S3) which represent plasma en-hancement structure, extend well above 350 km with
corre-sponding significant downward movement1. This is evidence for an enhancement which is seen well above 350 km in a buoyancy dominated region which cannot be controlled by ambient westward electric field alone. Further, micro vari-ations are found to be absent on the night when ESF is not observed. Thus, the micro variations are essentially associ-ated with plasma structures developed during ESF activity.
The upward moving depletions have been observed by other optical measurements involving imaging techniques (Mendillo et al., 1985; Sinha et al., 1996). The measuments of airglow enhancement flanking depletions were re-ported over Asian (Sinha et al., 1996) and South American (Mendillo et al., 1985) longitudes using imagers with wide band filters. Mendillo et al. (1985) compared their obser-vation with the simulation studies using a long wavelength mode as seed perturbation. This study (Mendillo et al., 1985) revealed that the airglow depletions corresponding to ESF bubble structure were flanked by regions with relatively en-hanced plasma concentration. However, in this investigation the variation of the background F-region of the ionsphere is not included. As discussed earlier, the background F-region movement can also manifest into macro variation in airglow intensity in the temporal domain. Therefore, using an imag-ing technique, which employs a wide band filter and wide angle coverage, it is difficult to differentiate whether those airglow structures (particularly in 630.0-nm) correspond to the F-region height variation or are due to plasma processes associated with ESF structures, especially when the obser-vation site is close to the magnetic equator. With the help of such imaging technique, it is easier to identify the ESF structures which correspond to plasma depletions rather than plasma enhancements as the degree of depletion is an or-der of magnitude larger compared to the degree of enhance-ment with respect to the background ionization level during Spread F events. In addition to that, relatively small enhance-ments are often embedded in the depletion zones (see S7), making the identification by optical imaging technique even more difficult. However, using narrow band photometry with temperature-tuned interference filter, it is possible to unam-biguously identify these structures in ESF.
As mentioned in Section 2, the radar observations were ob-tained at 14.8◦
N with respect to zenith. The optical measure-ments, on the other hand, correspond to the zenith direction. Therefore, it is clear that in spite of the radar and the opti-cal instrument being collocated, two different spatial regions in the sky are probed by the radar and the photometer at the altitude range of 250–300 km. The regions probed by radar and the photometer are seperated along the meridional direc-tion by 65–90 km. However, despite this horizontal seper-ation, a remarkable similarity between the radar structures and the micro variations in airglow intensity is observed.
1The region wherein the plasma enhancement is observed (see in
Taking into consideration of the magnetic field-aligned na-ture of ESF strucna-tures, the magnetic field geometry over the Indian zone, and the altitude extent of the airglow emission layers, it is easy to visualize that the field line mapping is responsible for the similarity between the optical and radar measurements. This suggests that the micro variations are the manifestation of large-scale magnetic field-aligned struc-tures like plasma bubbles which provide a platform for the generation of meter scale size plume structures. Earlier co-ordinated measurements (Tsunoda and Towle, 1979) reveal-ing collocated large-scale bubble with meter scale size irreg-ularities, provide support for the present observation. Ow-ing to narrow band and narrow beam photometry, the plasma bubble and enhancement structures register micro variation in this type of photometry. Thus, this kind of photometry provides the opportunity to obtain both micro variations due to plasma structures and macro variations due to background ionization.
Figure 1 suggests that the seed perturbation with more than one wavelength is required to give rise to a plume structure modulated over a bottomside wave-like structure. In this con-nection, the numerical simulation of F-region plasma struc-tures with two long wavelength modes as initial perturbation is relevant. That simulation revealed the presence of plasma enhancements which move downward at an altitude beyond 350 km (Sekar et al., 2001). These relative enhancement structures are found to vary with relative amplitude, wave-length and phases of the two modes. The present observation of 777.4-nm airglow intensity enhancement which is due to the plasma enhancement provides an experimental verifica-tion of the earlier predicverifica-tion (Sekar et al., 2001).
5 Conclusions
Narrow band photometric observations on 630.0-nm and 777.4-nm emission lines reveal micro variations during equa-torial Spread F nights, in addition to the usual macro vari-ations. Such micro variations are not observed on a non Spread F night, whereas macro variations are seen on both Spread F and non Spread F nights. In addition to the well-known anti-correlation between the base height of the F-region and the macro variations of thermospheric airglow in-tensity, the variation of the base height, on occasion, mani-fests as a bottomside wave-like structure. Using coordinated airglow and VHF radar measurements, the micro variations are identified to be due to the plasma structures associated with equatorial Spread F and found to be in correspondence with the VHF radar plume structures. Further, on some occasions, the VHF radar structures observed well beyond 350 km and moving downward are characterized as plasma enhancements. The observation of enhancement in 777.4-nm airglow intensity, which is characterized as plasma en-hancement, brings out the importance of the multiple modes as seed perturbation in the generation of equatorial Spread F. Acknowledgements. The authors thank the Director and the staff members of the National MST Radar Facility for their cooperation in making the observational campaign successful. This work is supported by the Department of Space, Government of India.
Topical Editor M. Lester thanks B. Reinisch and another referee for their help in evaluating this paper.
References
Barbier, D.: Recherches Sur la raie 6300 de la luminescence atmo-spherique nocturne, Ann. Geophysicae, 15, 179, 1959.
Haerendel, G.: Report - Theory of equatorial spread F, Max-Planck Inst. Fur Phys. and Astrophys., Garching, Germany, 1974. Herrero, F. A. and Meriwether, J. W. Jr.: 6300A Airglow meridional
intensity gradients, J. Geophys. Res., 85, 4191, 1980.
Huang, C. S. and Kelley, M. C.: Nonlinear evolution of equatorial spread F, 2. Gravity wave seeding of Rayleigh-Taylor instability, J. Geophys. Res., 101, 293, 1996.
Huba, J. D. and Ossakow, S. L.: On the generation of 3-m irregu-larities during equatorial spread F by low frequency drift waves, J. Geophys. Res., 84, 6697, 1979.
Kelley, M. C., LaBelle, J., Kudeki, E. et al.: The Condor equato-rial spread F Campaign: Overview of results of the large-scale measurements, J. Geophys. Res., 91, 5487, 1986.
Kulkarni, P. V. and Rao, V. R.: 6300A◦night airglow emission over
the magnetic equator, Ann. Geophys., 28, 475, 1972.
Laakso, H., Aggson, T. L., Pfaff, R. F., and Hanson, W. B.: Down-drafting plasma flow in equatorial bubbles, J. Geophys. Res., 99, 11 507, 1994.
Mendillo, M., Spence, H., and Zalesak, S. T.: Simulation studies of ionospheric airglow signatures of plasma depletions at the equa-tor, J. Atmos. Terr. Phys., 47, 885, 1985.
Mendillo, M., Baumgardner, J., Colerico, M., and Nottingham, D.: Imaging Science Contribution to equatorial aeronomy: initial re-sults from the MISETA Program: J. Atmos. Sol. Terr. Phys., 59, 1587, 1997.
Ossakow, S. L.: Spread F theories: A review: J. Atmos. Terr. Phys., 43, 437, 1981.
Patra, A. K., Ananadan, V. K., Rao, P. B., and Jain, A. R.: First ob-servations of equatorial spread F from Indian MST radar, Radio Sci., 30, 1159, 1995.
Patra, A. K., Rao, P. B., Anandan, V. K., and Jain, A. R.: Radar ob-servations of 2.8 m equatorial Spread F irregularities, J. Atmos. Sol. Terr. Phys., 59, 1633, 1997.
Raghavarao, R., Gupta, S. P., Sekar, R., Narayanan, R., Desai, J. N., Sridharan, R., Babu, V. V., and Sudhakar, V.: In-situ measure-ments of winds, electric fields and electron densities at the onset of equatorial Spread F, J. Atmos. Terr. Phys., 49, 485, 1987. Rao, P. B., Jain, A. R., Kishore, P., Balmuralidhar, P., Damle, S. H.,
and Vishwanathan, G.: Indian MST radar, 1, System description and sample vector wind measurements in ST mode, Radio Sci., 30, 1125, 1995.
Rao, P. B., Patra, A. K., Chandrasekhar Sarma, T. V., Krishna-murthy, B. V. , Subbarao, K. S. V., and Hari, S. S.: Radar ob-servation of updrafting and downdrafting plasma depletions as-sociated with equatorial Spread F, Radio Sci., 32, 1215, 1997. Sahai, Y., Aarons, J., Mendillo, M., Baumgardner, J., Bittencourt,
J. A., and Takahashi, H.: OI 630.0-nm imaging observations of equatorial plasma depletions at 16◦S latitude, J. Atmos. Terr.
Phys., 56, 1461, 1994.
Sekar, R., Suhasini, R., and Raghavarao, R.: Effects of vertical winds and electric fields in the nonlinear evolution of equatorial spread F, J. Geophys. Res., 99, 2205, 1994.
Sekar, R, and Kelley, M. C.: On the combined effects of vertical shear and zonal electric field patterns on nonlinear equatorial spread F evolution, J. Geophys. Res., 103, 20 735, 1998. Sekar, R., Kherani, E. A., Rao, P. B., and Patra, A. K.: Interaction
of two long-wavelength modes in the nonlinear numerical simu-lation model of equatorial Spread F, J. Geophys. Res., 106, 24, 765, 2001.
Sinha, H. S. S., Misra, R. N., Chandra, H., Shikha Raizada, Dutt, N., and Vyas, G. D.: Multi-wavelength optical imaging of iono-spheric plasma depletions, Indian J. Radio and Space Phys., 25, 44, 1996.
Sipler, D. P., Biondi, M. A. , and Hake, R. D. Jr.: Studies of the motion of equatorial 630.0-nm airglow depletions, Planet. Space Sci., 29, 1267, 1981.
Sridharan, R., Sekar, R., and Gurubaran, S.: Two-dimensional high-resolution imaging of the equatorial plasma fountain, J. Atmos. Terr. Phys., 55, 1661, 1993.
Sridharan, R., Chandra, H., Das, S. R. et al.: Ionization Hole cam-paign - a coordinated rocket and ground-based study at the onset of equatorial Spread F : First results, J. Atmos. Sol. Terr. Phys., 59, 2051, 1997.
Szuszezewicz, E. P., Tsunoda, R. T., Narcisi, R., and Holmes, J. C.: Coincident radar and rocket observations of equatorial spread F, Geophys. Res. Lett., 7, 537, 1980.
Takahashi, H., Sahai, Y., Clemesha, B. R., Simonich, D., Teixeira, N. R., Lobo, R. M., and Eras, A.: Equatorial mesospheric and F-region airglow emissions observed from 4◦south, Planet. Space Sci., 37, 649, 1989.
Tsunoda, R. T.: Magnetic field-aligned characteristic of plasma bubbles in the night time equatorial ionosphere, J. Atmos. Terr. Phys., 42, 743, 1980.
Tsunoda, R. T. and Towle, D. M.: On the spatial relationship of 1-meter equatorial Spread F irregularities and depletions in total electron content, Geophys. Res. Lett.,6, 873, 1979.
Weber, E. J., Buchau, J., Eather, R. H., and Mende, S. B.: North-South aligned equatorial airglow depletions, J. Geophys. Res., 83, 712, 1978.