www.ann-geophys.net/28/2071/2010/ doi:10.5194/angeo-28-2071-2010
© Author(s) 2010. CC Attribution 3.0 License.
Annales
Geophysicae
Daytime sodium airglow emission measurements over Trivandrum
using a scanning monochromator: first results
M. M. Hossain1, T. K. Pant1, C. Vineeth1, S. G. Sumod1, and R. Sridharan2
1Space Physics Laboratory, Vikram Sarabhai Space Centre, Trivandrum 695022, India 2Physical Research Laboratory, Ahmedabad 380009, India
Received: 15 June 2010 – Revised: 2 November 2010 – Accepted: 4 November 2010 – Published: 9 November 2010
Abstract. This paper presents measurement of daytime Sodium (Na) airglow emissions at 589.6 nm wavelength using a ground based 1-m scanning monochromator from Trivandrum (8.5◦
N, 77◦
E, 0.5◦
N dip latitude), a near-equatorial station in India. The Na emission intensity ex-hibits significant temporal variability within a day and from one day to another. The Na intensity has been compared with the daytime OH airglow intensity at 731.6 nm simultaneously measured using the unique Multiwavelength Dayglow Pho-tometer (MWDPM). The temporal variabilities of the Na and OH intensities corroborate each other in most of the occa-sions without any appreciable time delay, although a small time delay up to∼10 min has been observed at times. It ap-pears that the variability of daytime Na emissions is influ-enced too by the photo-chemical excitations. The observed similarities in the Na and OH intensities are believed to be due to the similar roles played by [O] and O3(in their photo-chemical excitations) and the dynamics occurring at about the same altitude region (∼90 km). It has also been found that the gravity waves play significant role in producing the short-scale oscillations in these emissions.
Keywords. Atmospheric composition and structure (Air-glow and aurora; Middle atmosphere – composition and chemistry)
1 Introduction
Earth’s atmosphere is known to have several metallic vapour layers, the first discovered among them was of sodium by Vesto Melvin Slipher (1929). The neutral atomic Na layer occurs globally in the upper mesosphere/lower thermosphere (MLT) region at an altitude∼90 km and it has a thickness
Correspondence to:M. M. Hossain (mosarraf sw@yahoo.co.in)
∼10 km. The major source of Na in the MLT region is the sporadic meteoroid ablation, although upward transport of water vapour from oceans is also considered as the other im-portant source (Khomich et al., 2008). Meteoroid ablation occurs because of their very high entry velocities leading to rapid heating by collision with the air molecules. The frictional heating of the meteoroid is balanced by radiative losses, and by absorption of the heat energy through their temperature increase, melting, phase transitions and vapor-ization (Plane, 2004).
Above the atomic Na layer around 90 km, ion chemistry predominates. Na atoms are ionized mainly by charge trans-fer with the ambient NO+and O+
2, although a small contri-bution comes from the solar photo-ionization. Na+ is then
neutralized by N2to form the clusters, which undergo disso-ciative electron recombination and converts back to atomic Na (Plane, 2004). Below the atomic Na layer, Na converts into stable reservoir of NaHCO3through a sequence of re-actions. First, the in-situ generated O3oxidizes Na atom to form NaO, which in the presence of water vapor or hydro-gen forms NaOH. The NaOH combines with CO2 to form NaHCO3. The species, such as NaO, NaOH and NaHCO3 are converted back to Na through the reactions with O and H, and also by photolysis. Obviously the gas-phase metallic Na chemistry is closed, that is, all the constituent species cy-cle between each other, and no species provide a permanent sink for Na in the upper mesosphere (Plane, 2004).
In the MLT region, above and below the atomic Na layer sodium exists respectively in the form of ions (such as Na+,
NaN+
2 cluster, NaO
+ etc.) and chemical compound (such
2072 M. M. Hossain et al.: Daytime sodium airglow emission measurements over Trivandrum
O+O2(+M)→O3(+M) (1)
Na+O3→NaO+O2 (2)
NaO+O→Na∗(2P)+O2 (3)
Na∗(2P)→Na(2S)+hν (589.0 and 589.6 nm) (4) where “M” denotes a third body, usually N2molecule or O atom. It is obvious from the above reactions that the photo-chemistry can also control the daytime excitations of Na atoms and hence, the Na dayglow emissions.
Daytime ground based measurement of sodium airglow emissions is particularly difficult to perform. Because, in-tensity of the light available for resonant excitation of Na atoms is considerably less. This is obvious from its pres-ence near the bottom of the very pronounced solar Fraun-hofer absorption D line. Removal of Rayleigh and Mie scat-tered unwanted background light is also difficult. Hence the problem is to detect and measure the intensity of an emis-sion line near the bottom of that absorption line, where the emission line intensity is at most equal to that of the resid-ual scattered light and both combined are only one-tenth as strong as the nearby continuum (Blamont, 1961). Besides, the sodium emission lines are in the close neighbourhoods with the 5889 ˚A, 5894 ˚A, 5895 ˚A and 5901 ˚A lines of the OH (8–2) band (Yarin et al., 1962a; Takahashi et al., 1981; She-fov and Piterskaya, 1984). This gives rise to difficulties in photometric measurements using narrow-band interference filters. Hence, it requires specialized techniques to measure the Na airglow emission intensities with significant signal-to-noise ratio after elimination of solar background as well as the neighbouring OH lines.
There are many reports involving study of nighttime ground based Na airglow emissions (Clemesha et al., 1978, 1979, 1995; Kirchhoff et al., 1979; Sarkhel et al., 2009). However, there exist no recent systematic studies on day-time ground based Na airglow emissions. In this paper we have demonstrated a technique based on a 1-m scanning monochromator for ground based measurement of daytime sodium airglow emissions at 5896 ˚A and compared it with the OH airglow emissions simultaneously measured using the unique Multiwavelength Dayglow Photometer (MWDPM) at Trivandrum (77◦
E, 8.5◦
N, 0.5◦
N dip latitude). Also in this study, the role of photochemistry has been considered to in-vestigate the reason for similar variabilities in the Na and OH emissions.
2 Experimental details
A 1-m scanning monochromator (in Czerny-Turner configu-ration) augmented with a high diffraction efficiency (∼70%) and high resolution plane holographic grating (groove den-sity 2400 g mm−1, ruled area 102×102 mm2), and an effi-cient reflecting optics is used in this study. Maximum reso-lution of the system achieved with this grating is 0.05 ˚A. The
monochromator employs an image transfer system, which comprises of aspheric collimating and focusing mirrors, and axial entrance/exit slits. A photo-multiplier tube (PMT) with multi alkali cathode is used as the detector.
As mentioned in the previous section, this study is car-ried out from Trivandrum, India. Day light from zenith is al-lowed and guided through the reflecting optics of the system to properly fill the acceptance cone of the monochromator, which has an effective aperture of F/8.7. The solar Fraun-hoffer D-lines (at 5890 ˚A and 5896 ˚A) separated by ∼6 ˚A are located and measured by scanning∼15 ˚A in the above mentioned wavelength region (Fig. 1a). The D1absorption line (5896 ˚A) as shown in Fig. 1b is chosen for the present study. Near the bottom of D1 absorption line an emission like feature is noticed at every scan. Subtraction of the in-tensity value at the wing of this feature from that at the peak gives an estimate that is proportional to the intensity of this emission like feature. To show that this feature is the Na air-glow emission, regular scans are performed at every 15 min on a clear cloud-free day and the above mentioned subtrac-tion is repeated at every scan. The subtracted intensity values are plotted with time as shown in Fig. 2. Later on, for regular daytime observations, wavelength position of the grating is locked at 5896 ˚A and the temporal variation of the Na inten-sity is measured through out the day.
The MWDPM, which uses interference filter as the wave-length selector is capable of making near simultaneous mea-surements of daytime airglow emissions at three different wavelengths (7316 ˚A, 7402 ˚A, and 6300 ˚A). The OH airglow emissions at 7316 ˚A are used for comparing the Na airglow emissions obtained using the present spectrometer. The tech-nical details of the MWDPM have been described elsewhere (Sridharan et al., 1998).
3 Results and discussions
Figure 1a shows the solar Fraunhofer D lines measured by the present spectrometer using 100 µm slit width and 5 ˚A min−1scan speed. The zoomed in D
1line, which shows an emission like feature is depicted in Fig. 1b. This feature is assumed to be that of the Na airglow emission, since it sits near the bottom of the Fraunhofer D1 absorption line. Further, to make sure that this is the Na emission feature, the aforementioned method described in Sect. 2 is followed. The line curve of Fig. 2a, drawn following the procedure of Sect. 2 depicts the temporal variability of the normal-ized intensity of this emission like feature measured at ev-ery 15 min at the position as shown in Fig. 1b. The emis-sion intensity has been normalized according its maximum value. The curve with square symbols of Fig. 2a shows the temporal variability of the normalized intensity of OH emission at 7316 ˚A obtained from the MWDPM. It is ob-vious from Fig. 2a that these intensity variabilities follow similar trend. To show the degree to which these intensity
Fig. 1. (a)Solar Fraunhofer D lines (5890 and 5896 ˚A) on a clear day measured by the spectrometer using 100 µm slit width and 5 ˚A min−1scan speed.(b)Zoomed in Fraunhofer D1 line (5896 ˚A) which shows the Na airglow emission feature.
variabilities are correlated, cross-correlation analysis is per-formed. It is found that the intensity variabilities of Fig. 2a are best correlated (maximum cross-correlation of 0.82) with a time lag∼3 min. Obviously, the intensity variabilities of both the emissions of Fig. 2a, which exhibit short-scale fluc-tuations, are excellently correlated with slight temporal shift. Figure 2b also shows this short-scale fluctuations and their excellent correlation (maximum cross-correlation 0.79 with a delay∼7 min) on a different day. Now, it is known that these short-scale fluctuations, which are indicators of the am-bient chemical/dynamical processes of the particular region of atmosphere (∼90 km altitude), are always present in the temporal variability of the airglow emissions. This clearly indicates that the intensities of the feature measured by the spectrometer are of Na airglow emissions.
Figure 3a–d, which are presented here to confirm the above observations, depict the comparisons of the
normal-Fig. 2. (a)Comparison of the daytime variability of the normalized intensities of the Na emission at 5896 ˚A (obtained at every 15 min at the positions of the feature as shown in Fig. 1b) and OH emissions at 7316 ˚A.(b)Same as Fig. 2a but on a different day.
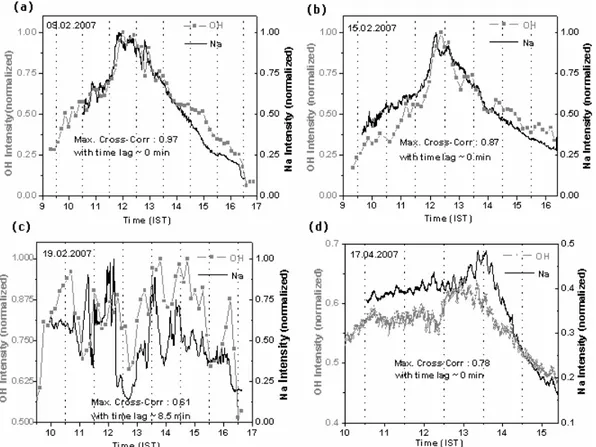
ized intensities of Na and OH emissions on four different days. For Fig. 3a, b and d maximum cross-correlations ob-tained are respectively 0.97, 0.87 and 0.78 with zero time lag. Obviously the Na and OH emissions variabilities on these 3 days show excellent correlations without any noticeable time delay. However, the maximum cross-correlation obtained for Fig. 3c is 0.61 with a time lag∼8.5 min. Hence, it is clear from Fig. 3c that this particular day shows good correlation but with a small time delay. As shown in Fig. 3, Na emission exhibits significant variability within a day and from one day to another. The short-scale modulations therein indicate the possible role of dynamics and the chemistry.
2074 M. M. Hossain et al.: Daytime sodium airglow emission measurements over Trivandrum
Fig. 3. (a–d)Comparative plot of the temporal variabilities of the Na and OH emissions on 4 days during February 2007.
of the days the intensities do not exhibit this diurnal varia-tion. OH intensities on 9 to 15 February reveal the typical variation of this site, with intensities on 9th, 14th and 15th corroborating with that of the Na emissions. In post-noon hours of 12th and 13th, variations in the Na and OH intensi-ties reveal opposite trends, i.e. the former increases while the latter decreases. This post-noon hours dissimilar variabilities on these two days could be linked to the disparity in the emis-sion layers height variations for the respective emisemis-sions. Na emission on 19th shows very large oscillations that are also seen in the OH emissions. The wavelet analysis of these emission intensities reveals the presence of gravity waves of periodicity∼1.5 h as seen in Fig. 6. Since both the emis-sions originate from the same altitude regime, signatures of the gravity waves are expected to be the same for both the emissions. This is reflected in the observed oscillations of both the emissions. Signatures of gravity waves in the Na and OH airglow emissions have also been reported by many studies in the past (Molina, 1980; Datarange et al., 1984; Medeiros et al., 2003). Na emission intensity on 21st, 22nd and 23rd exhibits an unusual and fast enhancement at around 11:00 Indian Standard Time (IST). On these days, OH emis-sions also exhibit a sudden increase around the same time. Obviously, there exist similarities among the variabilities of these emissions.
For daytime Na airglow emissions, it is well-known that resonant excitation plays the dominant role. On the other hand, daytime OH emissions owe only to the photo-chemical excitations. Now it has been found that the daytime Na and OH emissions variabilities corroborate each other excellently not only in some of the above mentioned days but also on many other days throughout the years. To be more specific, we had simultaneous measurements of Na and OH emissions for about 75 days from February 2007 to November 2009. Among these days, about 80% days show excellent similari-ties, about 15% show similar trends and about 5% show dis-similar variabilities. From these observations, it appears that photo-chemical excitations are also playing important role in the daytime Na emission variabilities. To investigate the reason behind similar variabilities, let us recollect the Chap-man chemical scheme for excitation of Na atoms as given by Eqs. (1–4) in the “Introduction”. On the other hand, day-time OH emissions owe to the following chemical excitations (Bates and Moiseiwitsch, 1956)
O+O2(+M)→O3(+M) (5)
H+O3→OH∗(v≤9)+O2 (6)
OH∗
(v≤9)→OH+hν (0.5–5 µm) (7)
where “v” denotes the vibrational states involved in the emission processes. Transitions among the same
Fig. 4.Temporal variations in the observed Na emission intensities on the 9 days during February 2007.
Fig. 5.Same as Fig. 4 but for the OH emissions.
2076 M. M. Hossain et al.: Daytime sodium airglow emission measurements over Trivandrum
Fig. 6.Wavelet periodograms of(a)OH Intensity and(b)Na Inten-sity, on 19 February 2007.
vibrational-rotational levels of OH radicals according to Eq. (7) give rise to the OH emission. It is obvious from Eqs. (5–7) as well as the Chapman scheme of Eqs. (1–4), O and O3play similar role in the excitations of both the Na and OH emissions. Also, both the emissions originate from the same altitude region (90 km) that is significantly influ-enced by the dynamics i.e. waves and tides of lower atmo-spheric origin. Being originated from the same region, effect of the dynamical activity is expected to be same for both the emissions. Hence, similar variabilities in these emissions are believed to be due to the similar role played by the [O] and O3 (in their photo-chemical excitations) and the dynamics occurring at the same altitude region.
To consider the errors of measurements involved in the present technique, let us recollect that the measurement is made near the bottom of Fraunhofer D1 absorption line, where Rayleigh scattered light and the terrestrial Na absorp-tion feature lie apart from the Na dayglow line emission. Doppler shift of this line emission around the bottom of the absorption line throughout the day could introduce time vary-ing errors in the measurements, but for Na wavelength since the Fraunhofer line width is quite large in comparison to the Doppler shift, this error can be neglected (Chanin, 1975). However, since the wavelength reproducibility of the present spectrometer is∼0.1 ˚A, during tuning it to the D1 line by scanning, there may occur a maximum wavelength position-ing error∼0.1 ˚A from its actual position. Because of this positioning error the maximum measurement error has been estimated and it is found to vary between 8–10% from the actual emission intensity. Also the terrestrial Na absorption feature changes diurnally because of the slant path variation through the Na layer. Depending on the zenith angle vari-ation and the Na abundance varivari-ation there occur varivari-ations in the solar radiation absorption, which may introduce a time varying depression of the dayglow signal. It is already known
that the percent depression of the dayglow signal is equal to the percent terrestrial absorption (Burnett et al., 1975). Hence, this absorption also is likely to introduce a small mea-surement error.
More studies have been called for to quantify the roles of O, O3and Na concentrations in explaining the temporal evo-lution of the Na emissions. Also the study on the specific role of the dynamics on the Na emissions over this site is in progress.
4 Conclusions
A ground based 1-m scanning monochromator has been used to measure the daytime Na airglow emissions at 589.6 nm from Trivandrum, a near-equatorial station in India. The Na emission intensity exhibits significant variability within a day and from one day to another. Na emission intensity has been compared with the daytime OH airglow emission at 731.6 nm, which is simultaneously measured using the unique Multiwavelength Dayglow Photometer. On most of the occasions, the temporal variability of the Na and OH emissions corroborate each other without any appreciable time delay, although a small time delay up to∼10 min has been observed from time to time. It appears, in this study that the daytime Na emission variabilities are influenced too by the photo-chemical excitations. The observed similar vari-abilities in the Na and OH emissions are believed to be due to the similar role played by the [O] and O3(in their photo-chemical excitations) and the dynamics occurring at about the same altitude (∼90 km). It is also found in this study that the dynamics, particularly the gravity waves play important role in producing the short-scale oscillations in these emis-sions.
Acknowledgements. This work was supported by Department of
Space, Government of India. One of the authors C. Vineeth grate-fully acknowledges the financial assistance provided by the Indian Space Research Organization.
Topical Editor C. Jacobi thanks P. Ammosov and another anony-mous referee for their help in evaluating this paper.
References
Bates, D. R. and Moiseiwitsch, B. L.: Origin of the Meinel hydroxyl system in the night airglow, J. Atmos. Terr. Phys., 8(6), 305–308, 1956.
Blamont, J. E.: The dayglow of the sodium D lines, J. Geophys. Res., 66(5), 1407–1423, 1961.
Burnett, C. R., Lasher, R. W., Miskin, A. S., and Sides, V. L.: Spec-troscopic Measurement of Sodium Dayglow: Absence of a Large Diurnal Variation, J. Geophys. Res., 80(13), 1837–1844, 1975. Datarange, D. K. and Tillu, A. D.: Gravity waves from
sodium-dayglow observations, Adv. Space Res., 4(4), 101–104, 1984. Chanin, M. L.: Filling in of the Fraunhofer lines by scattering on
the ground, J. Geophys. Res., 80(19), 2859–2862, 1975.
Chapman, S.: Notes on atmospheric sodium, J. Astrophys., 90, 309–316, 1939.
Clemesha, B. R., Kirchhoff, V. W. J. H., and Simonich, D. M.: Si-multaneous observations of the Na 5893-A nightglow and the distribution of sodium atoms in the mesosphere, J. Geophys. Res., 83, 2499–2503, 1978.
Clemesha, B. R., Kirchhoff, V. W. J. H., Simonich, D. M., Taka-hashi, H. P., and Batista, P.: Simultaneous observations of sodium density and the NaD, OH (8, 3), and OI 5577- ˚A night-glow emissions, J. Geophys. Res., 84, 6477–6482, 1979. Clemesha, B. R., Simonich, D. M., Takahashi, H. S., Melo, M.
L., and Plane, J. M. C.: Experimental evidence for photochem-ical control of the atmospheric sodium layer, J. Geophys. Res., 100(D9), 18909–18916, 1995.
Khomich, V. Yu, Semenov, A. I., and Shefov, N. N.: Airglow as an indicator of upper atmospheric structure and dynamics, Springer, 2008.
Kirchhoff, V. W. J. H., Clemesha, B. R., and Simonich, D. M.: Sodium Night-glow Measurements and Implications on the Sodium Photochemistry, J. Geophys. Res., 84(A4), 1323–1327, 1979.
Medeiros, A. F., Taylor, M. J., Takahashi, H., Batista, P. P., and Gobbi, D.: An investigation of gravity wave activ-ity in the low-latitude upper mesosphere: Propagation direc-tion and wind filtering, J. Geophys. Res., 108(D14), 4411, doi:10.1029/2002JD002593, 2003.
Molina, A.: Sodium nightglow and gravity waves, J. Atmos. Sci., 40, 2444–2450, 1983.
Plane, J. M. C.: A time-resolved model of the mesospheric Na layer: constraints on the meteor input function, Atmos. Chem. Phys., 4, 627–638, doi:10.5194/acp-4-627-2004, 2004.
Sarkhel, S., Sekar, R., Chakrabarty, D., Narayanan, R., and Srid-haran, S.: Simultaneous sodium airglow and lidar measure-ments over India: A case study, J. Geophys. Res., 114, A10317, doi:10.1029/2009JA014379, 2009.
Shefov, N. N. and Piterskaya, N. A.: Spectral and space-time characteristics of the background luminosity of the upper atmo-sphere Hydroxyl emission, in: Aurorae and Airglow, edited by: Galperin, Yu. I., N 31.VINITI, Moscow, 1984.
Slipher, V. M.: Emissions in the spectrum of the light of the night sky, Publ. Astron. Soc. Pacific, 41, 262–265, 1929.
Sridharan, R., Modi, N. K., Raju, D. P., Narayanan, R., Pant, T. K., Taori, A., and Chakrabarty, D.: Multiwavelength daytime photometer-a new tool for the investigation of atmospheric pro-cesses, Meas. Sci. Technol., 9, 585–591, 1998.
Takahashi, H. and Batista, P. P.: Simultaneous measurements of OH(9,4), (8,3), (7,2), (6,2) and (5,1) bands in the airglow, J. Geo-phys. Res., 86A, 5632–5642, 1981.