www.hydrol-earth-syst-sci.net/12/293/2008/ © Author(s) 2008. This work is distributed under the Creative Commons Attribution 3.0 License.
Earth System
Sciences
The olive tree: a paradigm for drought tolerance in Mediterranean
climates
A. Sofo1, S. Manfreda2, M. Fiorentino2, B. Dichio1, and C. Xiloyannis1
1Dipartimento di Scienze dei Sistemi Colturali, Forestali e dell’Ambiente, Universit`a degli Studi della Basilicata, Via dell’Ateneo Lucano, 10, 85100 Potenza, Italy
2Dipartimento di Ingegneria e Fisica dell’Ambiente, Universit`a degli Studi della Basilicata, Via dell’Ateneo Lucano, 10, 85100 Potenza, Italy
Received: 6 August 2007 – Published in Hydrol. Earth Syst. Sci. Discuss.: 6 September 2007 Revised: 10 January 2008 – Accepted: 25 January 2008 – Published: 27 February 2008
Abstract. Olive trees (Olea europaea L.) are commonly grown in the Mediterranean basin where prolonged droughts may occur during the vegetative period. This species has de-veloped a series of physiological mechanisms, that can be observed in several plants of the Mediterranean macchia, to tolerate drought stress and grow under adverse climatic con-ditions. These mechanisms have been investigated through an experimental campaign carried out over both irrigated and drought-stressed plants in order to comprehend the plant re-sponse under stressed conditions and its ability to recover. Experimental results show that olive plants subjected to wa-ter deficit lower the wawa-ter content and wawa-ter potentials of their tissues, establishing a particularly high potential gradi-ent between leaves and roots, and stop canopy growth but not photosynthetic activity and transpiration. This allows the continuous production of assimilates as well as their ac-cumulation in the various plant parts, so creating a higher root/leaf ratio if compared to well-watered plants. Active and passive osmotic adjustment due to the accumulation of carbohydrates (in particular mannitol and glucose), proline and other osmolytes have key roles in maintaining cell tur-gor and leaf activities. At severe drought-stress levels, the non-stomatal component of photosynthesis is inhibited and a light-dependent inactivation of the photosystem II occurs. Finally, the activities of some antioxidant enzymes involved in the scavenging of activated oxygen species and in other biochemical pathways increase during a period of drought. The present paper provides an overview of the driving mech-anisms adopted by olive trees to face drought stress with the aim of better understanding plant-soil interactions.
Correspondence to:S. Manfreda ([email protected])
1 Introduction
The Mediterranean-climate regions are characterised by a cy-cle of temperatures out of phase with the rainfall forcing, pro-ducing mild to cool rainy winters and dry summers. The hy-drological variability of Mediterranean climate regions is due to a combination of rainfall (irregularly distributed in time and space) and heterogeneous land topography. The exist-ing variety of climatic conditions in these areas is due to the specific configuration of land surface (topography) and dis-tance from sea (Fiorentino et al., 2006). The climatic forcing of Mediterranean areas induces a temporal variability in the soil moisture dynamics that is strongly affected by seasonal fluctuations between humid and dry conditions (e.g., Teuling et al., 2005; Bolle, 2003). This behaviour is clearly due to the characteristic climatic conditions of the region that moves from rainy winters to dry summers characterised by low air humidity, high solar radiation and consequently high rates of evapotranspiration. In these periods, water becomes a limit-ing factor produclimit-ing prolonged and intense drought stress in plants.
The most relevant mechanisms are the regulation of stomata closure and transpiration (Moreno et al., 1996; Nogu´es, and Baker, 2000), the regulation of gas exchange (Moriana et al., 2002), a very developed osmotic adjustment (Chartzoulakis et al., 1999), the regulation of the antioxidant system (Bace-lar et al., 2007), the appearance of leaf anatomical alterations (Chartzoulakis et al., 1999), and the ability of extracting wa-ter from the soil due to a deep root system (Fernandez et al., 1997) and to a high water potential gradient between canopy and root system (Tombesi et al., 1986). Olive trees are confirmed to be efficient soil water users, thanks to their xylem sap transport and the ability to maintain significant rates of gas exchange even during drought stress (Tognetti et al., 2004). For these reasons, the olive tree can be defined as a model plant for drought tolerance in Mediterranean climates. The olive is the emblematic tree of the Mediterranean re-gions and constitutes an integral and significant part of the Mediterranean environment and culture, however, its eco-logical importance has only recently been acknowledged (Loumou and Giourga, 2003). Olive growing is often con-fined to slopes or fairly ragged land and occupies important parts of mountains and hills (Favia and Celano, 2005) be-cause its culture reduces soil erosion and favors the preserva-tion of a high bio-diversity (Loumou and Giourga, 2003).
Understanding the mechanisms by which olive plants face drought stress under extreme environmental condition is essential for selecting more drought-tolerant cultivars and hence for saving water resources in semi-arid environments. The aim of the study is to analyze drought effects on physio-logical and biochemical mechanisms of olive plants, such as: gas exchange, photosynthetic efficiency, photoinhibition, os-motic adjustment, cell wall properties, antioxidant enzymes, markers of oxidative stress and growth parameters. Some of those processes have been monitored both under drought conditions and during the following rewatering phase in or-der to better explain the high degree of tolerance to water deficit observed in this species. The information here ob-tained may improve our knowledge regarding the temporal variability of plant-soil-atmosphere continuum in this typical species of Mediterranean semi-arid regions.
2 Materials and methods
Experimental results discussed in the present paper were col-lected from two experiments: the first carried out on plants grown in vase under controlled conditions and the second on plants grown in field conditions. The use of two exper-imental approaches is due to the wide spectrum of physio-logical parameters investigated herein. In the first case, it is possible to obtain a relatively large number of measures referred to plants under equal soil moisture conditions (or water stress), whereas the field experiment was used to avoid the limiting effect of vases in root growth. Consequently, the measurements of physiological and biochemical parameters
were taken during the first experiment, while growth param-eters of plants were recorded in the second one.
2.1 Description of the first experiment
The first experiment was carried out at Metaponto (South-ern Italy, Basilicata Region – N 40◦24′, E 16◦48′) using
ap-proximately 60 own-rooted olive plants (Olea europaeaL., cv. “Coratina”) subjected to an induced water stress. Olive plants were grown uniformly outdoors in 0.016 m3pots con-taining loamy sand (73.2% sand, 13.3% silt and 13.5% clay). Drought stress levels were defined on the basis of the values of leaf water potential (9w)measured pre-dawn using a
pres-sure chamber (PMS Instrument Co. Corvallis, OR, USA), according to Turner (1981). The effects of different levels of soil water deficit on gas exchange, photosynthetic efficiency, photoinhibition, osmotic adjustment, cell wall properties, an-tioxidant enzymes activity and markers of oxidative stress were studied.
Pots were covered with plastic film and aluminium foil in order to avoid evaporation from the soil surface and to min-imize temperature increase inside the containers. All plants were weighed each evening in order to calculate the amount of water transpired. A limited number of plants were used as a non-stressed control maintaining the soil water content at about 85% of soil water holding capacity and providing, ev-ery evening, the amount of water lost through transpiration during the day. Drought-stressed olive plants were subjected to a drought period of 22 days applying a gradual and con-trolled water reduction for ten days and after which irrigation ceased. Once the maximum level of drought stress had been reached, all plants were rewatered to recreate optimal soil water conditions.
The measurements of gas exchange were carried out using the portable photosynthesis system LCA-4 (ADC, UK) oper-ated at 200µmol m−2s−1flow rate, under natural tempera-ture, relative humidity and full sunlight conditions (at 09:00– 10:00). Chlorophyll-afluorescence from photosystem II was recorded at 650 nm by using the time-resolving portable flu-orimeter (Plant Efficiency Analyser, PEA, Hansatech Instru-ment Ltd., UK).
et al. (2004a). Finally, proline and malondialdehyde contents were determined by colorimetric reactions followed spectro-fotometrically (Bates et al., 1973; Du and Bramlage, 1992). 2.2 Description of the second experiment
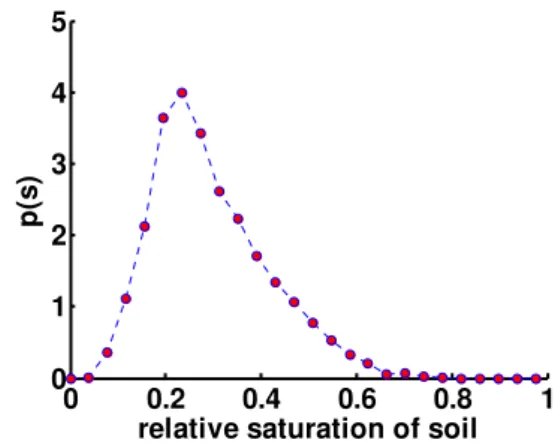
The second study site was located at Lavello (Southern Italy, Basilicata region – N 41◦03′, E 15◦42′), a semi-arid area with average annual rainfall of 670 mm concentrated in the October–February period and monthly average temperatures ranging from 5.7 to 24.1◦C. This experimental site is charac-terised by intense and frequent dry conditions as one may observe from the probability density function of the rela-tive saturation of soil,s(given by the ratio between the soil water content,θ, and the soil porosity, n), obtained via nu-merical simulation (Fig. 1). Nunu-merical analyses were per-formed adopting the simulation scheme for soil water bal-ance proposed by Rodr´ıguez-Iturbe et al. (1999) adopting recorded rainfall and evapotranspiration data over a period of 40 years in order to account for the seasonal fluctuations of the climatic forcing. The distribution refers to the study area adopted in the field experiment and looks like a gamma distribution (e.g., Isham et al., 2005). The probability distri-bution displays dry conditions (s≤0.3–0.4) with a high fre-quency and also an elevated dispersion mainly due to the sea-sonal fluctuations of rainfall and temperatures.
In this experiment, the relationships between canopy and roots were examined on own-rooted olive plants, cv. Coratina, planted in 1992 at distances of 6×3 m, regularly pruned and monitored throughout a period of seven years af-ter planting. During this period, irrigation was suspended in part of the plot (the plants were watered only by rain), whereas the rest was irrigated using a localized system (mi-crojets discharging 80 L h−1over a 1 m-radius). The soil was a sandy loam (53.3% sand, 29.0% silt and 17.7% clay).
In the first year, roots were extracted from the whole vol-ume of soil explored, while in the following years, the total soil volume explored by the roots was divided into 30 cm lay-ers using the trench method (B¨ohm, 1979). Roots were sepa-rated from the soil using sieves of 2 and 5 mm mesh. The dry weight of each plant part (fruits, leaves, shoots, trunk, stump and roots) was measured after drying plant tissues at 80◦C for 24 h.
3 Tolerance strategies against drought stress
3.1 Gas exchange and fluorescence measurements
Morphological and anatomical features such as microphyllia, the thick leaf cuticle with large amounts of waxy substances, the hairiness of the leaf abaxial surface and the high specific weight of the leaves (sclerophylly) are means developed by olive plants to reduce water loss. Transpiration rates in olive are higher than in most other fruit tree species under both well-watered and drought conditions, and the various tissues
0 0.2 0.4 0.6 0.8 1
0 1 2 3 4 5
relative saturation of soil
p(s
)
Fig. 1.Probability density function of the relative saturation of soil obtained simulating the soil water balance over 40 years in Lavello, a Mediterranean area of Southern Italy (soil characteristics are the following: porosityn=0.44, field capacityθc=0.38, saturated
con-ductivityKs=8.6 cm/day).
can withstand very negative values of water potential (Xiloy-annis et al., 2003).
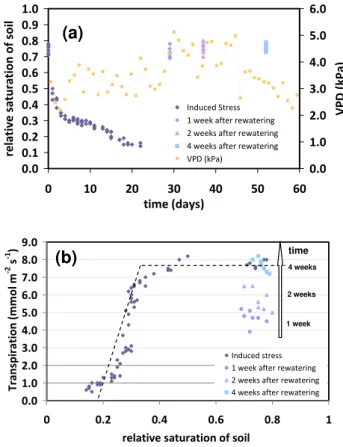
The first experiment, carried out on two-year old plants, was aimed to investigate on the effects of drought stress on plant transpiration and photosynthesis. The measured rela-tive saturation of soil in drought-stressed plants during the first experiment is described in Fig. 2a, where the drying phase lasted 22 days and there after soil water content was kept fairly constant for one month. During this experiment, the transpiration was monitored and showed an interesting behaviour when compared with the trend of relative soil sat-uration (Fig. 2b). In particular, transpiration occured at the maximum rate as long as soil moisture was sufficient to per-mit the normal course of plant physiological processes but, when relative soil saturation became lower than 0.35, the transpiration was inhibited and it decreased almost linearly with the soil water content.
In normal conditions, plant transpiration can be computed as a function of relative soil saturation following the expres-sion (e.g., Laio et al., 2001)
E(s)=
Emaxs−sw
s∗−s
w sw≤s≤s ∗
Emax s∗≤s≤1
(1) whereEmaxis the maximum rate of transpiration that during the experiment was fairly constant (see VPD – Vapor Pres-sure Deficit in Fig. 2a),s∗ is the relative soil saturation at the initial stomata closure andsw correspond to the relative
0.0 0.1 0.2 0.3 0.4 0.5 0.6 0.7 0.8 0.9 1.0
0 10 20 30 40 50 60
time (days)
re
lative
saturation
of
soi
l
0.0 1.0 2.0 3.0 4.0 5.0 6.0
VPD
(kP
a
)
Induced Stress 1 week after rewatering 2 weeks after rewatering 4 weeks after rewatering VPD (kPa)
0.0 1.0 2.0 3.0 4.0 5.0 6.0 7.0 8.0 9.0
0 0.2 0.4 0.6 0.8 1
relative saturation of soil
Transpiration
(mm
o
l
m
‐
2 s
‐
1 )
Induced stress 1 week after rewatering 2 weeks after rewatering 4 weeks after rewatering
(a)
(b)
time4 weeks
2 weeks
1 week
Fig. 2. (a)Measurements of soil saturation during an experiment where olive plants were driven toward drought-stressed conditions and watered afterwards. (b)Measured transpiration as a function of the relative saturation of soil. The dashed line describes the loss function introduced by Laio et al. (2001).
Eq. (1) should be applied accounting for this reduction in the actual transpiration rate. This mechanism would become par-ticularly interesting under natural condition where soil wa-tering (rainfall) is a stochastic process in time. The plant, according to the results given above, may use more parsi-moniously the soil water resource in order to face prolonged periods of drought. Of course this assumption needs to be confirmed designing a dedicated experiment where the rewa-tering occurs randomly in time.
Reduction of soil water content from a relative soil sat-uration of 0.7 to approximately 0.4 induced in olive plants a slight drop in pre-dawn leaf water potential (9w)(from
−0.5 to −0.9 MPa). At this value, daily transpiration per unit of leaf area is reduced by about 55% while photosyn-thesis decreases approximately of 30% if compared to well-irrigated plants (Fig. 3). However, unlike in other species, leaves continue to function even at9w of−6.0 MPa. In dry
condition, olive leaves can use for transpiration about 60% of their water reserves without irreversible damage. This water contributes to sustain the demands of transpiration as stress increases, up to extreme values of the leaf water potential of
−7.0 MPa, when relative water content of the plant reaches
Fig. 3. Trends of net photosynthesis (a) and transpiration (b)
in drought-stressed (continuous lines) and irrigated (dashed lines) during a drought stress period. Each value represents the mean of three measurements (±SE) from three plants having a similar value of dawn leaf water potential. The mean values of pre-dawn leaf water potential for drought-stressed plants are the follow-ing: 0 days=−0.4 MPa, 4 days=−1.0 MPa, 8 days=−1.7 MPa, 12 days=−3.1 MPa, 16 days=−4.2 MPa and 20 days=−5.8 MPa.
40%. This value is considerable if compared to that of other fruit species such as kiwifruit, which uses for transpiration a limited amount of water (about 9%) from its reserves under conditions of severe water deficit (Nuzzo et al., 1997).
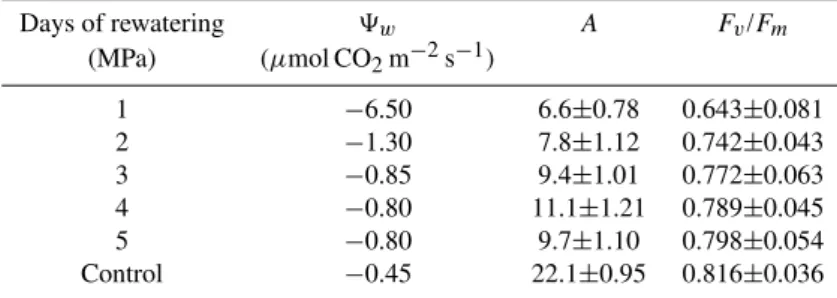
During the first days of recovery following a drought phase, olive plants recover only partially leaf water poten-tial but recover completely the maximum photosynthetic efficiency calculated as Fv/Fm, where Fv is the variable
fluorescence and Fm maximal fluorescence measured on
dark-adapted leaves by means of a leaf chamber fluorom-eter (Table 1). The analysis of fluorescence relaxation curves allowed to calculate the value of slowly relaxing non-photochemical quenching (NPQS), which indicates a
dam-age of photosynthetic reaction centres and thus measures the degree photoinhibition, the damage to the light-harvesting reactions of the photosynthetic apparatus caused by excess light energy trapped by chloroplasts. Photoinhibition is thus the cause of the non-stomatal limitation to photosynthesis. Results show that NPQS increased with increasing drought
well-Table 1. Trends of pre-dawn leaf water potential (9w), net photosynthetic rate (A)and maximum efficiency of photosystem II (Fv/Fm)
during the rewatering of severely stressed plants. Each value represents the mean of three measurements (±SE) from three plants having a similar value of pre-dawn leaf water potential.
Days of rewatering 9w A Fv/Fm
(MPa) (µmol CO2m−2s−1)
1 −6.50 6.6±0.78 0.643±0.081
2 −1.30 7.8±1.12 0.742±0.043
3 −0.85 9.4±1.01 0.772±0.063
4 −0.80 11.1±1.21 0.789±0.045
5 −0.80 9.7±1.10 0.798±0.054
Control −0.45 22.1±0.95 0.816±0.036
watered plants and their complete recovery occurs after four weeks of rewatering (Fig. 2b). A similar inhibition during the first days of rewatering was also observed for photosyn-thetic rates (Table 1). It is important to note that in olive plants the extent of gas exchange inhibition is related to the level of drought stress previously experienced by plants (An-gelopoulous et al., 1996). These persisting deficits in leaf gas exchange are not due to the non-recovery of cell turgor but to other factors probably involving the hormonal and biochem-ical balance, the efficiency of the conducting system and the water absorption capacity of roots.
3.2 Osmotic adjustment and cell wall properties
Another important mechanism adopted by the olive tree to face water deficit is osmotic adjustment. This physiological process is due to the accumulation of osmotically active com-pounds (osmolytes such as: carbohydrates, some aminoacids and derivates, organic and inorganic acids, cations and an-ions) in plant cells, measured by the variation in osmotic potential (19π). A higher concentration of osmolytes
fa-cilitates water diffusion in cells and maintains the turgor of plant tissues. The osmotic adjustment may depend on either active synthesis and accumulation of osmolytes within cells (active osmotic adjustment) or loss of water from plant cells, with the consequent increase in osmolyte concentration (pas-sive osmotic adjustment).
In the first experiment, leaf osmotic potential (9π)
at full turgor decreased from −2.06±0.01 MPa to
−2.81±0.03 MPa in olive plants subjected to a severe drought stress. Under this condition, the olive tree uses active and passive19π not only in leaves, but also in roots
increasing its ability to extract water from dry soil. In fact, an active 19π of 1.42 MPa was observed in roots having
a 1–4 mm-diameter. This physiological response reduces osmotic potential (9π), so allowing a favourable soil-plant
water gradient which enables plants to extract water from soil at low values of soil water potential and to maintain gas exchange, growth and productivity (Xiloyannis et al., 1988). The passive concentration of solutes within cells was found
to be the most important mechanism to maintain cellular turgor. In fact, the contribution of passive19π represents
approximately 60% of the total osmotic adjustment, while the remaining 40% is due to active19π(Table 3).
The ex-novo synthesis of osmolytes takes place in both leaves and roots of the olive tree and regards mainly car-bohydrates and the aminoacid proline (Cataldi et al., 2000). Extracts of leaves and roots of well-watered olive revealed that the most predominant carbohydrates are mannitol and glucose, which account for more than 80% of the total sol-uble carbohydrates. At a9w of−6.0 MPa, in olive tissues
mannitol increased of about 97% and it was about 15% more concentrated than glucose. Moreover, it was found that the contribution to total19π in severe-stressed plants made by
glucose and mannitol combined was about−0.32 MPa and an increase in malic acid concentration also occurred. The levels of glucose, sucrose and stachyose decreased in thin roots at all the levels of water deficit, whereas medium roots exhibited no differences in the levels of these carbohydrates. Inorganic cations in olive leaves remained almost unchanged during the period of drought stress, except for the amount of Ca2+which increased of 25% in water-stressed plants. The amount of organic acids such as malate increased both in leaves and roots during the dry period, whereas citrate and oxalate decreased. In olive plants, a rapid increase of pro-line at9wlower than−3.0 MPa was observed both in leaves
and roots. In particular, proline level in olive leaves reached 1.59±0.03µmol mg−1DW at severe water deficit, so giving a considerable contribute to the decrease in9π. The results
support the hypothesis that the observed decreases in9πand
the consequent osmotic adjustment in leaves and roots of drought-stressed plants were mainly due to the accumulation of mannitol, Ca2+, malate and proline within cells. Finally, the maintenance of negative values of19π also during the
rewatering phase suggests that this can be a strategy for this species to withstand other possible periods characterized by water deficit.
Table 2.Slowly relaxing non-photochemical quenching (NPQS)in leaves of drought-stressed and control olive plants during the
experimen-tal period. Each value represents the mean of three measurements (±SE) from three plants having a similar value of pre-dawn leaf water potential (9w).
NPQS
Beginning of drought Maximum level of drought End of rewatering (9w=−0.45 MPa) (9w=−6.50 MPa) (9w=−0.45 MPa)
Drought-stressed 0.42±0.02 0.58±0.04 0.45±0.08 Control (9w=−0.45 MPa) 0.41±0.02 0.42±0.02 0.42±0.03
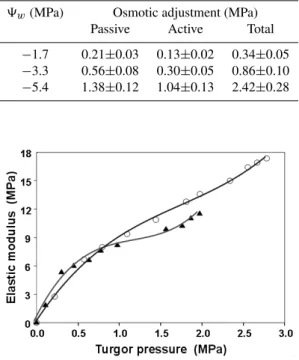
Table 3. Passive, active and total osmotic adjustment measured predawn in leaves of drought-stressed olive plants. Each value rep-resents the mean of three measurements (±SE) from three plants having a similar value of pre-dawn leaf water potential (9w).
9w(MPa) Osmotic adjustment (MPa)
Passive Active Total
−1.7 0.21±0.03 0.13±0.02 0.34±0.05
−3.3 0.56±0.08 0.30±0.05 0.86±0.10
−5.4 1.38±0.12 1.04±0.13 2.42±0.28
Fig. 4. Relationship between the bulk elastic modulus and turgor potential shown by representative leaves for well-watered (N) and drought-stressed (pre-dawn leaf water potential=−5.2 MPa) () olive plants.
the composition and structure of the cell wall, the rigid out-ermost cell layer found in plant cells. An increase in elastic modulus (ε)is expected when cell walls become more rigid or thicker, and higher values of elastic modulus produces a faster turgor loss of cells for a given percentage of dehydra-tion.
As drought-stress increases, the maximum elastic mod-ulus in olive leaf tissues rose from 11.6±0.95 MPa to 18.6±0.61 MPa (Fig. 4). This suggests that a drought-stressed olive tree activates metabolic processes to produce
substances that increase cell tissue rigidity, likely by regu-lating some enzymes involved in lignin biosynthesis such as peroxidases (Sofo et al., 2004a). High values of elastic mod-ulus, together with low values of9π can be responsible for
the observed high gradients of water potential between leaves and soil and thus can facilitate water extraction from the soil.
3.3 Regulation of antioxidant enzymes and markers of ox-idative stress
Drought stress is often associated with increased cellular levels of activated oxygen species (AOS), such as superox-ide anion (O.2−), hydrogen peroxide (H2O2), hydroxyl rad-ical (HO.)and singlet oxygen (1O2). AOS are very reac-tive chemical compounds able to oxidize and damage cells and for this reason plants can increase the activity of antiox-idant enzymes (such as: ascorbate peroxidase, catalase, su-peroxide dismutase, peroxidase, and polyphenol oxidase) to remove them (see Smirnoff, 1993).
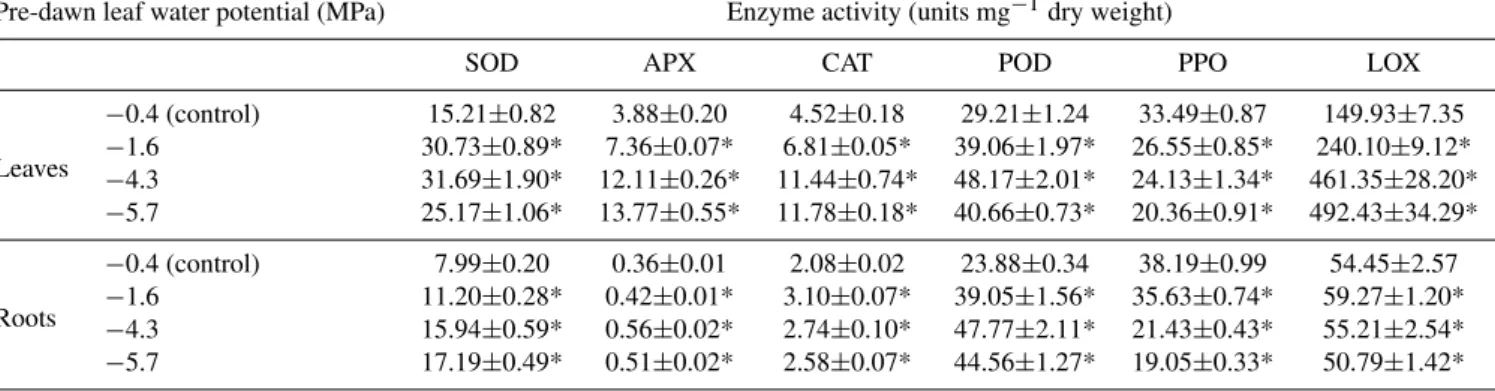
Table 4. Activities of superoxide dismutase (SOD), ascorbate peroxidase (APX), catalase (CAT), guaiacol peroxidase (POD), polyphenol oxidase (PPO) and lipoxygenase (LOX) in leaves and roots of drought-stressed and well-watered control olive plants. Each value represents the mean of three measurements (±SE) from three plants having a similar value of pre-dawn leaf water potential (9w). Stars refer to
differences between well-watered and drought-stressed plants atP=0.05.
Pre-dawn leaf water potential (MPa) Enzyme activity (units mg−1dry weight)
SOD APX CAT POD PPO LOX
Leaves
−0.4 (control) 15.21±0.82 3.88±0.20 4.52±0.18 29.21±1.24 33.49±0.87 149.93±7.35
−1.6 30.73±0.89* 7.36±0.07* 6.81±0.05* 39.06±1.97* 26.55±0.85* 240.10±9.12*
−4.3 31.69±1.90* 12.11±0.26* 11.44±0.74* 48.17±2.01* 24.13±1.34* 461.35±28.20*
−5.7 25.17±1.06* 13.77±0.55* 11.78±0.18* 40.66±0.73* 20.36±0.91* 492.43±34.29*
Roots
−0.4 (control) 7.99±0.20 0.36±0.01 2.08±0.02 23.88±0.34 38.19±0.99 54.45±2.57
−1.6 11.20±0.28* 0.42±0.01* 3.10±0.07* 39.05±1.56* 35.63±0.74* 59.27±1.20*
−4.3 15.94±0.59* 0.56±0.02* 2.74±0.10* 47.77±2.11* 21.43±0.43* 55.21±2.54*
−5.7 17.19±0.49* 0.51±0.02* 2.58±0.07* 44.56±1.27* 19.05±0.33* 50.79±1.42*
Significant increases of lipoxygenase (LOX) activity and malondialdehyde (MDA) content, two markers of oxidative stress, were also observed during the progressive incre-ment of drought stress in both leaf and root tissues of olive plants. The observed increases in malondialdehyde levels and lipoxygenase activity suggest that the water deficit is as-sociated with the oxidation of membrane lipids caused by activated oxygen species and with the damage of photosyn-thetic apparatus.
During a rewatering treatment following a drought pe-riod, the activities of antioxidant enzymes and the levels of malondialdehyde decreased in both leaves and roots, while polyphenol oxidase activity increased.
3.4 Growth parameters
The second experiment, carried out in field, highlighted the different growth rates of olive tree’s organs between drought-stressed and well-watered plants. It was found that non-irrigated olive plants have higher values of root dry weight/leaf area ratio, volume of explored soil/leaf area ra-tio, and therefore have greater water availability per unit of leaf area (Celano et al., 1999; Palese et al., 2000).
The results showed that lower soil water availability deter-mines a greater growth reduction in the above-ground organs than in the under-ground organs (roots and stump) (Fig. 5). At the seventh year after planting, the under/above-ground ratio in non-irrigated trees was 0.81 in comparison to 0.72 in irrigated ones. This reduction involved all the epigean or-gans but was particularly marked in leaf dry weight which at the seventh year was 47% lower in non-irrigated plants. The greater decrease in canopy growth with respect to root growth in drought conditions is a mechanism which im-proves water availability per unit of leaf area, enabling plants to resist long water deficit periods while keeping the leaves
Fig. 5. Dry matter ratio between under- and above-ground tree parts in irrigated (solid line) and drought-stressed (dotted line) olive plants.
photosynthetically active. Root system of drought-stressed olive plants was deeper (up to 1.5 m) if compared to well-watered plants, while root density remains similar in the two conditions (about 0.020 m m−3 of soil). This data demon-strate the positive effect of water availability on the growth of both canopy and roots, and the ability of the olive tree to explore the deeper soil layers when grown under water deficit.
4 Conclusions and final remarks
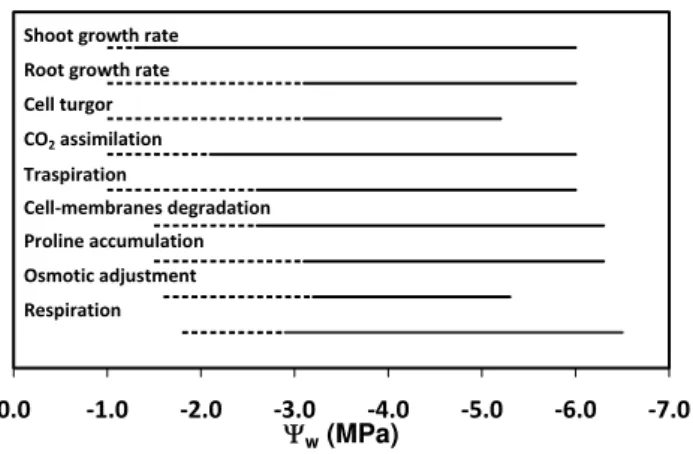
‐7.0
‐6.0
‐5.0
‐4.0
‐3.0
‐2.0
‐1.0 0.0
Ψw (MPa)
Shoot growth rate Root growth rate Cell turgor CO2 assimilation Traspiration
Cell‐membranes degradation Proline accumulation
Osmotic adjustment Respiration
Fig. 6.Effects of the decrease in pre-dawn leaf water potential (9w)
on physiological processes of olive plants. Dashed lines describe the9wintervals where physiological processes are partially
inhib-ited or induced, while continuous lines describe the intervals where those processes are strongly affected by drought stress.
The first effect of the decrease in9wis a reduction in cell
turgor and gas exchange. If compared to a mean response of a plant to drought stress (Hsiao, 1973), the olive tree is able to maintain cell turgor at much lower9wvalues. This is
likely due to the stiffness of cell walls related to the high val-ues of elastic modulus, that increase with drought intensity, and to the reduced water losses from cells. The inhibition of photosynthesis begins very soon and is accompanied by a decrease in transpiration. This suggests that, in olive plants subjected to water deficit, photochemical processes are af-fected not only by photoinhibition and photo-oxidation but stomatal factors are also involved. Moreover, shoot growth rate seems to be more sensitive to the decrease in9wif
com-pared to root growth rate and this can be the cause of the higher root/shoot ratio of drought-stressed plants (Fig. 5). At values of9w below−1.5 MPa, when gas exchange and
growth rates are inhibited, the degradation of cell membranes due to lipid peroxidation takes place.
The regulation of stomata closure is one of the first effects of drought stress on olive tree’s physiology and it is gradual with the decrease of9w. The stomata closure starts to be
more relevant for values of9w below−2.5 MPa and at this
point it is followed by a strong decrease in cell turgor (Fig. 6). For values of9w below−3.2 MPa, the osmotic adjustment
due the accumulation of proline, carbohydrates and other os-molytes is completely active and allows the conservation of water in olive tissues. Soon after, respiration is partially re-duced by disturbances in cell metabolism.
The patterns described in Fig. 6 and the comparisons with other Mediterranean plant species (Lo Gullo and Salleo, 1988) give evidence for a high degree of tolerance of the olive tree against water deficit and a concerted and gradual series of adaptation mechanisms against this abiotic stress. The analyses here discussed may be useful to better un-derstand the physiological mechanisms adopted by a model
plant for water stress tolerance in a Mediterranean ecosys-tem.
Acknowledgements. S. M. acknowledges the support of the CARICAL foundation for his research activities. This research was financed by the projects BRIMET (P.O.N. – Metodologie e sistemi integrati per la valorizzazione di prodotti ortofrutticoli di partico-lare interesse degli areali di Brindisi e Metaponto) and OLIVERO (European Union Research Project QLK5 CT-2002-01841).
Edited by: V. Iacobellis
References
Angelopoulos, K., Dichio, B., and Xiloyannis, C.: Inhibition of photosynthesis in olive trees (Olea europaeaL.) during water stress and rewatering, J. Exp. Bot., 47(301), 1093–1100, 1996. Bacelar, E. A., Santos, D. L., Moutinho-Pereira, J. M., Lopes, J. I.,
Gonc¸alves, B. C., Ferreira, T. C., and Correia, C. M.: Physiolog-ical behaviour, oxidative damage and antioxidative protection of olive trees grown under different irrigation regimes, Plant Soil, 292, 1–12, 2007.
Bates, L. S., Waldren, R. P., and Teare, I. K.: Rapid determination of free proline for water stress studies, Plant Soil, 39,: 205–208, 1973.
Bohm, W.: Methods of studying root systems, in: Ecological Stud-ies, Vol. 33, edited by: Bellings, W. D., Galleg, F., Lange, O. L., and Olson, J. S., Springer Verlag New York, 116–117, 1979. Bolle, H. J.: Mediterranean Climate: Variability and Trends,
Springer, New York, 320 pp., 2003.
Cataldi, T. R., Margiotta, G., Iasi, L., Dichio, B., Xiloyannis, C., and Bufo, S. A.: Determination of sugar compounds in olive plant extracts by anion-exchange chromatography with pulsed amperometric detection, Anal. Chem., 72, 3902–3907, 2000. Celano, G., Dichio, B., Montanaro, G., Nuzzo, V., Palese, A. M.,
and Xiloyannis, C.: Distribution of dry matter and amount of mineral elements in irrigated and non-irrigated olive trees, Acta Horticulturae, 474, 381–384, 1999.
Chartzoulakis, K., Patakas, A., and Bosabalidis, A. M.: Changes in water relations, photosynthesis and leaf anatomy induced by intermittent drought in two olive cultivars, Environ. Exp. Bot., 42, 113–120, 1999.
Connor, D. J. and Fereres, E.: The physiology of adaptation and yield expression in olive, Hortic. Rev., 31, 155–229, 2005. Dichio, B., Xiloyannis, C., Sofo, A., and Montanaro, G.: Osmotic
adjustment in leaves and roots of olive tree (Olea europaeaL.) during drought stress and rewatering, Tree Physiol., 26, 179–185, 2006
Du, D. and Bramlage, W. J.: Modified thiobarbituric acid assay for measuring lipid oxidation in sugar-rich plant tissue extracts, J. Agric. Food Chem., 40, 1566–1570, 1992.
Favia, F. and Celano, G.: I sistemi olivicoli in terreni collinari e montani: Basilicata e Campania, in: Il futuro dei sistemi olivi-coli in aree marginali: aspetti socio-economici, conservazione delle risorse naturali e produzioni di qualit`a, L’Aquilone, 123– 158, 2005.
Fiorentino, M., Carriero, D., Iacobellis, V., Manfreda, S., and Por-toghese, I.: MEDCLUB – starting line and first activities, in: Predictions in Ungauged Basins: Promises and Progress, edited by: Sivapalan, M., Wagener, T., Uhlenbrook, S., Zehe, E., Lak-shmi, V., Liang, X., Tachikawa, Y., and Kumar, P., IAHS Publ., 303, 2006.
Girma, F. S., Krieg, D. R.: Osmotic adjustment in Sorghum. I. Mechanisms of diurnal osmotic potential changes, Plant Physiol, 99, 577–582, 1992.
Hsiao, T. C.: Plant responses to water stress, Ann. Rev. Plant Phys-iol., 24, 519–570, 1973.
Isham, V., Cox, D. R., Rodr´ıguez-Iturbe, I., Porporato, A., and Man-freda, S.: Representation of Space-Time Variability of Soil Mois-ture, Proceedings of the Royal Society A: Mathematical, Phys. Eng. Sci., 461, 4035–4055, doi:10.1098/rspa.2005.1568, 2005. Laio, F., Porporato, A., Ridolfi, L., and Rodr´ıguez-Iturbe, I.: Plants
in water controlled ecosystems: Active role in hydrological pro-cesses and response to water stress, II. Probabilistic soil moisture dynamics, Adv. Water Res., 24, 707–723, 2001.
Lo Gullo, M. A. and Salleo, S.: Different strategies of drought re-sistance in three Mediterranean schlerophyllous trees growing in the same environmental conditions, New Phytol., 108, 267–276, 1988.
Loumou, A. and Giourga, C.: Olive groves: The life and identity of the Mediterranean, Agricu. Hum. Values, 20, 87–95, 2003. Moreno, F., Fern´andez, J. E., Clothier, B. E., and Green, S. R.:
Transpiration and root water uptake by olive trees, Plant Soil, 184, 85–96, 1996.
Nogu´es, S. and Baker, N. R.: Effects of drought on photosynthesis in Mediterranean plants grown under enhanced UV-B radiation, J. Exp., 51, 1309–1317, 2000.
Nuzzo, V., Dichio, B., Xiloyannis, C., Piccotino, D., and Massai, R.: Contribution to transpiration of different tissues of kiwifruit vines from their water reserves, Acta Horticulturae, 444, 329– 334, 1997.
Palese, A. M., Nuzzo, V., Dichio, B., Celano, G., Romano, M., and Xiloyannis, C.: The influence of soil water content on root density in young olive trees, Acta Horticulturae, 537, 329–336, 2000.
Rodr´ıguez-Iturbe, I., Porporato, A., Ridolfi, L., Isham, V., and Cox, D. R.: Probabilistic modelling of water balance at a point: The role of climate, soil and vegetation, Proceedings of the Royal So-ciety A: Mathematical, Phys. Eng. Sci., 455, 3789–3805, 1999. Smirnoff, N.: The role of active oxygen in the response to water
deficit and desiccation, New Phytol., 125, 27–58, 1993. Sofo, A., Dichio, B., Xiloyannis, C., and Masia, A.: Effects of
dif-ferent irradiance levels on some antioxidant enzymes and on mal-ondialdehyde content during rewatering in olive tree, Plant Sci., 166, 293–302, 2004a.
Sofo, A., Dichio, B., Xiloyannis, C., and Masia, A.: Lipoxygenase activity and proline accumulation in leaves and roots of olive tree in response to drought stress, Physiol. Plant., 121, 58–65, 2004b. Teuling, A. J., Uijlenhoet, R., and Troch, P.A.: On bimodality in warm season soil moisture observations, Geophys. Res. Lett., 32(5), L05404, doi:10.1029/2005GL023223, 2005.
Tognetti, R., D’Andria, R., Morelli, G., Calandrelli, D., and Frag-nito, F.: Irrigation effects on daily and seasonal variations of trunk sap flow and leaf water relations in olive trees, Plant Soil, 263, 249–264, 2004.
Tombesi, A., Proietti, P., and Nottiani, G.: Effect of water stress on photosynthesis, transpiration, stomatal resistance and carbo-hydrate level in olive tree, Olea, 17, 35–40, 1986.
Turner, N. C.: Techniques and experimental approaches for the measurement of plant water status, Plant Soil, 58, 339–366, 1981.
Tyree, M. T. and Jarvis, P. G.: Water in tissues and cells, in: En-cyclopedia of Plant Physiology, edited by: Lange, O. L., Nobel, P. S., Osmond, C. B., and Ziegler, H., New Series, Vol. 12B, Springer-Verlag Berlin, 36–71, 1982.
Walters, R. G. and Horton, P.: Resolution of components of non-photochemical chlorophyll fluorescence quenching in bar-ley leaves, Photosynth. Res., 27, 121–133, 1991.
Xiloyannis, C., Pezzarossa, B., Jorba, J., and Angelici, P.: Effects on soil water content on gas exchange in olive trees, Adv. Hortic. Sci., 2, 58–63, 1988.