Original
Received 6/9/2010 Accepted 10/1/2012 (005033)
1 Grupo de Investigación en Ingeniería en Alimentos. Facultad de Ingeniería, Universidad Nacional de Mar del Plata – UNMDP, Av. Juan B. Justo, 4302, 7600, Mar del Plata, Argentina, e-mail: [email protected]
2 Consejo Nacional de Investigaciones Científicas y Técnicas – CONICET, Av. Rivadavia, 1917, C1033AAJ, Buenos Aires, Argentina
3 Secretaría de Ciencia y Tecnología – SECyT, Universidad Nacional de Mar del Plata – UNMDP, Av. Juan B. Justo, 4302, 7600, Mar del Plata, Argentina *Correspondig author
Assessment of lettuce quality during storage at low relative humidity using
Global Stability Index methodology
Avaliação da qualidade da alface durante o armazenamento em baixa umidade relativa usando
o Índice Global da Estabilidade
María Roberta ANSORENA1,2, María Victoria AGÜERO1,2, María Grabriela GOÑI1,2,3, Sara ROURA1,2,
Alejandra PONCE1,2, María del Rosario MOREIRA1,2, Karina DI SCALA1,2*
1 Introduction
The consumption of fresh leafy vegetables, in particular lettuce, has tremendously increased in the last decade as a result of consumer desire for healthy and nutritive food (KAUR, KAPOOR, 2001; GIANNAKOUROU, TAOUKIS, 2003; MARTÍNEZ-SÁNCHEZ et al., 2006; REDIERS et al., 2009). The lettuce head is a morphologically heterogeneous assemblage of leaves that are packed together over the growing point of the plant. Its formation results from the accumulation of young leaves under the layers of the leaves covering the growing point (WIEN, 1997). This spatial arrangement of lettuce constitutes
an interesting natural model that allows evaluating the effect of both tissue development and different degree of leaf exposition to environment. Several studies have demonstrated that leaf distribution affects leaf composition as well as its metabolic activity (SIOMOS et al., 2002; DEL NOBILE et al., 2006; AGÜERO et al., 2008).
Several problems arose during lettuce harvesting, transporting, distribution, processing and storage, mainly due to its high mechanical and physiological fragility (PEREYRA; ROURA; DEL VALLE, 2005). Once harvested, lettuce heads Resumo
Durante a pós-colheita a alface é exposta a condições adversas (baixa umidade relativa) que reduzem a qualidade do vegetal. A fim de avaliar sua vida útil, um grande número de índices de qualidade tem que ser analisado, requerendo um cuidadoso delineamento experimental e um longo consumo de tempo. Neste trabalho, o método modificado do Índice Global da Estabilidade foi aplicado para estimar a qualidade da alface manteiga a uma baixa umidade relativa durante o armazenamento diferenciando três zonas (interna, média e externa). Os resultados indicaram que, para a zona externa, os índices mais relevantes foram o conteúdo da umidade relativa , conteúdo da água, ácido ascórbico e a contagem total de micro-organismos mesófilos. Para a zona média, foram conteúdo da umidade relativa, conteúdo da água, clorofila total, ácido ascórbico e, para a interna, conteúdo da umidade relativa, água ligada, conteúdo da água e a contagem total de micro-organismos mesófilos. Foi proposto um modelo matemático entre o Índice Global da Estabilidade e qualidade visual geral para cada zona da alface. Ademais, foi aplicada a distribuição de Weibull para estimar o tempo da vida útil do vegetal, o qual foi: 5, 4 e 3 dias para as zonas interna, média e externa, respectivamente. Quando foi estudado o efeito do tempo de armazenamento para cada zona da alface, todos os índices avaliados na zona externa mostraram diferenças significativas (p < 0,05). Para as zonas interna e média, todos os índices medidos, com exceção do conteúdo da água e do total de clorofila, mostraram diferenças significativas (p < 0,05).
Palavras-chave: alface; índices de qualidade; vida útil; modelo matemático; distribuição de Weibull. Abstract
During postharvest, lettuce is usually exposed to adverse conditions (e.g. low relative humidity) that reduce the vegetable quality. In order to evaluate its shelf life, a great number of quality attributes must be analyzed, which requires careful experimental design, and it is time consuming. In this study, the modified Global Stability Index method was applied to estimate the quality of butter lettuce at low relative humidity during storage discriminating three lettuce zones (internal, middle, and external). The results indicated that the most relevant attributes were: the external zone - relative water content, water content , ascorbic acid, and total mesophilic counts; middle zone - relative water content , water content, total chlorophyll , and ascorbic acid; internal zone - relative water content, bound water, water content, and total mesophilic counts. A mathematical model that takes into account the Global Stability Index and overall visual quality for each lettuce zone was proposed. Moreover, the Weibull distribution was applied to estimate the maximum vegetable storage time which was 5, 4, and 3 days for the internal, middle, and external zone, respectively. When analyzing the effect of storage time for each lettuce zone, all the indices evaluated in the external zone of lettuce presented significant differences (p < 0.05). For both, internal and middle zones, the attributes presented significant differences (p < 0.05), except for water content and total chlorophyll.
Keywords: butter lettuce; quality indices; shelf life; mathematical modeling; weibull distribution.
Sampling times were: 0, 1, 2, 3, 4, and 5 days. On each sampling day, eight plants were taken from the storage chamber. Two of them were used to assess water plant status, two to determine chlorophyll and ascorbic acid content, two to estimate total microbial counts, and the rest to analyze sensorial quality. All parameters analyzed were measured in three different zones of the complete lettuce head, called external (outer leaves), middle (mid leaves) and internal (inner leaves) zones. The morphological and physiological characteristics of each zone are clearly defined: external (older, mature and green leaves), internal (younger, immature and yellow leaves) and mid leaves with intermediate characteristics. For each lettuce plant, the zones were delimited visually according to the study of Agüero et al. (2008). Each zone had an average of 6 to 9 leaves. All measurements were done in triplicate.
2.2 Quality indices
Water status indices
Water status in lettuces was determined through the following indices: Water Content (WC), Relative Water Content (RWC), Free Water (FW), Bound Water (BW) and the relationship between FW, and Total Water (FW/TW). Water status indices were calculated for all leaves of each zone of the plant. More details of these indices determination can be found in the study of Ansorena et al. (2009). Values of fresh mass (FM), turgid mass (TM), and dried mass (DM) were used to calculate RWC using Equation 1 (ESPARZA-RIVERA et al., 2006):
( )% FM DM 100
RWC
TM DM
−
= ×
− (1)
To determine WC, FM and DM were used using Equation 2:
( )% FM DM 100
WC
FM
−
= × (2)
Total water in leaf tissues is made up of two components, namely free solvent water and bound water. These data were acquired following the methodology described by Singh, Pallaghy and Singh (2006). The values from fresh mass (FM), air-dried (AD), and oven-dried (DM) weights were then used to calculate Total leaf tissue Water (TW), Free Water (FW), and Bound Water (BW) per unit dry mass using Equations 3, 4 and 5:
FM DM
TW DM
−
= (3)
AD DM
BW DM
−
= (4)
FW=TW−BW (5)
The Free Water to Total Water (FW/TW) ratio was calculated applying Equations 5 and 3. FW, BW, and TW were expressed as gram of water per unit of leaf dry mass (g.g–1).
Total Chlorophyll Content (TCC)
The chlorophyll content of each zone was determined following the methodology described by Moreira, Roura and are usually exposed to uncontrolled humidity conditions that
are far from the recommended ones to maintain the optimal product quality. Under those abusive conditions (e.g. low relative humidity), the main cause of lettuce deterioration is water loss, which causes cell wall degradation and affects quality attributes, such as texture, turgidity, and colour producing detrimental structural changes as well as enzymatic browning during postharvest storage (ALZAMORA et al., 2000). Moreover, microorganisms can proliferate when associated with inadequate handling and transportation practices (BAUR et al., 2005; MOREIRA et al., 2006; REDIERS et al., 2009). Associated with these quality changes, several quality indices which characterize physico-chemical, nutritional, microbiological, and sensory quality of lettuce were proposed (KADER, 2002). Among them, several water status indices, (BURDON, CLARK, 2001; EITEL et al., 2006; AGÜERO et al., 2008), ascorbic acid (GIANNAKOUROU, TAOUKIS, 2003; ROURA et al., 2003; ESPARZA-RIVERA et al., 2006; MOREIRA et al., 2006), chlorophyll content (FRANCIS, CLYDESDALE, 1975; YAMUCHI, WATADA, 1991; SHIOI et al., 1996), and total microbial counts, were measured (PONCE et al., 2002; MOREIRA et al., 2006; PONCE et al., 2008). In order to overcome the problem of dealing with an important amount of experimental data, ANSORENA et al. (2009) proposed a modified Global Stability Index (GSI) method, which enabled to quantify lettuce quality stability by simultaneously accounting of the most relevant quality indices when high relative humidity and optimal temperature were used as storage conditions. Along with the GSI approach, the use of mathematical modeling is an interesting tool to predict shelf life. In this sense, the Weibull model has been successfully applied in food processing (PELEG; PENCHINA; COLE, 2001; BUZRUL, ALPAS, 2007; VEGA-GÁLVEZ et al., 2009).
Therefore, the aim of this study was to apply the modified GSI method to single out the set of quality indices for each lettuce zone that best represent the loss of quality during the shelf life of butter lettuce stored at low relative humidity and to compare the quality stability of the product with that reported in a previous study, in which the lettuce was stored at high relative humidity conditions (ANSORENA et al., 2009). In adittion, the Weibull distribution was applied to determine the shelf life of lettuce based on the GSI predictions.
2 Material and methods
2.1 Plant material and sample preparation
1
1 n
j i ij i
GSI αV
=
= −
∑
(6)0
0
( )
( )
ij i ij
i i
C C
V
L C
− =
− (7)
where j is the unit of storage time for which Vij have been defined, Vij is the variation term and αi is the weighing factor reflecting the relative importance of the index i in terms of describing the quality of the product, Cij is the measured value of the index i at time j, Ci0 is the initial value of the index i when time is equal to 0, and Li is the threshold value of the index i. Therefore, Vij describes the reported variation of the index as compared to the maximum tolerated variation.
In order to determine the threshold value for each index as a function of lettuce zone, all physical, nutritional, greenness and microbiological indices were correlated with overall visual quality using a linear model as described in the study of Ansorena et al. (2009). The threshold value for each index resulted from that corresponding to the limit of acceptability for a value of OVQ equal to 5 (KADER; LIPTON; MORRIS, 1973).
In the present study and following the modified GSI methodology, all indices were combined into groups of four (a tetrad) resulting in a total of 35 tetrads for each plant zone. To set the weighing factors (α) for each index within the tetrad, a correlation analyses between GSI profiles and overall visual quality was carried out through Pearson’s coefficients evaluation, which were obtained using SYSTAT 5.0 (SYSTAT, 1992), according to the methodology suggested by Ansorena et al. (2009).
GSI varies between zero and one. If the index is closer to the unity, the product maintains its initial quality, and if it approaches zero, the quality of the product is diminished (ACHOUR, 2006).
2.4 The normalized Weibull distribution
The Weibull distribution has been applied to model lifetime data in medical, biological and engineering sciences (KHAN et al., 2008). In the present study, the GSI value is the dependent variable in the Weilbull model which can be mathematically expressed as:
exp t
GSI
γ
β
= −
(8)
where β is the scale parameter of the Weibull model (/time), γ is the shape parameter (dimensionless), and t is the sampling time. The parameter β can be interpreted as a kinetic reaction constant and represents the time when GSI attains a value corresponding to 36.8% of GSI0. The constant γ represents a behaviour index and for the especial case of γ = 1, the model is reduced to a first order kinetics. When γ > 1, the reaction rate increases with time, and the degradation curve assumes a sigmoidal shape. On the other hand, if γ < 1, the reaction rate decreases with time and degradation rate ishigher than the exponential is observed at the beginning of the process (MARFIL; SANTOS; TELIS, 2008). Del Valle (2003). Leaves of each zone were homogenized
using food processor (Minipimer, Philips HR 1362, China). Samples (1 g each) were taken from each homogenate. Each sample was then homogenized with 19 mL of a cold solution of 18:1 (propanone: ammonium hydroxide, 0.1 N) ratio. This homogenate was filtered through sintered glass and water was removed from the filtrate with anhydrous sodium sulfate. Absorbance of the filtrate at 660.0 and 642.5 nm was measured with a UV 1601 PC UV-visible spectrophotometer (Shimadzu Corporation, Japan). Chlorophyll content was calculated applying the formula, TC = 7.12A660 + 16.8 A642.5 and reported as mg of chlorophyll/g dry weight.
Ascorbic acid content (AA)
To assay the ascorbic acid content, the titrimetric method described by Pelletier (1985) was followed. Ground lettuce leaves (20 g) from each lettuce zone were extracted with 100 mL of metaphosphoric acid solution (60 g.kg–1) for 3 minutes using a
tissue homogenizer (Braun, Kronberg, Germany) at a speed of 3500 to 7000 rpm. The homogenate was made up to 250 mL with 30 g.kg–1 metaphosphoric acid and filtered through Whatman nº
42 filter paper. The temperature during ascorbic acid extraction was maintained in the range of 0-2 °C. Aliquots (5 mL each) of the filtrate were titrated with 2, 6- dichloroindophenol. AA content is reported as mg of AA/100 g dry weight.
Total Microbial Counts (TMC)
Total microorganisms were enumerated using Plate Count Agar (PCA) incubated at 32-35 °C for 48-72 hours (INTERNATIONAL…, 1983). Studies were performed in duplicate. Microbiological counts were expressed as log CFU/g of fresh weight.
Overall Visual Quality (OVQ)
At each storage time, each individual lettuce was subjected to overall visual quality evaluation of each plant zone by a sensory panel. The evaluations were performed immediately after lettuce removal from storage conditions.
A panel, composed of 9 trained judges aged 30 to 55 years old, who are members of the Universidad Nacional de Mar del Plata (UNMdP) Food Engineering Group and have sensory evaluation experience in leafy vegetables, was trained in lettuce quality evaluation. Three-digit coded samples were presented one at the time, in random order, to the judges who made independent judgments. The judges were asked to evaluate OVQ on the basis of leaf characteristics, such as color (shade and uniformity), brightness, texture, and presence or absence of defects. A nine-point scoring scale was used, in which 9 stood for excellent quality and 1 for very poor quality; the limit of acceptance was 5, according to Moreira et al. (2008).
2.3 Determination of Global Stability Index (GSI)
The results reported in Tables 1 and 2 were analyzed using SAS software version 9.0 (SAS INSTITUTE, 2002). A simple linear model was considered to evaluate differences in values along sampling days and between zones. The General linear model procedure (PROC GLM) was used for the analysis of variance (ANOVA). The factors employed as sources of variation were: DAY (storage time, day of sampling: 0, 1, 2, 3, 4, and 5) and
2.5 Data analysis
The parameters of the regression models were obtained using the function lsqcurvefit corresponding to the Optimization toolbox of MATLAB (v7.0 R14, The Mathworks Inc., MA, USA) (MATLAB, 2004). Statistical analysis was carried out using SYSTAT 5.0 (SYSTAT, 1992).
Table 1. Experimental data corresponding to water status indices obtained in each lettuce zone during the storage. Values are mean ± standard
deviation (n = 3).
Day Zone RWC1 WC2 FW 3 BW 3 FW/TW4
0
E 88.18 ± 0.85a,A 95.00 ± 0.11a,A 23.12 ± 0.74a,A 5.48 ± 0.60b,C 0.81 ± 0.02a,A
M 86.94 ± 0.75a,A 93.936 ± 0.10b,A 14.966 ± 0.50b,A 4.567 ± 0.40b,B 0.767 ± 0.02a,A
I 84.73 ± 0.89a,B 93.73 ± 0.15b,A 13.84 ± 0.94b,A 7.00 ± 0.75a,C 0.66 ± 0.032b,A
1
E 82.34 ± 1.72b,B 94.31 ± 0.16a,B 16.24 ± 0.85a,B 8.096 ± 0.69b,B 0.670 ± 0.03a,B
M 87.41 ± 1.04a,A 94.07 ± 0.16a,A 14.09 ± 0.87b,A 8.35 ± 0.70b,B 0.64 ± 0.03b,B
I 87.81 ± 0.85a,A 93.93 ± 0.17a,A 14.70 ± 1.04b,A 10.60 ± 0.84a,A 0.59 ± 0.04b,B
2
E 82.32 ± 0.95a,B 94.13 ± 0.14a,B 12.84 ± 0.87a,D 9.01 ± 0.70a,B 0.59 ± 0.03a,C
M 83.58 ± 1.05a,B 93.95 ± 0.01b,A 11.77 ± 0.79a,B 8.80 ± 0.64ab,AB 0.57 ± 0.03a,C
I 82.95 ± 0.86a,B 93.74 ± 0.17b,A 12.02 ± 1.22a,B 7.82 ± 0.98b,BC 0.59 ± 0.04a,B
3
E 77.43 ± 1.33b,C 93.85 ± 0.16a,BC 14.06 ± 0.87a,C 11.05 ± 0.70a,C 0.56 ± 0.03a,C
M 77.17 ± 1.12b,C 93.67 ± 0.13ab,A 12.40 ± 0.94ab,B 9.93 ± 0.76ab,A 0.55 ± 0.03a,C
I 83.59 ± 1.33a,B 93.58 ± 0.30b,A 10.43 ± 0.85b,B 9.11 ± 0.69b,B 0.53 ± 0.03a,C
4
E 74.01 ± 1.48c,D 93.48 ± 0.16a,C 13.91 ± 0.94a,C 8.93 ± 0.76a,B 0.61 ± 0.03a,BC
M 77.07 ± 1.20b,C 93.61 ± 0.11a,A 11.13 ± 0.55b,B 8.49 ± 0.44ab,B 0.57 ± 0.02a,C
I 79.68 ± 1.20a,C 93.68 ± 0.30a,A 12.02 ± 2.14ab,B 7.88 ± 1.73b,C 0.60 ± 0.07a,B
5
E 75.98 ± 2.09b,D 93.14 ± 0.30a,C 12.95 ± 1.22a,D 10.21 ± 0.99a,BC 0.55 ± 0.04a,C
M 74.48 ± 2.09b,D 93.30 ± 0.19a,A 8.68 ± 0.95b,C 7.72 ± 0.77c,B 0.53 ± 0.03b,C
I 79.81 ± 2.09c,C 93.29 ± 0.37a,A 8.08 ± 0.94b,C 9.67 ± 0.76b,B 0.46 ± 0.03a,D 1RWC: Relative Water Content, %. 2WC: Water Content, %. 3FW: Free Water and BW: Bound Water, g water/g dry weight. 4FW/TW, Free Water to Total Water ratio, dimensionless.
Means followed by the same lower case letter are not significantly different (p < 0.05) when analyzing the effect of lettuce zone on each quality index for each storage day. Means followed by the same capital letter are not significantly different (p < 0.05) when analyzing the effect of storage time on each quality index for each lettuce zone.
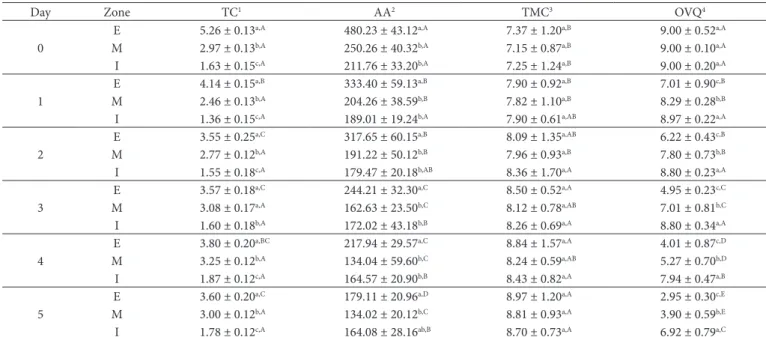
Table 2. Experimental data corresponding to greenness (TC), nutritional (AA), microbial (TMC) and sensorial indices (OVQ) obtained in each
lettuce zone during storage. Values are mean ± standard deviation (n = 3).
Day Zone TC1 AA2 TMC3 OVQ4
0
E 5.26 ± 0.13a,A 480.23 ± 43.12a,A 7.37 ± 1.20a,B 9.00 ± 0.52a,A
M 2.97 ± 0.13b,A 250.26 ± 40.32b,A 7.15 ± 0.87a,B 9.00 ± 0.10a,A
I 1.63 ± 0.15c,A 211.76 ± 33.20b,A 7.25 ± 1.24a,B 9.00 ± 0.20a,A
1
E 4.14 ± 0.15a,B 333.40 ± 59.13a,B 7.90 ± 0.92a,B 7.01 ± 0.90c,B
M 2.46 ± 0.13b,A 204.26 ± 38.59b,B 7.82 ± 1.10a,B 8.29 ± 0.28b,B
I 1.36 ± 0.15c,A 189.01 ± 19.24b,A 7.90 ± 0.61a,AB 8.97 ± 0.22a,A
2
E 3.55 ± 0.25a,C 317.65 ± 60.15a,B 8.09 ± 1.35a,AB 6.22 ± 0.43c,B
M 2.77 ± 0.12b,A 191.22 ± 50.12b,B 7.96 ± 0.93a,B 7.80 ± 0.73b,B
I 1.55 ± 0.18c,A 179.47 ± 20.18b,AB 8.36 ± 1.70a,A 8.80 ± 0.23a,A
3
E 3.57 ± 0.18a,C 244.21 ± 32.30a,C 8.50 ± 0.52a,A 4.95 ± 0.23c,C
M 3.08 ± 0.17a,A 162.63 ± 23.50b,C 8.12 ± 0.78a,AB 7.01 ± 0.81b,C
I 1.60 ± 0.18b,A 172.02 ± 43.18b,B 8.26 ± 0.69a,A 8.80 ± 0.34a,A
4
E 3.80 ± 0.20a,BC 217.94 ± 29.57a,C 8.84 ± 1.57a,A 4.01 ± 0.87c,D
M 3.25 ± 0.12b,A 134.04 ± 59.60b,C 8.24 ± 0.59a,AB 5.27 ± 0.70b,D
I 1.87 ± 0.12c,A 164.57 ± 20.90b,B 8.43 ± 0.82a,A 7.94 ± 0.47a,B
5
E 3.60 ± 0.20a,C 179.11 ± 20.96a,D 8.97 ± 1.20a,A 2.95 ± 0.30c,E
M 3.00 ± 0.12b,A 134.02 ± 20.12b,C 8.81 ± 0.93a,A 3.90 ± 0.59b,E
I 1.78 ± 0.12c,A 164.08 ± 28.16ab,B 8.70 ± 0.73a,A 6.92 ± 0.79a,C 1TC, mg of total chlorophyll/g dry weight. 2AA, mg of AA/100 g dry weight. 3TMC, log CFU.g–1 fresh weight. 4VQ, dimensionless. Means followed by the same lower case letter are
higher. For inner leaves, even though BW and TMC are relevant, their impact is less notorious than the WC and RWC indices.
Ansorena et al.(2009), working with butter lettuce stored at high relative humidity and 0-2 °C and the GSI methodology, found the following tetrads as those that best describe butter lettuce quality evolution at optimal stored conditions: RWC, FW, TC, and AA (for external zone), RWC, WC, TC, and AA (for middle zone), and RWC, FW, WC, and AA (for internal zone). When comparing these results with those shown in Table 4, it can be seen that RWC index is common not only for all tetrads, but also for both relative humidity storage conditions. Thus, RWC is a relevant index that should be measured in each postharvest management, and it is indicative of tissue water holding capacity (BARG et al., 2009). Under unsaturated atmosphere, WC is a common index for the three lettuce zones indicating its significance under low relative humidity conditions. Opposite to any expected results, the free water content (FW) is not a significant index to be analyzed under unsaturated conditions. As a substitute, the bound water content (BW) is appropriated for inner leaves, and it is a member of the ZONE (external, middle, and internal). The differences between
zones and days of storage were determined by the Tukey-Kramer multiple comparison test (p < 0.05). PROC UNIVARIATE was used to validate ANOVA assumptions.
3 Results and discussion
3.1 Experimental data
Table 1 shows the experimental data corresponding to the physical indices related to the water status, namely Relative Water Content, Water Content, Free Water, Bound Water, and the Free to Total Water ratio discerning the three zones (external, middle, and internal) of lettuce stored under unsaturated environmental conditions.
Table 2 shows the experimental data corresponding to the greenness (total chlorophyll content), nutritional (ascorbic acid content), microbial (total microbial counts) and sensorial (overall visual quality) indices in the three zones of lettuce stored under the same conditions.
The effects of the lettuce zone as well as the storage time on the mean values of the quality indices presented in Tables 1 and 2 were analyzed by means of statistical analysis. With regard to the effect of lettuce zone for each storage day, it can be said that TC, AA, and OVQ presented significant differences during storage time (p < 0.05). The rest of the indices did not show significant differences. When analyzing the effect of storage time for each lettuce zone, all indices evaluated in the external zone presented significant differences (p < 0.05). For both, internal and middle zones, the rest of the indices presented significant differences (p < 0.05), except for WC and TC.
Since consumer perception during lettuce’s shelf life is associated with the external zone, the results indicate that all indices have to be taken into account for determining the quality of the product.
3.2 Determination and mathematical modelling of the GSI
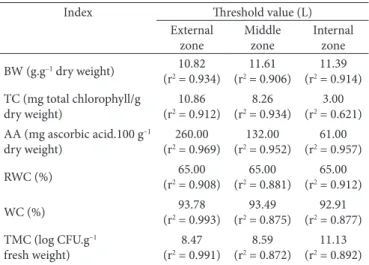
In order to estimate the GSI, the thresholds values of Equation 7 obtained for each quality index in each lettuce zone are presented in Table 3. The threshold value for each index resulted from the one corresponding to the limit of acceptability, which correspond to an OVQ of 5 (ANSORENA et al., 2009). The determination coefficient (r2) performed to the linear model
between quality indices and OVQ are also presented in Table 3. Once obtained, they allowed the determination of weighting factors for the different tetrads that could represent the stability of each zone. The best tetrads were selected taking into account the correlation between GSI and OVQ. Representative tetrad for each zone, along with weighting factors and their probabilities associated with the quality index integrating the tetrad, are presented in Table 4, according to the methodology proposed by Ansorena et al. (2009). As can be observed, in the external zone, all indices have the same weighting value (e.g. 0.25), which means that they all have equal impact on the stability of the product. In the middle zone, the impact of WC and AA is higher than that of the other two, so the weighting values are also
Table 3. Threshold values (L) of Equation 7 for each index in each
lettuce zone.
Index Threshold value (L)
External zone
Middle zone
Internal zone BW (g.g–1 dry weight) 10.82
(r2 = 0.934)
11.61 (r2 = 0.906)
11.39 (r2 = 0.914)
TC (mg total chlorophyll/g dry weight)
10.86 (r2 = 0.912)
8.26 (r2 = 0.934)
3.00 (r2 = 0.621)
AA (mg ascorbic acid.100 g–1
dry weight)
260.00 (r2 = 0.969)
132.00 (r2 = 0.952)
61.00 (r2 = 0.957)
RWC (%) (r2 = 0.908)65.00
65.00 (r2 = 0.881)
65.00 (r2 = 0.912)
WC (%) 93.78
(r2 = 0.993)
93.49 (r2 = 0.875)
92.91 (r2 = 0.877)
TMC (log CFU.g–1
fresh weight)
8.47 (r2 = 0.991)
8.59 (r2 = 0.872)
11.13 (r2 = 0.892)
Table 4. Quality indices, weighting values (Equation 6), and p-values
for each lettuce zone.
Lettuce zone
Index Weighting value
p-value
External
RWC 0.25 0.0032
WC 0.25 <0.0001
AA 0.25 0.0004
TMC 0.25 <0.0001
Middle
RWC 0.10 0.5300
WC 0.40 0.0050
TC 0.10 0.0060
AA 0.40 0.0090
Internal
RWC 0.40 0.0540
BW 0.10 0.6848
WC 0.40 0.0390
tetrad of indices that best expressed the quality of internal zone under unsaturated atmosphere.
The measurement of ascorbic acid content is pertinent to the external and middle zones under both, optimal and low relative humidity conditions. The kinetics of deterioration of AA in the inner leaves is negligible compared to that of the external and middle zones (GOÑI et al., 2009); therefore, vitamin degradation in the internal leaves may not be noticeable during the postharvest storage. On the other hand, the AA content of the external and middle leaves showed a significant decrease that could be related to an important reduction of lettuce moisture in the mentioned zones since the degradation reaction rate of vitamin C is affected mainly by the product moisture content (MARFIL; SANTOS; TELIS, 2008). Moreover, the TMC seemed to be an important parameter when evaluating quality from the low relative humidity point of view, in particular, in the external and internal zones.
The GSI values calculated from the tetrad (Table 4) were estimated with Equations 6 and 7 for each lettuce zone at each sampling time. These GSI values were correlated with OVQ for the external, middle, and internal zones of lettuce following Equation 9:
2
( ) ( )
GSI= ×a EXP OVQ + ×b OVQ +c (9)
Figure 1 shows the experimental GSI values estimated from the relevant tetrads that represent lettuce quality, as well as the proposed regression model of the GSI (Equation 9) for each lettuce zone. The empirical parameters a, b, and c, from Equation 9 and the correlation coefficient (r2) obtained for
each zone are shown in Table 5. As reported in a previous study of Ansorena et al. (2009), the same mathematical model representing the GSI - OVQ correlation was applied. Although different quality indices contributed to the GSI when evaluating low HR, the results indicated a similar mathematical behavior not only between zones but also for different storage conditions. For the internal zone, the values of OVQ ranged from 7 to 9 corresponding to GSI values higher than 0.6. Hence, the quality stability of inner leaves was higher than that of mid and outer leaves, even if stressed hydric conditions were used during postharvest handling. Under these conditions, which favor water loss, the outer and mid leaves could act as natural barriers against dehydration protecting the inner leaves.
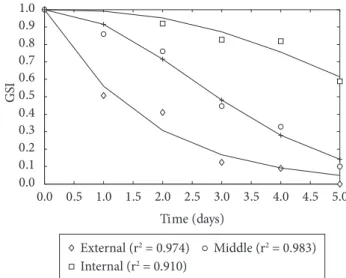
3.3 Application of Weibull distribution
In order to simulate the shelf-life of lettuce under low relative humidity storage condition, the Weibull distribution (Equation 8) was applied. Figure 2 shows both experimental and Weibull-predicted quality deterioration profiles for the three studied zones. The estimated parameters of this model were β = 1.70/daysand γ = 1.03 (r2 = 0.974) for the external zone;
β = 3.51/daysand γ = 1.93 (r2 = 0.982) for the middle zone; and
β = 6.67/daysand γ = 2.48 (r2 = 0.911) for the internal zone. In
this figure, in which GSI was plotted as a function of storage time, a clear influence of the lettuce zone on degradation rates is observed. Moreover, the shape parameter is related to the velocity of the degradation at the beginning, e.g., the lower the
Table 5. Parameter valuesa, b, and c of Equation 9 and correlation
coefficient r2 obtained for each lettuce zone.
Zone Best tetrad GSI = a × exp(OVQ) + b × (OVQ)2 + c
r2
a b c
External RWC,WC,AA,TMC 4.5720e-5 0.0023 0.4712 0.913 Middle RWC,WC,TC,AA 2.1786e-5 0.0150 8.7872e-9 0.964 Internal AA,BW,WC,TMC 3.8210e-5 0.0086 2.2912e-8 0.968
Figure 1. Experimental and estimated GSI values for each lettuce zone.
○: external, □: middle, ◊: internal. The solid lines correspond to the adjustment of Equation 9.
Figure 2. Experimental GSI values for each lettuce zone: ◊: external
(r2 = 0.974), ○: middle (r2 = 0.983), □: internal (r2 = 0.910). The solid
lines correspond to the adjustment of the Weibull model.
GUENTER KIECKBUSCH, 2005; CORZO et al., 2008; MARFIL; SANTOS; TELIS, 2008). In addition and based on a limiting OVQ value of 5, the maximum storage time was estimated by means of this model. Therefore, the inner leaves presented high GSI values along 5 days of storage; the middle leaves had a shelf life of 4 days, while the outer leaves presented the shortest useful life (3 days).
3.4 Experimental validation
In order to validate the presented model, a second set of experiments was carried out using a different lot of the same variety of Butterhead lettuce (Lactuca sativa var. Lores). For this new set of data, the OVQ value as well as the relevant indices for each tetrads belonging to each zone were measured, and their values were used to calculate the GSI value according to the proposed methodology. This GSI value was correlated with the OVQ for the new experimental values using Equation 9. The agreement between the GSI values predicted with Equation 9 for the validation set of experimental data is illustrated in Figure 3 showing a very good correspondence for each lettuce zone (r2 = 0.970, external; r2 = 0.995, middle; and r2 = 0.985,
internal). As can be seen, since the GSI value reflects the global quality of the food product, the validation results confirmed the prediction accuracy of the model under abusive conditions (e.g. low relative humidity).
4 Conclusions
Lettuce quality was studied applying the modified GSI method during postharvest storage at low relative humidity. The quality indices that better represent the loss of lettuce quality during shelf life in the external zone were RWC, WC, AA, and TMC. For the middle zone, the indices were RWC, WC, TC, and AA, and the corresponding indices for the internal zone were RWC, BW, WC, and TMC. According to these results, the RWC index appears as a common index in the tetrads corresponding to each lettuce zone demonstrating that this indicator could be a basic descriptor of lettuce quality. The WC index proved a relevant index, which is useful to describe lettuce quality stability under unsaturated situations. In addition, a mathematical model
Figure 3. Comparison between experimental and estimated with
Equation 9 GSI values for each lettuce zone. ◊: external, ○: middle, □: internal.
that correlates GSI with OVQ was also presented. Moreover, the Weibull distribution was satisfactorily applied to estimate maximum storage time under these conditions. Therefore, the use of the proposed models is an advantage compared to the traditional method to assess the quality of lettuce and the estimation of real maximum storage time. The improvement in this approach is the reduction of the amount of experimental determinations that must be performed resulting in lower operating costs.
The methodology presented in this study is an excellent tool when evaluating quality aspects from a quantitative point of view taking into account the most relevant indices affecting the lettuce quality during storage under adverse conditions (e.g. dehydration).
Acknowledgements
This research was financially supported by the Consejo Nacional de Investigaciones Científicas y Técnicas (CONICET), Agencia Nacional de Promoción Científica y Tecnológica (Secyt), and Universidad Nacional de Mar del Plata (UNMDP), Argentina.
References
ACHOUR, M. A new method to assess the quality degradation of food products during storage. Journal of Food Engineering, v. 75, n. 4, p. 560-564, 2006.
AGÜERO, M. V. et al. Postharvest Changes in Water Status and Chlorophyll Content of lettuce (Lactuca Sativa L.) and their Relationship with Overall Visual Quality. Journal of Food Science, n. 73, v. 1, p. 176-185, 2008.
ALTENHOFEN DA SILVA, M.; ARÉVALO PINEDO, R.; GUENTER KIECKBUSCH, T. Ascorbic Acid Thermal Degradation during Hot Air Drying of Camu-Camu (Myrciaria dubia [H.B.K.] McVaugh) Slices at Different Air Temperatures. Drying Technology: An International Journal, v. 23, n. 9, p. 2277-2287, 2005. http://dx.doi. org/10.1080/07373930500212784
ALZAMORA, S. M. et al. The role of tissue microstructure in the textural characteristics of minimally processed fruits. In: ALZAMORA, S. M.; TAPIA, M. S., LOPEZ-MALO, A. (Eds.).
Minimally processed fruits and vegetables, fundamental aspects
and applications. Maryland: Aspen Publishers, 2000. p. 150-175.
ANSORENA, M. R. et al. Application of the general stability index to assess the quality of butter lettuce during postharvest storage by a multi-quality indices analysis. Journal of Food Engineering, n. 92, p. 317-323, 2009. http://dx.doi.org/10.1016/j.jfoodeng.2008.11.016 BARG, M. V. et al. Evolution of plant water status indices during butter head lettuce growth and its impact on post-harvest quality. Journal
of the Science of Food and Agriculture, n. 89, p. 422-429, 2009.
BAUR, S. et al. Effect of temperature and chlorination of pre-washing water on shelf-life and physiological properties of ready-to-use iceberg lettuce. Innovative Food Science and Emerging
Technologies, n. 6, p. 171-182, 2005. http://dx.doi.org/10.1016/j.
ifset.2005.02.002
BUZRUL, S.; ALPAS, H. Modeling inactivation kinetics of food borne pathogens at a constant temperature. Lebensmittel-Wissenschaft
und-Technologie, n. 40, p. 632-637, 2007.
CORZO, O. et al. Weibull distribution for modeling air drying of coroba slices. Lebensmittel-Wissenschaft und-Technologie, n. 41, p. 2023-2028, 2008.
DEL NOBILE, M. A. et al. Respiration rate of minimally processed lettuce as affected by packaging. Journal of Food Engineering, n. 74, p. 60-69, 2006. http://dx.doi.org/10.1016/j.jfoodeng.2005.02.013 EITEL, J. U. H. et al. Suitability of existing and novel spectral indices
to remotely detect water stress in Populus spp. Forest Ecology and
Management, n. 229, p. 170-182, 2006. http://dx.doi.org/10.1016/j.
foreco.2006.03.027
ESPARZA-RIVERA, J.R. et al. Effects of Ascorbic Acid Applied by two hydrocooling methods on physical and chemical properties of green leaf stored at 5ºC. Journal of Food Science, n. 71, v. 3, p. 270-276, 2006.
FRANCIS, F. J.; CLYDESDALE, F. M. Green vegetables. In: FRANCIS, F. J. (Ed.). Food Colorimetry, Theory and Aplication.Wesport: AVI, 1975. p. 214-226.
GIANNAKOUROU, M. C.; TAOUKIS, P. S. Kinetic modeling of vitamin C loss in frozen green vegetables under variable storage conditions. Food Chemistry, n. 47, p. 2213-2217, 2003.
GOÑI, M. G. et al. Ring characterization of quality indices in butterhead lettuce cultivated under mulch and bare soil. Journal of Food
Quality, v. 33, n. 4, p. 439-460, 2009. http://dx.doi.org/10.1111/
j.1745-4557.2010.00327.x
INTERNATIONAL COMMISSION FOR THE MICROBIOLOGICAL SPECIFICATIONS OF FOODS - ICMSF. Métodos recomendados para el análisis microbiológico en alimentos. In: INTERNATIONAL C O M M I S S I O N F O R T H E M I C R O B I O L O G I C A L SPECIFICATIONS OF FOODS - ICMSF. (Ed.). Microorganismos
de los Alimentos I: Técnicas de Análisis Microbiológicos. Zaragoza:
Acribia, 1983. p. 105-280.
KADER, A. A.; LIPTON, W. J.; MORRIS, L. Systems for scoring quality of harvested lettuce. HortScience, v. 8, n. 5, p. 408-409, 1973. KADER, A. A. Quality and safety factors: Definition and Evaluation
for Fresh Horticultural Crops. In: KADER, A. A. (Ed.). Postharvest
Technology of Horticultural Crops. California: University of
California, Division of Agriculture and Natural Resources, 2002. p. 279-286.
KAUR, C.; KAPOOR, H. C. Antioxidants in fruits and vegetables - the millennium’s health. International Journal of Food Science and
Technology, v. 36, p. 703-725, 2001. http://dx.doi.org/10.1046/
j.1365-2621.2001.00513.x
KHAN, M. A. M. et al. Prediction of water and soluble solids concentration during osmotic dehydration of mango. Food
and Bioproducts Processing, v. 86, p. 7-13, 2008. http://dx.doi.
org/10.1016/j.fbp.2007.10.012
MARABI, A. et al. Normalized Weibull distribution for modeling rehydration of food particulates. European Food Research and
Technology, v. 217, p. 311-318, 2003. http://dx.doi.org/10.1007/
s00217-003-0719-y
MARFIL, P. H. M.; SANTOS, E. M.; TELIS, V. R. N. Ascorbic acid degradation kinetics in tomatoes at different drying conditions.
Lebensmittel-Wissenschaft und-Technologie, v. 41,
p.1642-1647, 2008.
MARTÍNEZ-SÁNCHEZ, A. et al. Microbial, nutritional and sensory quality of rocket leaves as affected by different sanitizers.
Postharvest Biology and Technology, v. 42, p. 86-97, 2006.
MATLAB. Release 14. versão 7.0 Natick: The MathWorks, Inc., 2004. MOREIRA, M. R.; ROURA, S. I.; DEL VALLE, C. E. Quality
of Swiss Chard produced by conventional and organic methods. Lebensmittel-Wissenschaft und-Technologie, v. 36, p. 135-141, 2003.
MOREIRA, M. R. et al. Effects of abusive temperatures on the postharvest quality of lettuce leaves: ascorbic acid loss and microbial growth. Journal of Applied Horticulture, v. 8, n. 2, p. 65-68, 2006. MOREIRA, M. et al. Mild heat shock to extend the shelf life of
minimally processed lettuce. Journal of Applied Horticulture, v.10, n. 2, p. 3-10, 2008.
PELEG, M.; PENCHINA, C. M.; COLE, M. B. Estimation of the survival curve of Listeria monocytogenes during non-isothermal heat treatments. Food Research International, v. 34, p. 383-388, 2001. http://dx.doi.org/10.1016/S0963-9969(00)00181-2
PELLETIER, O. Vitamin C: L-ascorbic and dehydro-L-ascorbic acids. In: AUGUSTIN, J.; KLEIN, B.P.; BECKER, D. (Eds.). Methods of
Vitamin Assay. New York: John Willey and Sons, 1985. p. 125-132.
PEREYRA, L.; ROURA, S. I.; DEL VALLE, C. E. Phenylalanine ammonia lyase activity in minimally processed Romaine lettuce.
Lebensmittel-Wissenschaft und-Technologie, v. 38, p. 67-72, 2005.
PONCE, A. et al. Characterization of native microbial population of Swiss chard (beta vulgaris, type cicla). Lebensmittel-Wissenschaft
und-Technologie, v. 35, p. 331-337, 2002.
PONCE, A. G. et al. Dynamics of indigenous microbial populations of butter head lettuce grown in mulch and on bare soil. Journal of
Food Science, v. 73, n. 6, p. 257-263, 2008. PMid:19241554. http://
dx.doi.org/10.1111/j.1750-3841.2008.00789.x
REDIERS, H. et al. Evaluation of the cold chain of fresh-cut endive from farmer to plate. Posthar vest Biology and
Technology, v. 51, p. 257-262, 2009. http://dx.doi.org/10.1016/j.
postharvbio.2008.07.017
ROURA, S. I. et al. Dip treatments for fresh Romaine lettuce. Italian
Journal of Food Science, v. 3, n.15, p. 405-415, 2003.
SAS INSTITUTE. SAS software. version 9.0. Cary: SAS Inst. Inc., 2002. SHIOI, Y. et al. Conversion of chlorophyllide to pheophorbide by Mg-dechelating substance in extracts of Chenopodium album. Plant
Physiology and Biochemistry, v. 34, p. 41-47, 1996.
SINGH, V.; PALLAGHY, C. K.; SINGH, D. Phosphorus nutrition and tolerance of cotton to water stress II. Water relations, free and bound water and leaf expansion rate. Field Crops Research, v. 96, p. 199-206, 2006. http://dx.doi.org/10.1016/j.fcr.2005.06.011
SIOMOS, A. S. et al. Lettuce Composition as Affected by Genotype and Leaf Position. Acta Horticulturae, v. 579, p. 635-639, 2002. SYSTAT. SYSTAT for Windows. version 5.0. Zwietering: SYSTAT
Inc., 1992.
VEGA-GÁLVEZ, A. et al. Mathematical modelling of mass transfer during rehydration process of Aloe vera (Aloe barbadensis Miller).
Food and Bioproducts Processing, v. 87, n. 4, p. 254-260, 2009.
YAMUCHI, N.; WATADA, A. E. Regulated chlorophyll degradation in spinach leaves during storage. Journal of the American Society
of Horticultural Science, v. 116, p. 58-62, 1991.
WIEN, H. C. Lettuce. In: WIEN, H. C. (Ed.). The Physiology of