Rev. Caatinga
TOLERANCE OF F2 POPULATIONS OF COWPEA TO WATER DEFICIT
1ERINA VITÓRIO RODRIGUES2, KAESEL JACKSON DAMASCENO
-SILVA3*, MAURISRAEL DE MOURA ROCHA3, EDSON ALVES BASTOS3, ADRIANO DOS SANTOS4
ABSTRACT - Water deficit affects plant development and the overcoming of its effects depends on the genotype, duration of stress, severity of damage and development stage of the plant at water stress. Cowpea is considered tolerant to water deficit, however, studies have shown that its yield can be reduced under this condition. Thus, the objective of this work was to evaluate the effect of water deficit on F2 populations of cowpea and select tolerant genotypes. Thirty F2 populations of cowpea and their parents (BRS-Paraguaçu, Pingo-de-Ouro-1-2, BRS-Xiquexique, CNCx-698-128G, Santo-Inácio and MNC99-510F-16-1) were evaluated in two experiments, one under induced water deficit and other under full irrigation, in the experimental field of the Embrapa Mid-North, in Teresina, State of Piauí, Brazil. A triple lattice incomplete block experiment design was used, with three replications. The experimental plots consisted of six 2-m rows, with spacing of 1.0 m between rows and 0.50 m between plants. The grain production was evaluated and its decrease related to the relative production and tolerance to stress was calculated. The grain production of the genotypes had an average decrease of 29.83% under water deficit. The genotypes from the crosses BRS-Paraguaçu x CNCx-698 -128G, BRS-Xiquexique x Pingo-de-Ouro-1-2, CNCx-698-128G x BRS-Xiquexique, CNCx-698-128G x MNC99-510F-16-1, Santo-Inácio x BRS-Xiquexique and MNC99-510F-16-1 x BRS-Paraguaçu had high production and high tolerance to water deficit.
Keywords: Vigna unguiculata. Abiotic stress. Grain production.
TOLERÂNCIA AO DÉFICIT HÍDRICO EM POPULAÇÕES F2 DE FEIJÃO-CAUPI
RESUMO- A deficiência hídrica provoca alterações no desenvolvimento vegetal cuja reversibilidade depende
do genótipo, da duração do estresse, da severidade do dano causado e do estádio de desenvolvimento em que a planta sofreu estresse. O feijão-caupi é considerado tolerante ao déficit hídrico, no entanto, estudos demonstraram que seu rendimento pode ser reduzido sob essa condição. O objetivo deste trabalho foi avaliar o efeito do déficit hídrico em populações F2 de feijão-caupi e selecionar genótipos tolerantes. Foram conduzidos dois ensaios para a avaliação das 30 populações F2, juntamente com seus genitores (1-BRS Paraguaçu, 2-Pingo
de Ouro-1-2, 3-BRS Xiquexique, 4-CNCx 698-128G, 5-Santo Inácio e 6-MNC99-510F-16-1), sendo um sob déficit hídrico, imposto e outro sob irrigação plena. Os experimentos foram conduzidos no campo experimental da Embrapa Meio-Norte, em Teresina, PI. Utilizou-se o delineamento experimental látice triplo. A parcela experimental foi constituída de seis linhas de 2m, com espaçamento de 1,0 m entre linhas e 0,50 m entre plantas. Avaliou-se a produção de grãos e foi calculado o percentual de redução na produção de grãos associado a índices de produção relativa e a tolerância ao estresse. O déficit hídrico, na média, reduziu em 29,83% a produção de grãos dos genótipos. As populações que apresentaram alta produção e alta tolerância ao déficit hídrico foram: BRS Paraguaçu x CNCx 698-128G, BRS Xiquexique x Pingo de Ouro-1-2, CNCx 698 -128G x BRS Xiquexique, CNCx 698-128G x MNC99-510F-16-1, Santo Inácio x BRS Xiquexique e MNC99
-510F-16-1 x BRS Paraguaçu.
Palavras-chave: Vigna unguiculata. Estresse abiótico. Produção de grãos.
____________________
*Corresponding author
1Received for publication in 08/14/2016; accepted in 04/25/2017.
Paper approved from IV CONAC 2016.
2Postgraduate Program in Genetics and Breeding, Universidade Federal do Piauí, Teresina, PI, Brazil; erinavict@hotmail.com. 3Embrapa Meio-Norte, Teresina, PI, Brazil; kaesel.damasceno@embrapa.br, maurisrael.rocha@embrapa.br, edson.bastos@embrapa.br. 4Geneticsand Plant Breeding Laboratory, l, Universidade Estadual do Norte Fluminense Darcy Ribeiro; Campos dos Goytacazes, RJ,
INTRODUCTION
The main challenge for grain production has been to prevent losses due to water deficit, which is the most limiting environmental factor to crop yields around the world, especially in semiarid regions (FRITSCHE-NETO; BORÉM, 2011). Plants can be subject to adverse conditions during their development that can cause stresses, which is a term defined as a deviation from the appropriate conditions for the plant growth, development and survival (LARCHER, 2000). The magnitude of the stress caused by water deficit is very broad, from insignificant and imperceptible to irreversible, reaching the complete wilting of plants. The amount of water required for the cowpea (Vigna
unguiculata) cycle is 300 to 450 mm, which must be
adequately distributed to meet the requirements of each development stage (FREIRE FILHO et al., 2005).
Plants subjected to water deficit may develop morphological and physiological mechanisms to respond and adapt to this stress, allowing them to survive under this adverse conditions. These mechanisms can be grouped into three categories: escape from water deficit (capacity of the plant to complete its life cycle before the occurrence of water deficit), avoidance of water deficit (ability of the plant to maintain relatively high water potential in their tissues, even under low soil moisture), and tolerance to water deficit (ability of the plant to tolerate the deficit, even with low water potential in their tissues) (AGBICODO et al., 2009).
Cowpea is considered a tolerant crop to water deficit, however, studies have shown reductions in grain yield due to water stress, denoting the need to develop tolerant cultivars (ANYIA; HERZOG, 2004; FATOKUN, 2009). The Brazilian largest production area of this crop is in the Northeast region, which is affected by irregular precipitations and dry spells, and has virtually no technology for irrigation. Tolerance to water deficit is a complex characteristic that involves several genes and biochemical routes (SHINOZAKI; YAMAGUCHI-SHINOZAKI, 2007). Studies on gene expression have shown changes in expression levels of hundreds of genes as response to water deficit (TALAMÉ et al., 2006; ZHOU et al., 2007).
Morphophysiological responses of plants to water deficit are very important to identify tolerant genotypes. Some methods have been used to evaluate this tolerance, such as measurements of water potential, stomatal conductance and chlorophyll content. However, most of these methods are expensive, time-consuming and inefficient to evaluate a large number of plants in segregating populations (SINGH; MATSUI, 2002). Thus, production components of plants are
and provide a direct response to water deficit. Some researchers (BASTOS et al., 2011; NASCIMENTO et al., 2011) have studied this subject, integrating morphophysiological parameters and production components.
Thus, the objective of this work was to evaluate the effect of water deficit on F2 populations of cowpea and select tolerant genotypes.
MATERIAL AND METHODS
The experiments were conducted in the experimental field of the Brazilian Agricultural Research Corporation (Embrapa Mid-North), in Teresina, State of Piauí, Brazil (05°05'S, 42°48'W and altitude of 74.4 m), from July 26 to October 11, 2011. The climate of the region is Aw (tropical with wet and dry seasons), according to the Köppen classification. The soil of the experimental area was classified as Eutrophic Argisol Yellow, with sandy loam surface texture. The region has annual average relative humidity of 77.02%, annual average precipitation of 1,388.9 mm and annual average air temperature of 26.97 ºC (22.08 to 33.52 °C).
Six cowpea genotypes, three cultivars (BRS-Paraguaçu, BRS-Xiquexique and
Santo-Inácio) and three lineages (Pingo-de-Ouro-1-2, CNCx698-128G and
MNC99-510F-16-1) were used as parents, considering previous studies on tolerance to water deficit (BASTOS et al., 2011; NASCIMENTO et al., 2011). These genotypes were crossed in complete diallel scheme, according to the Method-1 of the model proposed by Griffing (1956). The seeds of the 30 F1 hybrids were planted in order to obtain the F2 generation.
Two experiments were conducted to evaluate the 30 F2 populations and their parents, one under induced water deficit at the pre-flowering stage, and other under irrigation, applied according to the crop water requirement. A triple lattice incomplete block experiment design was used, with three replications. The experimental plots consisted of six 2-m rows, with spacing of 1.0 m between rows and 0.50 m between plants. A fixed conventional sprinkler system was used for irrigation, with sprinklers in lateral rows (spaced 12x12 m apart), pressure of 250 kPa, nozzle diameter of 3.4 x 2.6 mm and flow rate of 1.07 m3·h-1.
Rev. Caatinga distribution uniformity.
Plants in the experiment with no water deficit (NWD) had irrigation until the end of the reproductive stage, and those in the experiment with water deficit (WWD) had no irrigation from the pre-flowering stage, 35 days after planting (DAP) until the reproductive stage (49 DAP), when the irrigation was restarted. The total water depth applied was 178.35 mm (WWD) and 252.3 mm (NWD). The precipitations occurred were added to the water depths, resulting in total water depths of 200.75 mm (WWD) and 274.7 mm (NWD).
Soil moisture was monitored by a capacitance probe (Diviner 2000®), using 12 access tubes inserted to a depth of 0.70 m, distributed in both experiments, with readings at each 0.10 m of soil depth. The soil water retention curve of the experimental area (depths of 0.0 to 0.4 m) was determined using the model of Genuchten (1980). The field capacity (FC) and permanent wilting point found were 21.2 cm3 cm-3 and 9.05 cm3 cm-3,
respectively.
Data were collected from 15 random plants from each plot to evaluate number of days for flowering (NDF) (number of days from the planting to the beginning of flowering), number of days for maturation (NDM) (number of days from flowering to physiological maturation of the pod), number of pods per plant (NPP) (average number of pods per plant per plot), pod weight (PW) (average weight of three pods) (g), pod length (PL) (average length of three pods) (cm), number of grains per pod (NGP) (average number of grains of three pods), grains weight per pod (GWP) (average weight of three pods) (g), 100 grain weight (100GW) (g), grain production (GP) (grain weight per plot) (g) and grain index (GI) (%) (GWP to PW ratio).
Analysis of variance was performed for each variable, using the GENES (CRUZ, 2013) and SAS (SAS INSTITUTE, 1997) programs, according to the Equation 1,
(1)
wherein Yijkis the observed value of the plot of the treatment i in the block k within the replication j; m
is the overall average; gi is the effect of the treatment
i (i=1, 2,...36); rj is the effect of the replication j (j=1, 2 and 3); bk(j) is the effect of block k (k=1, 2, 3,...6) within the replication j; eijk is the experimental error related to the observation Yijk, considering the errors as independent and normally distributed, with average zero and variance .
The average grain production data of the cowpea genotypes in both experiments (NWD and WWD) were used to calculate the decrease of grain
𝑌𝑖𝑗𝑘 = 𝑚 + 𝑔𝑖 + 𝑟𝑗 + 𝑏𝑘(𝑗) + 𝑒𝑖𝑗𝑘
2
e
σ
production related to the relative production and tolerance to stress, using the Equation 2,
%decrease of GP(gi) = [BP(gi)NWD - BP(gi) WWD / BP(gi)NWD] x 100 (2)
wherein %decrease of GP(gi) is the percentage of decrease of production in the genotype i; BP(gi) NWD is the grain production of the genotype i in the NWD; BP(gi)WWD is the grain production of the genotype i in the WWD.
The relative production index (RPI), which is the average grain production from the NWD divided by the lowest average production (Equation 3), and the stress tolerance index (STI), which is the average grain production of the NWD divided by their respective losses, compared with the WWD (Equation 4), was used to identify the most productive and tolerant genotypes to water deficit.
(2)
(3)
These indexes were combined by ordering their results to establish their relative position and represented in a graph to identify the most productive and tolerant genotypes to water stress.
RESULTS AND DISCUSSION
The water in the soil profile depths of 0.0 to 0.4 m (Figure 1a) showed a soil moisture in the
NWD close to the field capacity, which was 21.2 cm3 cm-3 according to the water retention curve.
Field capacities of 15 to 20% are considered satisfactory for this crop. The soil moisture in the NWD was similar in all soil depths evaluated, except in the 0.1 m, which had the lowest soil moisture. This result was expected, since the soil surface layer tends to lose moisture faster by evaporation, due to climatological elements, such as solar radiation, air temperature, wind speed and relative humidity.
The soil moisture in the WWD had a linear decrease throughout the soil profile at 36 DAP, soon after induction the water deficit (Figure 1b). The soil moisture at the depths 0.0 to 0.2 m were lower than the permanent wilting point (PWP) (9 cm3 cm-3),
thus, the irrigation was restarted at 49 DAP to change this condition. Only one more irrigation was performed, since most genotypes had already reached the maturation stage. Although the soil
RPI = Average grain production of NWD < average grain production of WWD
STI =Average grain production of NWD
moisture at depths of 0.0 to 0.20 m reached the PWP, the moisture at depths of 0.2 to 0.4 m were close to the field capacity, i.e., with sufficient moisture for the plant metabolic activities. This result was observed by the general aspect of the plants (turgid
of leaves and long roots). The plants probably deepened their roots to absorb water from deeper soil layers, preventing the effects of water deficit, which explains their lower decrease in grain production.
Figure 1. Soil moisture at depths of 10, 20, 30 and 40 cm. a) experiment with no water deficit, b) experiment with water deficit and c) average moisture. FC = field capacity, PWP = permanent wilting point.
The average soil moisture and limits between field capacity (FC) and PWP of the two experiments are shown in Figure 1c. The water deficit was detected by the soil water exhaustion, which showed moderate deficits, approximately 60%. Nascimento et al. (2011) evaluated the effect of water deficit in
moderate deficit.
Rev. Caatinga
genotypes showed no differences, the water deficit of the WWD decreased their production average in 29.83% (Table 1), compared with the NWD. Similar results were found by Bezerra et al. (2003) (GP decrease of 26.2%) with water deficit applied at only one stage of the cowpea cycle. According to these authors, water deficit on flowering or bean filling stages did not cause great production losses, probably due to the short intervals between phenological stages. The decrease in GP found in the present work were lower than those found by
Nascimento et al. (2011) (60%) with induction of water deficit, applying half of the water depth required by cowpea crops. Thus, the lower values of GP (29.83%) found may be due to the use of a less severe water deficit.
The experiments had coefficient of variation (CV) of 1.97% for pod length (PL) and 19.51% for GP, denoting a good experimental precision (PIMENTEL-GOMES, 2009), since most variables had CVlower than 10%.
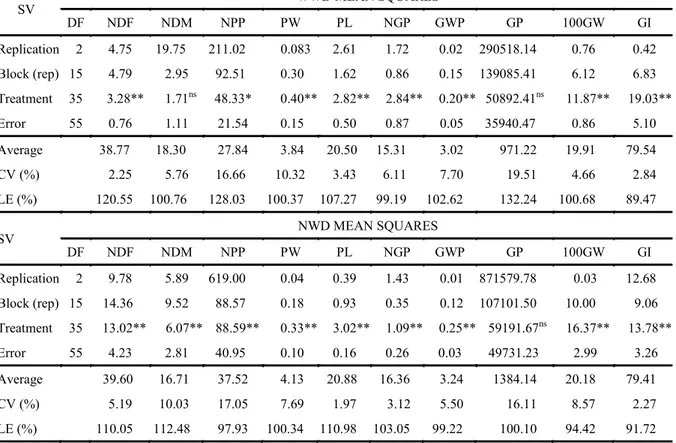
Table 1. Analysis of variance of the number of days for flowering (NDF), number of days for maturation(NDM), number of pods per plant (NPP), pod weight (PW), pod length (PL), number of grains per pod (NGP), grain weight per pod (GWP), grain production (GP), 100 grain weight (100GW) and grain index (GI) of cowpea genotypes under water deficit (WWD) and with no water deficit (NWD).
SV
WWD MEAN SQUARES
DF NDF NDM NPP PW PL NGP GWP GP 100GW GI
Replication 2 4.75 19.75 211.02 0.083 2.61 1.72 0.02 290518.14 0.76 0.42
Block (rep) 15 4.79 2.95 92.51 0.30 1.62 0.86 0.15 139085.41 6.12 6.83
Treatment 35 3.28** 1.71ns 48.33* 0.40** 2.82** 2.84** 0.20** 50892.41ns 11.87** 19.03**
Error 55 0.76 1.11 21.54 0.15 0.50 0.87 0.05 35940.47 0.86 5.10
Average 38.77 18.30 27.84 3.84 20.50 15.31 3.02 971.22 19.91 79.54
CV (%) 2.25 5.76 16.66 10.32 3.43 6.11 7.70 19.51 4.66 2.84
LE (%) 120.55 100.76 128.03 100.37 107.27 99.19 102.62 132.24 100.68 89.47
SV
NWD MEAN SQUARES
DF NDF NDM NPP PW PL NGP GWP GP 100GW GI
Replication 2 9.78 5.89 619.00 0.04 0.39 1.43 0.01 871579.78 0.03 12.68
Block (rep) 15 14.36 9.52 88.57 0.18 0.93 0.35 0.12 107101.50 10.00 9.06
Treatment 35 13.02** 6.07** 88.59** 0.33** 3.02** 1.09** 0.25** 59191.67ns 16.37** 13.78**
Error 55 4.23 2.81 40.95 0.10 0.16 0.26 0.03 49731.23 2.99 3.26
Average 39.60 16.71 37.52 4.13 20.88 16.36 3.24 1384.14 20.18 79.41
CV (%) 5.19 10.03 17.05 7.69 1.97 3.12 5.50 16.11 8.57 2.27
LE (%) 110.05 112.48 97.93 100.34 110.98 103.05 99.22 100.10 94.42 91.72
1
SV: Sources of variation; CV: Coefficient of variation; LE: Lattice efficiency.
These results were similar to those found by Bezerra et al. (2003). The highest CV values were found for the number of pods per plant (NPP) and GP. However, doubts on this classification are frequent, since it does not consider the crop or variable evaluated. Carvalho et al. (2012) evaluated the production of cowpea populations improved for iron, zinc and protein contents and found higher CV for PW (10.69%), NPP (15.77%), PL (9,02%), 100 grain weight (100GW) (8.78%), number of beans per pod (NGP) (11.15%) and GP (19.51%).
Twenty-two genotypes of the NWD had productions above the overall average (1384.14 g),
especially the crosses BRS-Paraguaçu x MNC99-510F-16-1, MNC99-510F-16-1 x CNCx-698-128G, MNC99 -510-16-1 x
BRS-Xiquexique and BRS-Xiquexique x Pingo-de-Ouro-1-2 (Table 2). Nineteen genotypes of
the WWD also had productions above the general average (971.22 g) and showed GP decreases lower than 40%.
Table 2. Grain production (GP), losses, decrease of production, relative production index (RPI) and stress tolerance index (STI) of cowpea genotypes under water deficit (WWD) and with no water deficit (NWD).
Genotypes GP
NWD
GP
WWD Losses %Decrease RPI STI
11 1637.59 1119.27 518.32 31.65 1.86 3.16
35 1623.92 913.44 710.48 43.75 1.85 2.29
34 1596.87 843.78 753.09 47.16 1.81 2.12
18 1593.31 1182.47 410.84 25.79 1.81 3.88
21 1552.52 1030.10 522.42 33.65 1.76 2.97
36 1543.16 978.26 564.90 36.61 1.75 2.73
19 1532.87 956.91 575.96 37.57 1.74 2.66
32 1525.41 1165.30 360.11 23.61 1.73 4.24
10 1508.96 992.71 516.25 34.21 1.71 2.92
29 1504.10 1104.43 399.67 26.57 1.71 3.76
13 1502.45 1001.74 500.71 33.33 1.71 3.00
16 1488.57 895.55 593.02 39.84 1.69 2.51
26 1447.24 1080.90 366.35 25.31 1.64 3.95
14 1434.37 760.45 673.92 46.98 1.63 2.13
9 1424.83 1106.04 318.79 22.37 1.62 4.47
20 1412.25 852.14 560.11 39.66 1.60 2.52
3 1406.56 925.85 480.71 34.18 1.60 2.93
24 1394.76 1064.06 330.70 23.71 1.58 4.22
23 1391.90 780.19 611.71 43.95 1.58 2.28
22 1391.35 821.24 570.10 40.97 1.58 2.44
8 1390.07 1203.39 186.68 13.43 1.58 7.45
4 1385.16 745.48 639.68 46.18 1.57 2.17
30 1383.85 1054.58 329.27 23.79 1.57 4.20
33 1351.74 1211.45 140.29 10.38 1.54 9.64
6 1347.07 861.78 485.29 36.03 1.53 2.78
1 1337.13 1004.41 332.72 24.88 1.52 4.02
17 1298.61 1040.82 257.79 19.85 1.48 5.04
15 1291.28 780.24 511.03 39.58 1.47 2.53
31 1224.65 1106.22 118.43 9.67 1.39 10.34
28 1221.38 867.27 354.11 28.99 1.39 3.45
12 1210.56 1011.70 198.86 16.43 1.38 6.09
7 1203.68 920.53 283.15 23.52 1.37 4.25
25 1193.32 964.20 229.12 19.20 1.36 5.21
27 1102.00 803.10 298.90 27.12 1.25 3.69
2 1095.58 1088.49 7.09 0.65 1.24 154.45
5 879.99 725.47 154.52 17.56 1.00 5.70
The combination of the relative production (RPI) and stress tolerance (STI) indexes presented in Figure 2 shows the high production and tolerance to
stress of the genotypes from the crosses BRS-Paraguaçu x CNCx-698-128G, BRS-Xiquexique x Pingo-de-Ouro-1-2,
CNCx-698-128G x BRS-Xiquexique, CNCx-698-128G x MNC99-510F-16-1, Santo-Inácio x BRS-Xiquexique and MNC99-510F-16-1 x BRS-Paraguaçu (Figure 2,
Rev. Caatinga
Figure 2. Relative production index (RPI) and stress tolerance index (STI) of the cowpea genotypes under water deficit and with no water deficit.
CONCLUSIONS
The cowpea populations showed variability for most of the variables evaluated. The grain production decreased by 29.83% under water deficit. The genotypes from the crosses BRS-Paraguaçu x
CNCx-698-128G, BRS-Xiquexique x Pingo-de-Ouro-1-2, CNCx-698-128G x BRS-Xiquexique, CNCx-698-128G x MNC99-510F-16-1, Santo-Inácio x BRS-Xiquexique
and MNC99-510F-16-1 x BRS-Paraguaçu had high production and high tolerance to water deficit. The genotype Pingo-de-Ouro-1-2 showed the lowest decrease in production (0.65%) due to induction of water stress.
ACKNOWLEDGEMENTS
The authors thank the Brazilian Agricultural Research Corporation (Embrapa Meio-Norte) and the Brazilian National Council for Scientific and Technological Development (CNPq) (Processes: 485350/2013-0 and 308172/2013-2) for the financial support for this project and the Coordination for the Improvement of Higher Education Personnel (CAPES) for granting a scholarship.
REFERENCES
AGBICODO, E. M. et al. Breeding drought tolerant cowpea: constraints, accomplishments, and future prospects. Euphytica, Wageningen, v. 167, n. 3, p. 353-370, 2009.
ANYIA, A. O.; HERZOG, H. Water-use efficiency, leaf area and leaf gas exchange of cowpeas under mid-season drought. European Journal of Agronomy, Amsterdam, v. 20, n. 4, p. 327-339, 2004.
BASTOS, E. A. et al. Identification of cowpea genotypes for drought tolerance. Revista Ciência Agronômica, Fortaleza, v. 42, n. 1, p. 100-107, 2011.
BEZERRA, F. M. L. et al. Feijão-caupi e déficit hídrico em suas fases fenológicas. Revista Ciência Agronômica, Fortaleza, v. 34, n. 1, p. 13-18, 2003.
CRUZ, C. D. Genes: a software package for analysis in experimental statistics and quantitative genetics. Acta Scientiarum Agronomy, Maringá, v. 35, n. 3, p. 271-276, 2013.
FATOKUN, C. et al. Enhancing drought tolerance in cowpea. African Crop Science Conference Proceedings, Kampala, v. 9, n. 1, p. 531-536, 2009.
FREIRE FILHO, F. R. et al. Melhoramento genético. In: FREIRE FILHO, F. R.; LIMA, J. A. A.; RIBEIRO, V. Q. (Eds.). Feijão-caupi: Avanços
tecnológicos. Brasília: Embrapa Informação Tecnológica. 2005. p. 27-92.
FRITSCHE-NETO, R.; BORÉM, A. Melhoramento de plantas para condições de estresses abióticos. Viçosa, MG: UFV, 2011. 240 p.
GENUCHTEN, M. T. A closed-form equation for predicting hydraulic conductivity of unsaturated soils. Soil Science Society of American Journal, Madison, v. 44, n. 5, p. 892-898, 1980.
GRIFFING, B. Concept of general and specific ability in relation to diallel crossing systems. Australian Journal of Biological Sciences, Melbourne, v. 9, n. 4, p. 462-493, 1956.
LARCHER, W. Ecofisiologia vegetal. Tradução de PRADO, C. H. B. A. e FRANCO. A. C. São Carlos, SP: Rima, 2000. 531 p.
NASCIMENTO, S. P. et al. Tolerância ao déficit hídrico em genótipos de feijão-caupi. Revista Brasileira de Engenharia Agrícola e Ambiental, Campina Grande, v. 15, n. 8, p. 853-860, 2011.
PIMENTEL-GOMES, F. P. Curso de estatística experimental. 15. ed. Piracicaba, SP: Esalq, 2009. 477 p.
RAMALHO, M. A. P.; FERREIRA D. F.; OLIVEIRA, A. C. Experimentação em genética e melhoramento de plantas. Lavras, MG: UFLA, 2005. 300 p.
SAS INSTITUTE. SAS-STAT Software: Changes
and Enhancements Through Release 6.12. SAS Institute, 1997.
SHINOZAKI, K.; YAMAGUCHI-SHINOZAKI, K. Gene networks involved in drought stress response and tolerance. Journal of Experimental Botany, Oxford, v. 58, n. 2, p. 221-227, 2007.
SINGH, B. B.; MATSUI, T.; Cowpea varieties for
(Eds.). Challenges and Opportunities for Enhancing Sustainable Cowpea Production. Ibadan: International Institute of Tropical Agriculture, 2002, p. 287-300.
TALAMÉ, V. et al. Barley transcript profiles under dehydration shock and drought stress treatments: a comparative analysis. Journal of Experimental Botany, Oxford, v. 58, n. 2, p. 229-240, 2006.