AbstrAct: High-throughput phenotyping using spectral reflectance measurements offers the potential to provide more information for making better-informed management decisions at the crop canopy level in real time. The aim of this study was to investigate the suitability of hyperspectral reflectance measurements of the crop canopy for the assessment of biomass, nitrogen concentration, nitrogen uptake, relative chlorophyll contents, and yield in 2 peanut cultivars, Giza 5 and Giza 6. Peanuts were grown under field conditions and subjected to 3 doses of nitrogen fertilizer with or without the application of 2 bio-fertilizers, Bradyrhizobium spp. or plant growth-promoting rhizobacteria. Simple linear regression of normalized difference spectral indices and partial least square regression (PLSR) were employed to develop predictive models to estimate the measured parameters. The tested spectral
bAsic AreA -
Article
Non-invasive spectral detection of the beneficial
effects of
Bradyrhizobium
spp. and plant
growth-promoting rhizobacteria under different
levels of nitrogen application on the biomass,
nitrogen status, and yield of peanut cultivars
Salah Elsayed1*, Mohamed Elhoweity1, Salah El-Hendawy2,4, Urs Schmidhalter3
1. University of Sadat City - Environmental Studies and Research Institute - Department of Evaluation and Natural Resources - Sadat, Egypt.
2. King Saud University - College of Food and Agriculture Sciences - Department of Plant Production - Riyadh, Saudi Arabia. 3. Technische Universität München - Department of Plant Sciences - Freising, Germany.
4. Suez Canal University - Faculty of Agriculture - Department of Agronomy - Ismailia, Egypt.
*Corresponding author: sala7emam@ yahoo.com
Received: Mar. 11, 2016 – Accepted: May 12, 2016
reflectance indices were significantly related to all measured parameters with R2 of up to 0.89. The spectral reflectance index values differed
at the same level of nitrogen fertilizer, as well as among the 3 levels of nitrogen fertilizer application for inoculation with Bradyrhizobium and co-inoculation with Bradyrhizobium and plant growth-promoting rhizobacteria. The calibration models of PLSR data analysis further improved the results, with R2 values reaching 0.95. The overall results
of this study indicate that hyperspectral reflectance measurements monitoring peanut plants enable rapid and non-destructive assessment of biomass, nitrogen status, and yield parameters of peanut cultivars subjected to various agronomic treatments.
Key words: biofertilizer, phenomics, phenotyping, precision agriculture, spectral reflectance.
iNtrODUctiON
Nitrogen is an important element for proper plant development and reproduction because it is a component of chlorophyll, amino acids, proteins, and enzymes. An efficient nitrogen supply is required for plant metabolism, and the addition of nitrogen will increase crop photosynthesis and final yields (Erisman et al. 2010). There are different interesting crop canopy parameters, such as the nitrogen concentration, nitrogen uptake, and aboveground biomass, which can be used as diagnostic indicators of nitrogen requirements for crops. In order to match nitrogen requirements as closely as possible, the spatial and temporal variations of these indicators on the field scale must be determined (Schmidhalter et al. 2003). The application of nitrogen is known to have direct positive impact on the final yield of all crops. Increasing the level of nitrogen fertilizer increased the pod yield, pod weight, seed yield, and seed weight of peanut plants (Barik et al. 1998). Nitrogen fertilizer is one of the most critical inputs in plant production. However, all forms of mineral nitrogen fertilizers are subjected to possible losses, especially when applied at high doses. The risks of nitrogen loss depend on the site and climate conditions, as well as the nitrogen form. The cost of nitrogen fertilizer represents the largest share of the total production costs of agricultural crops, accounting from 20 to 30% of the variable production cost in cereals crops. Therefore,
the application of Bradyrhizobium spp. (Br) and plant
growth-promoting rhizobacteria(PGPR) in legume crop
production has been suggested as a suitable alternative strategy to bypass the risk of chemical fertilizers (Badawi et al. 2011). Enhancement of nodulation and biological nitrogen fixation of legumes by co-inoculation with PGPR microorganisms is becoming a practical way to improve nitrogen use efficiency in sustainable agricultural production systems (Bai et al. 2002). PGPR can promote legume nodulation and nitrogen fixation by producing flavonoid-like compounds and/or stimulating the host plant to produce more flavonoid signal molecules (Bai et al. 2002).
For economic and ecological reasons, spatially-targeted and temporally-optimized nitrogen fertilizer application has become a pressing issue in the field of crop production. Generally, current fertilizer management depends on soil analysis, but these practices frequently disregard locally
variable nitrogen demand (Mistele and Schmidhalter 2008). Plant analysis is important to control nitrogen status, but destructive methods are tedious and time-consuming. Similarly, for detecting the final yield of crops in a field, numerous observations are required to characterize that field.
Plant phenotyping is currently considered one of the key-factors in agricultural research to overcome such observational and time constraints and is predicted to play a vital role in ensuring yield stability and future improvements in crop yield and quality (Furbank and Tester 2011). Spectral approaches have been proposed to be efficient, high-throughput, and cost-effective, and allow simultaneous phenotyping of several important agronomic traits in field trials (Walter et al. 2012; Winterhalter et al. 2012). High-throughput precision agriculture and phenotyping using spectral reflectance measurements have further potential to provide more information to facilitate better-informed management decisions at the crop canopy scale in real time (Mistele and Schmidhalter 2010; Elsayed et al. 2011; Rischbeck et al. 2014; El-Hendawy et al. 2015). Proximal remote sensing systems for phenotyping on the field scale can be based on passive reflectance sensing. Passive sensor systems depend on sunlight as a source of light, which enables hyperspectral information to be obtained in the visible and near-infrared range (Erdle et al. 2011; Elsayed et al. 2015a).
Despite the potential benefits of hyperspectral assessments, at present, there is little information available regarding the efficacy of hyperspectral assessments in characterizing biomass, nitrogen status, and yield parameters of peanut cultivars inoculated with different sources of bio-fertilizers and subjected to different levels of mineral nitrogen fertilizer application. The use of high-throughput remote or proximal sensing to assess such parameters for peanuts has rarely been reported in literature. For example, the closest relationships were obtained for the
spectral index (R610 − R424)/(R610 + R424) with the pod yield of
2 peanut cultivars (R2 up to 0.70, significant at p ≤ 0.001) at
3 growth stages under 3 levels of mineral nitrogen fertilizer application (Elsayed et al. 2015a). The hyperspectral analysis of growing peanut leaves delivered significant correlations (up
to r = 0.73**; p = 0.006) between pod maturity and crop canopy
Spectral reflectance indices with peanut cultivars
growing leaves with field spectroscopy, the explanation of variance was greater than 90% using partial least square regression (PLSR) analysis with wavelengths of 640; 656; 747; 964 and 1,124 nm.
This study therefore aims to confer novel information by investigating changes in spectral indices under different levels of mineral nitrogen fertilizer application in combination with 2 sources of bio-fertilizers,
Bradyrhizobium and plant growth-promoting rhizobacteria. There have been several previous studies assessing biomass, nitrogen status, and grain yield of cereals related to mineral nitrogen fertilizer application alone. For example,
the spectral index (R760/R730) was related to the grain yield of
wheat cultivars under different levels of nitrogen fertilizer application (Erdle et al. 2013). The red edge inflection point (REIP) was closely related to the nitrogen uptake of wheat from tillering to flowering (Mistele and Schmidhalter
2008). Fu et al. (2014) reported that the NDVI and
the soil adjusted vegetation index (SAVI) were related to the biomass of wheat.
An alternative approach is to conduct a PLSR analysis of hyperspectral reflectance data. This approach is a chemometric technique that creates orthogonal latent variables across the input variables (single wavebands) and relates them to the target variables by generalizing and combining the methods of principal component analysis (PCA) and multiple regressions (Sharabian et al. 2014). Therefore, it could be used to predict a set of dependent variables from a large set of independent ones (i.e. predictors) that may be correlated. In PLSR, the orthogonal components, unaffected by collinearity, are derived from all variables (Weber et al. 2012). PLSR improved the assessment of pod yield of peanut cultivars (Elsayed et al. 2015a), biomass of winter wheat (Fu et al. 2014; Li et al. 2014), and the N status in wheat and maize based on ground-based spectral data (Bonfil et al. 2005).
The purpose of this work was: (i) to study the effect of the interaction between 3 levels of nitrogen fertilizer application with and without Br and PGPR on biomass fresh and dry weight, nitrogen concentration, nitrogen uptake, SPAD value, pod and seed yield, and the shelling percentage of 2 peanut cultivars at 2 growth stages; (ii) to assess whether spectral indices can reflect changes in the abovementioned variables; (iii) to compare the performance of spectral reflectance indices and PLSR to assess the abovementioned plant traits of peanut cultivars at 2 growth stages.
MAteriAL AND MetHODs
Field experiments and design
Field experiments were conducted at the Research Station
of the University of Sadat City, Egypt (lat 30°2′41.185″N;
long 31°14′8.1625″E), which is characterized by a semi-arid
climate with moderate cold winters and warm summers. The experimental treatments consisted of 2 peanut cultivars (Giza 5 and Giza 6) and 3 nitrogen fertilizer rates (N1 = 24;
N2 = 48 and N3 = 96 kg∙ha−1) combined with or without
Br (strain USDA 3456) and PGPR. The field experiments were designed as a split-plot design with 3 replicates. The 2 cultivars were assigned to the main plots, while the various fertilizer treatments were distributed randomly in sub-plots.
The PGPR contained Azospirillum brasilense (NO 40)
and Serratia marcescens (EG 10). The nitrogen fertilizer was added in 2 equal doses. The first dose was added at the sowing date and the second was applied 21 days
after sowing in the form of ammonium nitrate (NH4NO3
33.5%). All treatments received the recommended dose
of superphosphate (15.5% P2O5) at a rate of 476 kg∙ha
−1
and potassium sulfate (48% K2O) at a rate of 119 kg∙ha
−1. Drip irrigation was used. The peanut cultivars were sown on 15 May 2013 in sandy loam soil that contains 72.8% sand, 19.3% silt, and 7.9% clay. The soil is characterized
by an electrical conductivity of 1.82 dS∙m−1, organic matter
content of 0.36%, and calcium carbonate content of 5%. The plots consisted of 3 rows spaced 60 cm apart with a length of 3 m. Herbicide and fungicide treatments were applied in all trials when necessary.
Microorganisms
Brwas individually used or mixed with PGPR, which
contained Azospirillum brasilense (NO 40) and Serratia
marcescens (EG 10). Br was cultured in a yeast extract
mannitol broth medium (Vincent 1970), and A. brasilense and
S. marcescens were grown in Kings medium B (Atlas 1995). The cultures were incubated at 28 °C for 3 days on a rotary shaker until the early log phase to ensure a population density
of 109 cfu∙mL–1 culture. Powdered vermiculite supplemented
with 10% Irish peat was packed into polyethylene bags (200 g carrier per bag), then sealed and sterilized with gamma
irradiation (5.0 × 10⁶ rads); 120 mL of log phase bacterial
thoroughly and left for a week to cure (Badawi et al. 2011). All strains were mixed with cultivated seeds.
Chlorophyll meter reading (SPAD values)
The relative chlorophyll content was taken as the average value from 3 fully expanded leaves, as obtained from a portable SPAD-502 chlorophyll meter (Konica-Minolta, Osaka, Japan). Measurements were taken at BBCH 35 (50% of plants meets between rows) and at BBCH 85 (main phase of ripening: about 50% of pods developed to final size are ripe).
Biomass sampling
Biomass sampling was performed 2 times, at BBCH 35 and BBCH 85. To determine fresh biomass, 3 plants were removed from each plot and weighed. Thereafter, samples were placed in an oven (65 °C) until there was no change in the plant dry weight. The dried plant samples were finely ground, and the N content was detected by using the micro-Kjeldahl method, as described by the AOAC (1980). Furthermore, the aboveground N uptake
(kg∙ha−1) was calculated as the plant dry weight multiplied
by the total N content.
Determination of pod yield, seed yield, and shelling percentage
At harvest time, random samples of 5 plants were taken from each plot to determine the average pod and seed yield. After pod drying, the pod and seed
yield (t∙ha−1) as well as shelling (%) were determined.
The shelling percentage (%) was calculated using the following equation:
Shelling (%) = seed yield∙plant−1/pod yield∙plant−1
Spectral reflectance measurements
A passive bi-directional reflectance sensor (tec5, Oberursel, Germany) measuring wavelengths between 302 and 1,148 nm, with a bandwidth of 2 nm and connected to a portable computer and geographical positioning system (GPS), was used. The handheld FieldSpec sensor consists of 2 units. One was linked to a diffuser and measured
the light radiation as a reference signal. The second unit measured the canopy reflectance with an optic fiber (Mistele and Schmidhalter 2008; Elsayed et al. 2015a,b), with an
aperture of 12° and a field of view of 0.2 m2 from 1 m of
height. The sensor outputs were co-recorded along with the GPS coordinates when collecting information in the field. The actual sensor output was co-referenced and recorded for each position. Afterwards, readings within 1 plot were averaged to a single value per plot. The canopy reflectance was calculated with the readings from the spectrometer unit and corrected with a calibration factor obtained from a reference grey standard. Spectral measurements were mostly taken on sunny days at nadir direction approximately 0.75 m above the canopy. Readings were taken once during main stem elongation (BBCH 35) and ripening of fruits and seeds (BBCH 85).
Statistical analysis
Selection of spectral reflectance indices
In Table 1, 5 spectral indices from different sources are listed with the respective references. In this study, we calculated and tested both known and novel indices. A contour map analysis for all wavelengths of the hyperspectral passive sensor (from 302 to 1,048 nm) was used to select
spectral
reflectance indices Formula references
Normalized index based on 780 and
550 nm
(R780 − R550)/(R780 + R550) Gutiérrez et al. (2010)
Normalized index based on 760 and
730 nm
(R760 − R730)/(R760 + R730) Barnes et al. (2000)
Normalized index based on 698 and
420 nm
(R698 − R420)/(R698 + R420) Elsayed et al. (2015a)
Normalized index based on 660 and
440 nm
(R660 − R440)/(R660 + R440) This study
Normalized index based on 640 and
470 nm
(R640 − R470)/(R640 + R470) This study
Normalized index based on 610 and
424 nm
(R610 − R424)/(R610 + R424) Elsayed et al. (2015a)
Normalized index based on 500 and
460 nm
Spectral refl ectance indices with peanut cultivars
some normalized difference indices (Figure 1). The “lattice” package from the R statistics software version 3.0.2 (R Foundation for Statistical Computing 2013) was used
to produce the contour maps from the hyperspectral reflectance readings; 12 wavelengths (780; 760; 730; 698; 660; 640; 610; 550; 500; 470; 460 and 420 nm) were therefore used to calculate the reflectance indices given in Table 1.
Modelling of measured plant traits
Sigmaplot for Windows v.12 (Systat software Inc., Chicago, IL, USA) and SPSS 22 (SPSS Inc., Chicago, IL, USA) were used for the statistical analysis. The Unscrambler X multivariate data analysis software version 10.2 (CAMO Software AS, Oslo, Norway) was used to calibrate and validate partial least square models. Single wavebands derived from the same spectra usually contain redundant information (Elsayed et al. 2015b). The PLSR creates orthogonal latent variables across the input variables (single wavebands) and relates them to the variables measurements. It is a way to cope with redundancy in the input variables, searching the sensitive information from the spectral reflectance for all wavelengths (Sharabian et al. 2014).
resULts AND DiscUssiON
Measured plant properties of peanut cultivars
Mean values of the measured variables, i.e. biomass fresh and dry weight, nitrogen concentration, nitrogen uptake, SPAD value, pod and seed yield, and shelling percentage of the 2 peanut cultivars subjected to 3 levels
of nitrogen fertilizer application with and without Brand
PGPR are shown in Tables 2–4, and the data of nitrogen status are not shown at BBCH 85. Generally, the highest mean values of all variables were recorded with the highest
nitrogen level with Brand PGPR(N3 + Br + PGPR) for
both cultivars, and the lowest values for the measured variables were recorded at the lowest nitrogen level (N1) without Br and PGPR. This could be due to the essential
role of Br in enhancing plant growth and N2 fixation
(Mekhemar et al. 2005). In addition, this finding could be attributable to the ability of PGPR to promote plant growth by either facilitating the uptake of essential elements or modulating hormones, enzymes, and siderophores (Tilak et al. 2005; Verma et al. 2010; Badawi et al. 2011). The mean values of biomass fresh and dry weight and nitrogen
""""""""""""
""""""""""""" """""""""""
""""""""""""
0.8 0.7 0.6
W
a
v
elength 2 (nm)
W
a
v
elength 2 (nm)
W
a
v
elength 2 (nm)
W
a
v
elength 2 (nm)
0.5 0.4 0.3 0.2 0.1 0.0
0.8 0.7 0.6 0.5 0.4 0.3 0.2 0.1 0.0
0.8
0.6
0.4
0.2
0.0 0.7
0.6 0.5 0.4 0.3 0.2 0.1 0.0
400 600 800 1,000
400 600 800 1,000
400 600 800 1,000
400 400
600 600
800 800
1,000 1,000
400 600 800 1,000 400 600 800 1,000 400 600 800 1,000
Wavelength 1 (nm)
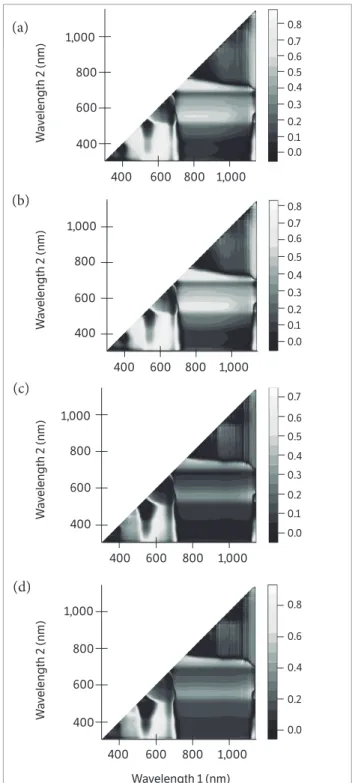
Figure 1. Correlation matrices (contour maps) showing the coeffi cients of determination (R2) for all dual wavelength combinations in the 302 – 1,148 nm range (as a normalized diff erence index) of the hyperspectral passive refl ectance sensing with (a) biomass fresh weight at BBCH 35, (b) nitrogen uptake at BBCH 35, (c) nitrogen concentration at BBCH 85, and (d) seed yield at BBCH 85 of 2 peanut cultivars.
(a)
(c) (b)
uptake increased with plant development, while the mean values of nitrogen concentration decreased. The nitrogen concentrations of the 2 peanut cultivars decreased with plant development. These results agree with other reports
(Mistele and Schmidhalter 2008), indicating that the nitrogen concentration of plants is often the highest at early growth stages and subsequently decreases with plant development to the stage of senescence. This reduction
cultivars treatments bFW1 (t∙ha−1)
sD1 (t∙ha−1)
bFW2 (t∙ha−1)
sD2 (t∙ha−1)
bDW1 (t∙ha−1)
sD1 (t∙ha−1)
bDW2 (t∙ha−1)
sD2 (t∙ha−1)
Giza 5
N1 2.57i 0.18 10.24i-j 0.50 0.44h 0.04 2.69h-i 0.05
N1 + Br 3.49f-i 0.36 12.56h-i 1.02 0.66e-h 0.06 3.36g-h 0.15
N1 + Br + PGPR 4.10d-g 0.08 14.78g-h 1.28 0.73d-f 0.04 4.14f-g 0.86
N2 3.24g-i 0.10 13.56h 1.15 0.54f-h 0.03 3.41g-h 0.25
N2 + Br 4.09d-g 0.27 16.87f-g 0.72 0.71e-f 0.05 4.17f-g 0.09
N2 + Br + PGPR 4.92b-e 0.24 22.23c-d 0.81 0.81b-e 0.03 5.49b-d 0.06
N3 4.63b-f 0.13 17.27.9f 1.59 0.82b-e 0.07 4.60e-f 0.42
N3 + Br 5.76a-b 0.23 24.19a-c 1.02 1.02a-b 0.03 6.12b-c 0.24
N3 + Br + PGPR 6.30a 0.19 26.56a 0.98 1.06a 0.09 7.07a 0.35
Giza 6
N1 2.37i 0.21 5.89k 2.15 0.46g-h 0.07 1.60j 0.71
N1 + Br 3.05g-i 0.37 8.84i 0.35 0.55f-h 0.08 2.32i 0.21
N1 + Br + PGPR 3.78e-h 0.33 10.88i-j 0.53 0.70e-f 0.05 2.70h-i 0.59
N2 2.91h-i 0.67 13.78h 2.54 0.52f-h 0.11 3.48g-h 0.80
N2 + Br 4.01d-h 0.34 16.21f-g 0.36 0.67e-g 0.06 4.04f-g 0.58
N2 + Br + PGPR 4.51c-f 0.37 19.62e 1.14 0.80c-e 0.02 4.88d-f 0.30
N3 4.79b-c 0.25 19.96d-e 1.58 0.87a-e 0.06 5.28c-e 0.68
N3 + Br 5.11b-d 0.21 22.77b-c 1.69 0.94a-d 0.42 5.98b-c 0.77
N3 + Br + PGPR 5.53a-c 0.13 24.93a-b 1.30 0.98a-c 0.02 6.31a-b 0.17 table 2. Average biomass fresh weight and biomass dry weight at growth stages BBCH 35 and BBCH 85 of 2 peanut cultivars at 3 levels of nitrogen fertilizer application with or without the inoculation by Bradyrhizobium and plant growth-promoting rhizobacteria in 2013.
Values with the same letter are not significantly different (p ≥ 0.05) among treatments according to Duncan’s test. BFW1 = Biomass fresh weight at BBCH 35; SD = Standard deviation; BFW2 = Biomass fresh weight at BBCH 85; BDW1 = Biomass dry weight at BBCH 35; BDW2 = Biomass dry weight at BBCH 85; Br = Bradyrhizobium; PGPR = Plant growth-promoting rhizobacteria.
Values with the same letter are not significantly different (p ≥ 0.05) among treatments according to Duncan’s test. SD = Standard deviation; Br = Bradyrhizobium; PGPR = Plant growth-promoting rhizobacteria.
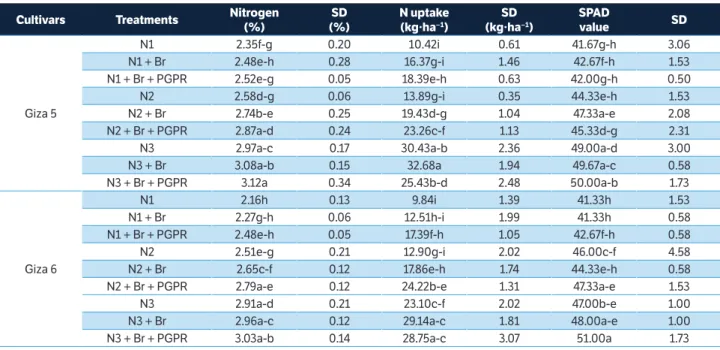
table 3. Average nitrogen concentration, nitrogen uptake, and SPAD values of 2 peanut cultivars at 3 levels of nitrogen fertilizer application inoculated with or without Bradyrhizobium and plant growth-promoting rhizobacteria at BBCH 35 in 2013.
cultivars treatments Nitrogen (%)
sD (%)
N uptake (kg∙ha−1)
sD (kg∙ha−1)
sPAD
value sD
Giza 5
N1 2.35f-g 0.20 10.42i 0.61 41.67g-h 3.06
N1 + Br 2.48e-h 0.28 16.37g-i 1.46 42.67f-h 1.53
N1 + Br + PGPR 2.52e-g 0.05 18.39e-h 0.63 42.00g-h 0.50
N2 2.58d-g 0.06 13.89g-i 0.35 44.33e-h 1.53
N2 + Br 2.74b-e 0.25 19.43d-g 1.04 47.33a-e 2.08
N2 + Br + PGPR 2.87a-d 0.24 23.26c-f 1.13 45.33d-g 2.31
N3 2.97a-c 0.17 30.43a-b 2.36 49.00a-d 3.00
N3 + Br 3.08a-b 0.15 32.68a 1.94 49.67a-c 0.58
N3 + Br + PGPR 3.12a 0.34 25.43b-d 2.48 50.00a-b 1.73
Giza 6
N1 2.16h 0.13 9.84i 1.39 41.33h 1.53
N1 + Br 2.27g-h 0.06 12.51h-i 1.99 41.33h 0.58
N1 + Br + PGPR 2.48e-h 0.05 17.39f-h 1.05 42.67f-h 0.58
N2 2.51e-g 0.21 12.90g-i 2.02 46.00c-f 4.58
N2 + Br 2.65c-f 0.12 17.86e-h 1.74 44.33e-h 0.58
N2 + Br + PGPR 2.79a-e 0.12 24.22b-e 1.31 47.33a-e 1.53
N3 2.91a-d 0.21 23.10c-f 2.02 47.00b-e 1.00
N3 + Br 2.96a-c 0.12 29.14a-c 1.81 48.00a-e 1.00
Spectral reflectance indices with peanut cultivars
in nitrogen concentration is interpreted as a dilution
effect. Generally, the interaction between Brand PGPR
tended to increase the biomass and nitrogen status of the 2 peanut cultivars. The Giza 5 peanut cultivar produced the highest pod and seed yield through all treatments compared to Giza 6.
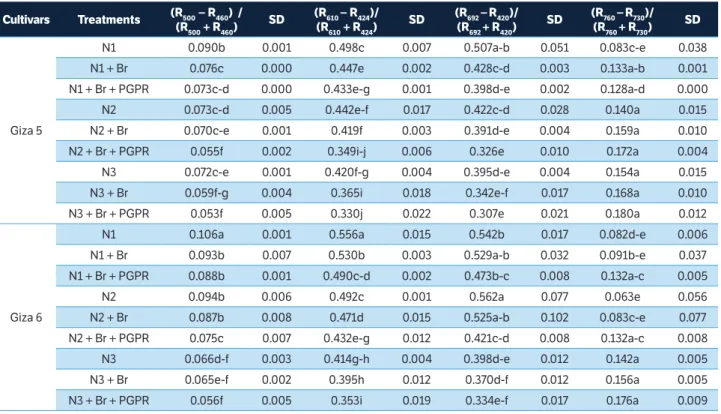
influence of 3 levels of nitrogen fertilizer applications together with Bradyrhizobium and plant growth-promoting rhizobacteriaon 4 spectral indices
The 4 selected spectral reflectance indices used to assess the peanut cultivars were generally influenced by
the 3 levels of nitrogen fertilizer applications withBr and
PGPR (Table 5; the data of spectral indices at BBCH 35 are not shown). There was variability in the values of the spectral reflectance indices between the treatments at the same level of nitrogen fertilizer application at 2 different growth stages. The values of the spectral reflectance indices differed at the same level of nitrogen fertilizer application
for the Br inoculationand for the co-inoculation of Brand
PGPR. For example, the values of the spectral reflectance
indices (R500 − R460)/(R500 + R460); (R610 − R422)/(R610 + R422);
(R692 − R420)/(R692 + R420) and (R760 − R730)/(R760 + R730) of
Giza 5 at BBCH 35 under the lowest level of nitrogen fertilizer application varied from 0.073 to 0.090, from 0.433 to 0.498, from 0.398 to 0.507, and from 0.083 to 0.128, respectively. There were also clear differences in the values of the spectral reflectance indices between all treatments for the 2 cultivars. These differences between inoculated and non-inoculated peanut plants at the same level of nitrogen may be due to the ability of Br and PGPR to increase the biomass due to enhanced nutrient uptake (Verma et al. 2010; Badawi et al. 2011). The values of the spectral indices ranged from 0.053 to 0.107; from 0.33 to 0.527; from 0.307 to 0.562 and from 0.063 to 0.180
for (R500 − R460)/(R500 + R460); (R610 − R422)/ (R610 + R422);
(R692 − R420)/(R692 + R420) and (R760 − R730)/(R760 + R730);
respectively. The values of 3 spectral indice, (R500 − R460)/
(R500 + R460); (R610 − R422)/(R610 + R422); and (R692 − R420)/
(R692 + R420) decreased, while the spectral index (R760 − R730)/
(R760 + R730) value increased with increasing nitrogen
levels.
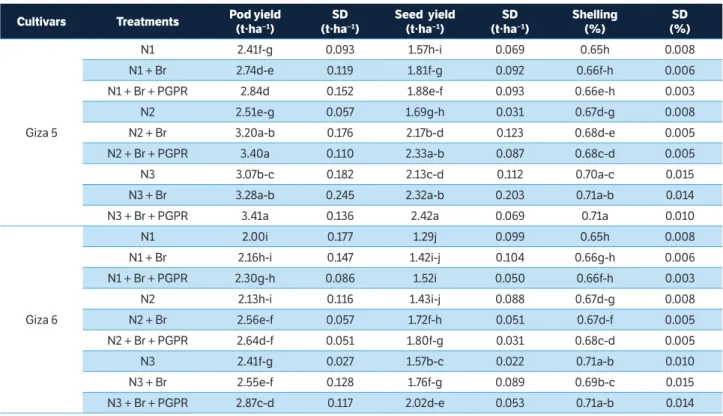
cultivars treatments Pod yield (t∙ha−1)
sD (t∙ha−1)
seed yield (t∙ha−1)
sD (t∙ha−1)
shelling (%)
sD (%)
Giza 5
N1 2.41f-g 0.093 1.57h-i 0.069 0.65h 0.008
N1 + Br 2.74d-e 0.119 1.81f-g 0.092 0.66f-h 0.006
N1 + Br + PGPR 2.84d 0.152 1.88e-f 0.093 0.66e-h 0.003
N2 2.51e-g 0.057 1.69g-h 0.031 0.67d-g 0.008
N2 + Br 3.20a-b 0.176 2.17b-d 0.123 0.68d-e 0.005
N2 + Br + PGPR 3.40a 0.110 2.33a-b 0.087 0.68c-d 0.005
N3 3.07b-c 0.182 2.13c-d 0.112 0.70a-c 0.015
N3 + Br 3.28a-b 0.245 2.32a-b 0.203 0.71a-b 0.014
N3 + Br + PGPR 3.41a 0.136 2.42a 0.069 0.71a 0.010
Giza 6
N1 2.00i 0.177 1.29j 0.099 0.65h 0.008
N1 + Br 2.16h-i 0.147 1.42i-j 0.104 0.66g-h 0.006
N1 + Br + PGPR 2.30g-h 0.086 1.52i 0.050 0.66f-h 0.003
N2 2.13h-i 0.116 1.43i-j 0.088 0.67d-g 0.008
N2 + Br 2.56e-f 0.057 1.72f-h 0.051 0.67d-f 0.005
N2 + Br + PGPR 2.64d-f 0.051 1.80f-g 0.031 0.68c-d 0.005
N3 2.41f-g 0.027 1.57b-c 0.022 0.71a-b 0.010
N3 + Br 2.55e-f 0.128 1.76f-g 0.089 0.69b-c 0.015
N3 + Br + PGPR 2.87c-d 0.117 2.02d-e 0.053 0.71a-b 0.014
table 4. Average pod yield, seed yield, and shelling percentage of 2 peanut cultivars at 3 levels of nitrogen fertilizer application inoculated with or without Bradyrhizobium and plant growth-promoting rhizobacteria in 2013.
Contour map analysis of the hyperspectral passive data
A contour map analysis produced the mean coefficients
of determination (R2) of the 2 measurement dates for all dual
wavelength combinations as a normalized difference spectral index. The contours of the matrices of the hyperspectral passive sensor presented more distinct relationships between measure plant parameters, such as biomass dry weight, nitrogen concentration, nitrogen uptake, SPAD value, pod yield, seed yield, and shelling percentage of the peanut cultivars with visible wavelengths than with the combination of visible and near infrared wavelengths. The contour map analysis of the relationship between the normalized difference spectral indices with biomass fresh weight and nitrogen uptake at BBCH 35 as well as nitrogen concentration and seed yield at BBCH 85 are shown in Figure 1. The averages of the correlation matrices resulting from the measurements at 2 growth stages — indicated by the coefficients
of determination (R2) for all dual wavelengths combinations of
400 – 780 nm as normalised difference indices for all measured
parameters of the 2 peanut cultivars — presented higher R2
values compared to all other 2 wavelength combinations
(Figure 1). This may be due 400 to 750 nm being more affected
by chlorophyll-a and chlorophyll-b as well as the leaf area
index. These findings agree with results of Townsend et al. (2003), who reported relatively low reflectance from the 400 to 530 nm blue region rapidly changing to higher reflectance in the green region and edge of the red region, from 680 to 730 nm. The spectra in the 450 to 530 nm range are strongly
influenced by the presence and abundance of chlorophyll-a
and chlorophyll-b. In contrast, the spectra in the 680 to 730
nm range may be correlated with the leaf area index. Therefore, peanut cultivars exposed to different levels of nitrogen with or without Br and PGPR create a significant variation in spectral measurements from 400 to 750 nm.
Relationship between spectral reflectance indices with different measured plant parameters
Across the 2 measuring dates, 7 spectral indices were more closely correlated with biomass dry weight, biomass fresh weight, nitrogen concentration, nitrogen uptake, SPAD value, pod yield, seed yield, and shelling percentage of the 2 peanut
cultivars treatments (r500 − r460) /
(r500 + r460) sD
(r610 − r424)/ (r610 + r424) sD
(r692 −r420)/ (r692 + r420) sD
(r760 −r730)/ (r760 + r730) sD
Giza 5
N1 0.090b 0.001 0.498c 0.007 0.507a-b 0.051 0.083c-e 0.038
N1 + Br 0.076c 0.000 0.447e 0.002 0.428c-d 0.003 0.133a-b 0.001
N1 + Br + PGPR 0.073c-d 0.000 0.433e-g 0.001 0.398d-e 0.002 0.128a-d 0.000
N2 0.073c-d 0.005 0.442e-f 0.017 0.422c-d 0.028 0.140a 0.015
N2 + Br 0.070c-e 0.001 0.419f 0.003 0.391d-e 0.004 0.159a 0.010
N2 + Br + PGPR 0.055f 0.002 0.349i-j 0.006 0.326e 0.010 0.172a 0.004
N3 0.072c-e 0.001 0.420f-g 0.004 0.395d-e 0.004 0.154a 0.015
N3 + Br 0.059f-g 0.004 0.365i 0.018 0.342e-f 0.017 0.168a 0.010
N3 + Br + PGPR 0.053f 0.005 0.330j 0.022 0.307e 0.021 0.180a 0.012
Giza 6
N1 0.106a 0.001 0.556a 0.015 0.542b 0.017 0.082d-e 0.006
N1 + Br 0.093b 0.007 0.530b 0.003 0.529a-b 0.032 0.091b-e 0.037
N1 + Br + PGPR 0.088b 0.001 0.490c-d 0.002 0.473b-c 0.008 0.132a-c 0.005
N2 0.094b 0.006 0.492c 0.001 0.562a 0.077 0.063e 0.056
N2 + Br 0.087b 0.008 0.471d 0.015 0.525a-b 0.102 0.083c-e 0.077
N2 + Br + PGPR 0.075c 0.007 0.432e-g 0.012 0.421c-d 0.008 0.132a-c 0.008
N3 0.066d-f 0.003 0.414g-h 0.004 0.398d-e 0.012 0.142a 0.005
N3 + Br 0.065e-f 0.002 0.395h 0.012 0.370d-f 0.012 0.156a 0.005
N3 + Br + PGPR 0.056f 0.005 0.353i 0.019 0.334e-f 0.017 0.176a 0.009
table 5. Values of 4 spectral reflectance indices of peanut cultivars as affected by 3 levels of nitrogen fertilizer with or without Bradyrhizobium
and plant growth-promoting rhizobacteria at BBCH 85.
Spectral reflectance indices with peanut cultivars
cultivars. The obtained coefficients of determination (R2) are
shown in Table 6. Statistically significant relationships between all spectral reflectance indices derived from the visible (VIS), near infrared (NIR) or the combination of VIS and NIR regions
were found for biomass dry weight (R2 values ranging from
0.60*** to 0.86***), biomass fresh weight (R2 values ranging
from 0.62*** to 0.89***), nitrogen concentration (R2 values
ranging from 0.49*** to 0.68***), nitrogen uptake (R2
values ranging from 0.63** to 0.84***), SPAD value (R2 values
ranging from 0.55*** to 0.67***), pod yield (R2 values ranging from
0.47*** to 0.83***), seed yield (R2 values ranging from 0.49*** to
0.86***), and shelling percentage (R2 values ranging from 0.58***
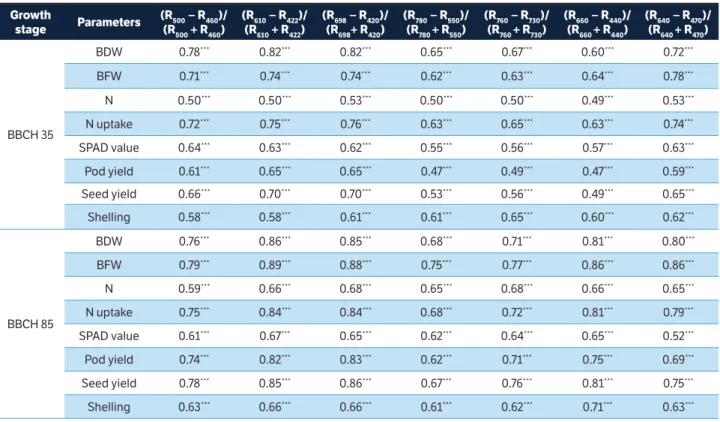
to 0.871***), as shown in Table 6. Generally, the normalized
spectral indices of (R610 − R424)/(R610 + R424) and (R692 − R420)/
(R692 + R420) showed the highest coefficients of determination
for most of the measured variables at the 2 growth stages. The
highest coefficients of determination (R2) for most variables
were found at BBCH 85 compared to BBCH 35.
The results demonstrated that the selected 7 spectral reflectance indices (Table 1) were apparently useful for monitoring the measured parameters (Table 6). The results
also presented that, based on R2 for pod and seed yield,
it was better to monitor both parameters at BBCH 85 than at BBCH 35. These results agree with Elsayed et al. (2015a), who found that the normalized spectral index of
(R610 − R424)/(R610 + R424) showed the highest R
2 values (0.70***,
0.69***, and 0.53***) for pod yield, seed protein content, and
straw yield of peanut cultivars, respectively, at BBCH 85. Importantly, the 3 spectral indices that were derived from the
VIS, (R610 − R424)/(R610 + R424); (R698 − R420)/(R698 + R420) and
(R640 − R470)/(R640 + R470), had R
2 values up to 0.89***, meaning
they were more closely related to the measured parameters compared to indices derived from the NIR range or the
combination between VIS and NIR regions, (R760 − R730)/
(R760 + R730) and (R780 − R550)/(R780 + R550), which had R
2
values up to 0.77*** (Table 6).
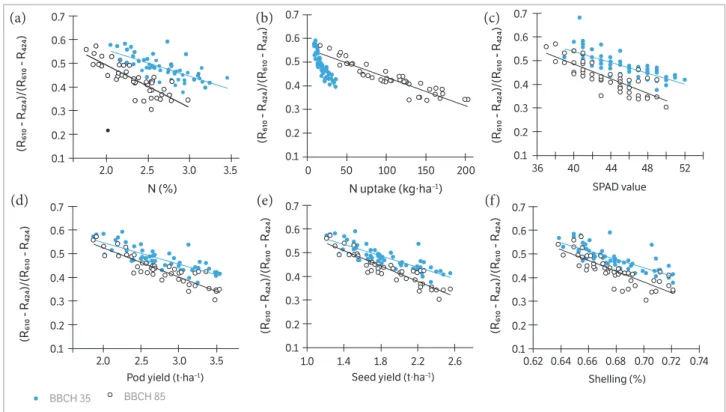
The curves of the relationships between nitrogen percentage, nitrogen uptake, and SPAD values and the
index (R610 − R424)/(R610 + R424) at the 2 stages showed a shift
in the values and different slopes (Figure 2). This may be due to the plant development through the growth stages, which leads to changes in the structure of peanut plants.
***Statistically significant at p ≤ 0.001. BDW = Biomass dry weight; BFW = Biomass fresh weight.
table 6. Coefficients of determination of linear regressions of biomass dry weight, biomass fresh weight, nitrogen concentration, nitrogen uptake, SPAD value, pod and seed yield and shelling percentage of peanut cultivars with spectral reflectance indices obtained from hyperspectral passive sensing (calculated as normalized difference indices) for peanut cultivars subjected to 3 levels of nitrogen fertilizer application with or without Bradyrhizobium and plant growth-promoting rhizobacteria at BBCH 35 and 85.
Growth
stage Parameters
(r500 − r460)/ (r500 + r460)
(r610 − r422)/ (r610 + r422)
(r698 − r420)/ (r698+ r420)
(r780 − r550)/ (r780 + r550)
(r760 − r730)/ (r760 + r730)
(r660 − r440)/ (r660 + r440)
(r640 − r470)/ (r640 + r470)
BBCH 35
BDW 0.78*** 0.82*** 0.82*** 0.65*** 0.67*** 0.60*** 0.72***
BFW 0.71*** 0.74*** 0.74*** 0.62*** 0.63*** 0.64*** 0.78***
N 0.50*** 0.50*** 0.53*** 0.50*** 0.50*** 0.49*** 0.53***
N uptake 0.72*** 0.75*** 0.76*** 0.63*** 0.65*** 0.63*** 0.74***
SPAD value 0.64*** 0.63*** 0.62*** 0.55*** 0.56*** 0.57*** 0.63***
Pod yield 0.61*** 0.65*** 0.65*** 0.47*** 0.49*** 0.47*** 0.59***
Seed yield 0.66*** 0.70*** 0.70*** 0.53*** 0.56*** 0.49*** 0.65***
Shelling 0.58*** 0.58*** 0.61*** 0.61*** 0.65*** 0.60*** 0.62***
BBCH 85
BDW 0.76*** 0.86*** 0.85*** 0.68*** 0.71*** 0.81*** 0.80***
BFW 0.79*** 0.89*** 0.88*** 0.75*** 0.77*** 0.86*** 0.86***
N 0.59*** 0.66*** 0.68*** 0.65*** 0.68*** 0.66*** 0.65***
N uptake 0.75*** 0.84*** 0.84*** 0.68*** 0.72*** 0.81*** 0.79***
SPAD value 0.61*** 0.67*** 0.65*** 0.62*** 0.64*** 0.65*** 0.52***
Pod yield 0.74*** 0.82*** 0.83*** 0.62*** 0.71*** 0.75*** 0.69***
Seed yield 0.78*** 0.85*** 0.86*** 0.67*** 0.76*** 0.81*** 0.75***
Partial least square regression analysis to predict the different measurement variables
In Table 7, as well as in Figures 3,4, the quality of the PLSR models is represented by adjusted coefficients of determination
of calibration (R2 cal) and validation (R2 val), root mean square
errors (RMSE cal and val), and the slope of the linear regressions for calibration and validation models at the 2 measurement
dates. Across all calibration dataset formations, the coefficients
of determination varied from 0.69*** to 0.97*** for allparameters.
Across all validation data set formations, the coefficients of
determination variedfrom 0.38*** to 0.82*** for all parameters.
Across all calibration and validation data set formations, the
RMSE varied from 0.07 to 0.87 t∙ha−1 for biomass dry weight,
0.30 to 2.52 t∙ha−1 for biomass fresh weight, 0.06 to 0.26% for
nitrogen concentration, 2.19 to 26.2 kg∙ha−1 for nitrogen uptake,
1.37 to 2.31 for SPAD value, 0.12 to 0.3 t∙ha−1 pod yield, 0.09 to
0.20 t∙ha−1 for seed yield, and 0.01 to 0.014% for shelling
percentage. The highest slopes for the calibration and validation data sets were 0.95 and 0.92, respectively, across all measurements dates of biomass fresh weight at BBCH 85 (Table 7).
The use of the full spectral range from 302 to 1,148 nm for the PLSR analysis increased the accuracy of the estimates of
Figure 2. The relationship between the spectral index (R610 – R424)/(R610 + R424) and (a) the nitrogen concentration, (b) the nitrogen uptake, (c) the SPAD value, (d) the pod yield, (e) the seed yield, and (f) the shelling percentage of 2 peanut cultivars at 2 growth stages. Statistical information is given in Table 6.
the measured parameters for the 2 peanut cultivars (Table 7) compared with the use of the normalized difference spectral indices (Table 6). The PLSR technique allowed the identification of optimized models and is considered the state-of-the art technique enabling a high efficiency in searching for optimized relationships. Simple linear, polynomial, or exponential functions are used to model the relationship between biophysical parameters and vegetation indices. Alternatively, non-linear regression techniques, such as support vector regression (SVR), have been applied. That experience indicates that overfitting should be avoided and more importance should be paid to the robustness of the tested algorithms. The advantage of PLSR models compared with spectral indices is that the PLSR in this study used information from every spectral band from 302 to 1,148 nm and selected the number of factors that better represent the calibration data without overfitting. PLSR had no limitation in predicting the measured parameters, and the relationship between the observed and predicted values was linear. The calibration model of the PLSR was strongly related to measured parameters compared to the normalized difference spectral indices. Comparably, in peanut cultivars, the assessment of measured parameters was stronger and more N (% )
2.0 2.5 3.0 3.5
0.1 0.2 0.3 0.4 0.5 0.6 0.7
BBCH 35 BBCH 85 0.7
0.6
0.5
BBCH 35 BBCH 85 N (%)
(R₆₁₀ - R₄₂₄)/(R₆₁₀ - R₄₂₄)
0.4
0.3
0.2
2.0 2.5 3.0 3.5 0.1
(R₆₁₀ - R₄₂₄)/(R₆₁₀ - R₄₂₄)
0 50 100 150 200
0.7
0.6
0.5
0.4
0.3
0.2
0.1
(R₆₁₀ - R₄₂₄)/(R₆₁₀ - R₄₂₄)
(R₆₁₀ - R₄₂₄)/(R₆₁₀ - R₄₂₄) (R₆₁₀ - R₄₂₄)/(R₆₁₀ - R₄₂₄) (R₆₁₀ - R₄₂₄)/(R₆₁₀ - R₄₂₄)
SPAD value
36 40 44 48 52
0.7
0.6
0.5
0.4
0.3
0.2
0.1
Pod yield (t∙ha–1) Seed yield (t∙ha–1)
Shelling (%) 1.0 1.4 1.8 2.2 2.6
2.0 2.5 3.0 3.5 0.7
0.6
0.5
0.4
0.3
0.2
0.1
0.7
0.6
0.5
0.4
0.3
0.2
0.1
0.7
0.6
0.5
0.4
0.3
0.2
0.1
0.62 0.64 0.66 0.68 0.70 0.72 0.74 N uptake (kg∙ha–1)
(a)
(d)
(b)
(e)
(c)
Spectral reflectance indices with peanut cultivars
Growth stage
statistcal
parameters Pcs DW Pcs FW Pcs N Pcs N uptake Pcs sPAD value Pcs Pod yield Pcs seed
yield Pcs shelling
BBCH 35 R² cal 6 0.90*** 6 0.93*** 4 0.51*** 6 0.92*** 6 0.83*** 8 0.93*** 8 0.94*** 6 0.90*** R² val 0.67*** 0.76*** 0.43*** 0.74*** 0.52*** 0.60*** 0.68*** 0.64***
RMSE cal 0.07 0.30 0.22 2.19 1.37 0.12 0.09 0.01
RMSE val 0.12 0.60 0.25 3.93 2.31 0.30 0.21 0.01
Slope cal 0.9 0.93 0.97 0.92 0.83 0.93 0.94 0.91
Slope val 0.76 0.83 0.71 0.82 0.66 0.74 0.76 0.76
BBCH 85 R² cal 5 0.89*** 7 0.95*** 5 0.73*** 11 0.94*** 5 0.75*** 6 0.88*** 6 0.90*** 5 0.69*** R² val 0.69*** 0.82*** 0.61*** 0.71*** 0.67*** 0.78*** 0.81*** 0.57***
RMSE cal 0.52 1.37 0.15 11.14 1.63 0.16 0.12 0.012
RMSE val 0.87 2.52 0.18 26.24 1.98 0.22 0.16 0.014
Slope cal 0.89 0.95 0.54 0.94 0.75 0.88 0.90 0.69
Slope val 0.78 0.92 0.47 0.83 0.67 0.83 0.86 0.66
table 7. Calibration, and 20-fold cross-validation of the statistics of partial least square regression models of the spectral reflectance from 302 to 1,148 nm with biomass fresh weight, biomass dry weight, nitrogen concentration, nitrogen uptake, SPAD value, pod yield, seed yield, and shelling percentage of peanut cultivars.
***Statistically significant at p ≤ 0.001; PCs = Number of latent variables; DW = Dry weight; FW = Fresh weight; cal = Calibration; val = Validation.
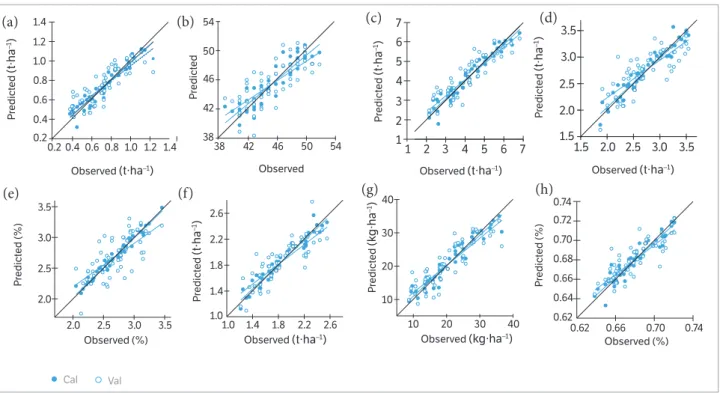
Figure 3. Relationships between the observed and predicted (a) biomass dry weight, (b) biomass fresh weight, (c) nitrogen concentration, (d) nitrogen uptake, (e) SPAD value, (f) pod yield, (g) seed yield, and (h) shelling percentage of 2 peanut cultivars at BBCH 35 for the calibration (cal) and validation (val) datasets using a partial least square model. Statistical information is given in Table 7.
Observed (t∙ha–1)
0.2 0.4 0.6 0.8 1.0 1.2 1.4
P redict ed (t∙ha –1) 0.2 0.4 0.6 0.8 1.0 1.2 1.4 Cal Val Observed (ton/ha)
1 2 3 4 5 6 7
P re d ic te d (t on /h a ) 1 2 3 4 5 6 7 Observed (%) 2.0 2.5 3.0 3.5
P redict ed (%) 2.0 2.5 3.0 3.5
Observed (kg∙ha–1)
10 20 30 40
P redict ed (k g∙ha –1) 10 20 30 40 Spad value Observed
38 42 46 50 54
P redict ed 38 42 46 50 54 Observed (ton/ha)
1.5 2.0 2.5 3.0 3.5
P re d ic te d (t on /h a ) 1.5 2.0 2.5 3.0 3.5
Observed (t∙ha–1)
1.0 1.4 1.8 2.2 2.6
P redict ed (t∙ha –1) 1.0 1.4 1.8 2.2 2.6 Observed (%) 0.62 0.66 0.70 0.74
P redict ed (%) 0.62 0.64 0.66 0.68 0.70 0.72 0.74 3.5 3.5 3.0 3.0 2.5 2.5 2.0 2.0 1.5 1.5
Observed (t∙ha–1)
Observed (t∙ha–1)
P redict ed (t∙ha –1) P redict ed (t∙ha –1) 7 7 6 6 5 5 4 4 3 3 2 2 1 1
robust when using PLSR models than with the previously assayed normalized difference spectral indices. This is shown by the improvement of the coefficients of determination in Table 7. These results agree with those of Sharabian et al. (2014), who found that strong relationships existed between predicted and observed values for a validation data set
of grain yield (R2 = 0.87, RMSE = 301) and SPAD values
(R2 = 0.84, RMSE = 1.94). Elsayed et al. (2015a) reported that
PLSR models could improve the assessment of pod yield in peanut cultivars compared to the spectral reflectance indices collected from other studies. Li et al. (2014) found that PLSR is a potentially useful approach to derive the crop canopy nitrogen concentration of winter wheat across growth stages
when compared to spectral indices; the average R2 value for
the PLSR model increased to 76.8 and 75.5% in the calibration and validation data sets, respectively.
cONcLUsiON
From the above results, it could be concluded that
inoculation of peanut plants with Bradyrhizobium and plant
growth-promoting rhizobacteria enhanced the biomass, nitrogen status, and final yield of peanut cultivars under different levels of nitrogen application compared with non-inoculated plants. The models developed from the normalized difference spectral indices and PLSR analyses reliably assessed the measured plant parameters for 2 peanut cultivars. The calibration of PLSR models of reflectance
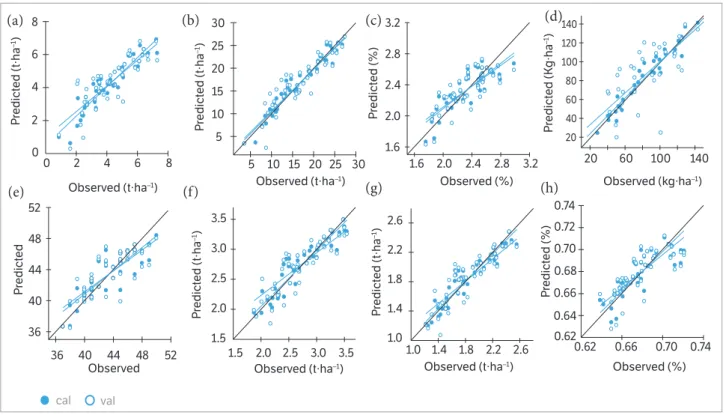
Figure 4. Relationships between the observed and predicted (a) biomass dry weight, (b) biomass fresh weight, (c) nitrogen concentration, (d) nitrogen uptake, (e) SPAD value, (f) pod yield, (g) seed yield, and (h) shelling percentage of 2 peanut cultivars at BBCH 85 for the calibration (cal) and validation (val) datasets using a partial least square model. Statistical information is given in Table 7.
Observed (t∙ha–1)
0 2 4 6 8
P
redict
ed (t∙ha
–1)
0 2 4 6 8
cal val
Observed (t∙ha–1)
5 10 15 20 25 30
P
redict
ed (t∙ha
–1)
5 10 15 20 25 30
Observed (%)
1.6 2.0 2.4 2.8 3.2
P
redict
ed (%)
1.6 2.0 2.4 2.8 3.2
Observed (kg∙ha–1)
20 60 100 140
P
redict
ed (K
g∙ha
–1)
20 40 60 80 100 120 140
Spad value
Observed
36 40 44 48 52
P
redict
ed
36 40 44 48 52
Observed (t∙ha–1)
1.5 2.0 2.5 3.0 3.5
P
redict
ed (t∙ha
–1)
1.5 2.0 2.5 3.0 3.5
Observed (t∙ha–1)
1.0 1.4 1.8 2.2 2.6
P
redict
ed (t∙ha
–1)
1.0 1.4 1.8 2.2 2.6
Observed (%)
0.62 0.66 0.70 0.74
P
redict
ed (%)
0.62 0.64 0.66 0.68 0.70 0.72 0.74
measurements potentially improves measurements of non-invasive parameters of peanut crops compared with normalized difference spectral indices analysis.
AcKNOWLeDGeMeNts
The authors would like to extend their sincere appreciation to the Deanship of Scientific Research at the King Saud University for funding this Research Group No. (RG-1435-032).
Association of Official Analytical Chemists (1980). Official methods
of analysis. 13. ed. Washington: AOAC.
Atlas, R. M. (1995). Handbook of media for environmental
microbiology. Boca Raton: CRC Press.
Badawi, F., Biomy, A. and Desoky, A. (2011). Peanut plant growth
and yield as influenced by co-inoculation with Bradyrhizobium and
reFereNces
some rhizo-microorganisms under sandy loam soil conditions.
Annals of Agricultural Sciences, 56, 17-25. http://dx.doi.org/10.1016/j. aoas.2011.05.005.
Bai, Y., Souleimanov, A. and Smith, D. I. (2002). An inducible activator
produced by Serratia proteamaculans strain and its soybean
growth-promoting activity under greenhouse conditions. Journal
(a)
(e)
(d)
(h) (b)
(f)
(c)
Spectral reflectance indices with peanut cultivars
of Experimental Botany, 53, 1495-1502. http://dx.doi.org/10.1093/ jexbot/53.373.1495.
Barnes, E. M., Clarke, T. R., Richards, S. E., Colaizzi, P. D., Haberland,
J. and Kostrzewski, M. (2000). Coincident detection of crop water
stress, nitrogen status and canopy density using ground-based
multispectral data. Proceedings of the 5th International Conference
on Precision Agriculture, Bloomington, MN, USA.
Barik, A. K., Mukherjee, A. K. and Mendal, B. K. (1998). Growth and
yield of Sorghum (Sorghum bicolor L.) and groundnut (Arachis
hypogaea L.) grown as sole and intercrops under different regimes.
Indian Journal of Agronomy, 43, 27-32.
Bonfil, D. J., Karnieli, A., Raz, M., Mufradi, I., Asido, S., Egozi, H.,
Hoffman, A. and Schmilovitch, Z. (2005). Rapid assessing of
water and nitrogen status in wheat flag leaves. Journal of Food,
Agriculture & Environment, 3, 148-153.
El-Hendawy, S., Al-Suhaibani, N., Salem, A., Ur Rehman, S.
and Schmidhalter, U. (2015).Spectral reflectance indices as a
rapid nondestructive phenotyping tool for estimating different
morphophysiological traits of contrasting spring wheat germplasms
under arid conditions. Turkish Journal of Agriculture and Forestry,
39, 572-587. http://dx.doi.org/10.3906/tar-1406-164.
Elsayed, S., Elhoweity, M. and Schmidhalter, U. (2015a). Normalized
difference spectral indices and partial least squares regression
to assess the yield and yield components of peanut. Australian
Journal of Crop Science, 9, 976-986.
Elsayed, S., Mistele, B. and Schmidhalter, U. (2011). Can changes
in leaf water potential be assessed spectrally? Functional Plant
Biology, 38, 523-533. http://dx.doi.org/10.1071/FP11021.
Elsayed, S., Rischbeck, P. and Schmidhalter, U. (2015b). Comparing
the performance of active and passive reflectance sensors to
assess the normalized relative canopy temperature and grain yield
of drought-stressed barley cultivars. Field Crops Research, 177,
148-160. http://dx.doi.org/10.1016/j.fcr.2015.03.010.
Erdle, K., Mistele, B. and Schmidhalter, U. (2011). Comparison of
active and passive spectral sensors in discriminating biomass
parameters and nitrogen status in wheat cultivars. Field Crops
Research, 124, 74-84. http://dx.doi.org/10.1016/j.fcr.2011.06.007.
Erdle, K., Mistele, B. and Schmidhalter, U. (2013). Spectral
assessments of phenotypic differences in spike development
during grain filling affected by varying N supply in wheat. Journal
of Plant Nutrition and Soil Science, 176, 952-963. http://dx.doi. org/10.1002/jpln.201300247.
Erisman, J. W., van Grinsven, H., Leip, A., Mosier, A. and Bleeker,
A. (2010). Nitrogen and biofuels: an overview of the current state
of knowledge. Nutrient Cycling in Agroecosystems, 86, 211-223.
http://dx.doi.org/10.1007/s10705-009-9285-4.
Fu, Y., Yang, G., Wang, J., Song, X. and Feng, H. (2014). Winter
wheat biomass estimation based on spectral indices, band depth
analysis and partial least squares regression using hyperspectral
measurements. Computers and Electronics in Agriculture, 100,
51-59. http://dx.doi.org/10.1016/j.compag.2013.10.010.
Furbank, R. T. and Tester, M. (2011). Phenomics – technologies to
relieve the phenotyping bottleneck. Trends in Plant Science, 16,
635-644. http://dx.doi.org/10.1016/j.tplants.2011.09.005.
Gutiérrez, M., Reynolds, M. P., Raun, W. R., Stone, M. L. and Klatt,
A. R. (2010). Spectral water indices for assessing yield in elite
bread wheat genotypes in well irrigated, water stressed, and high
temperature conditions. Crop Science, 50, 197-214. http://dx.doi. org/10.2135/cropsci2009.07.0381.
Li, F., Mistele, B., Hu, Y., Chen, X. and Schmidhalter, U. (2014).
Reflectance estimation of canopy nitrogen content in winter wheat
using optimized hyperspectral spectral indices and partial least
squares regression. European Journal of Agronomy, 52, 198-209.
http://dx.doi.org/10.1016/j.eja.2013.09.006.
Mekhemar, G. A. A., Shaaban, M., Ragab, A. A. and Biomy,
A. M. M. (2005). Response of faba bean to inoculation with
Rhizobium leguminosarum bv. Viceae and plant growth
promoting rhizobacteria under newly reclaimed soils. Journal
of Applied Sciences, 20, 126-144.
Mistele, B. and Schmidhalter, U. (2008). Estimating the nitrogen
nutrition index using spectral canopy reflectance measurements.
European Journal of Agronomy, 29, 184-190. http://dx.doi. org/10.1016/j.eja.2008.05.007.
Mistele, B. and Schmidhalter, U. (2010). Tractor-based quadrilateral
spectral reflectance measurements to detect biomass and total
aerial nitrogen in winter wheat. Agronomy Journal, 102, 499-506.
http://dx.doi.org/10.2134/agronj2009.0282.
R Foundation for Statistical Computing (2013). R-3.0.2 for Windows
(32/64 bit); [accessed 2017 Jan 4]. https://cran.r-project.org/bin/
windows/base/old/3.0.2/
Rischbeck, P., Baresel, J. P., Elsayed, S., Mistele, B. and Schmidhalter,
U. (2014). Development of a diurnal dehydration index for spring
Robson, A., Wright, G. and Phinn, S. (2004). Assessment of peanut
crop maturity and yield forecasting with quick bird multispectral
satellite imagery. Spatial Science Queensland, 4, 35-37.
Schmidhalter, U., Jungert, S., Bredemeier, C., Gutser, R., Manhart,
R., Mistele, B. and Gerl, G. (2003). Field-scale validation of a tractor
based multispectral crop scanner to determine biomass and
nitrogen uptake of winter wheat. Precision Agriculture, 615-619.
Sharabian, R. V., Noguchi, N. and Ishi, K. (2014). Significant
wavelengths for prediction of winter wheat growth status and
grain yield using multivariate analysis. Engineering in Agriculture,
Environment and Food,7, 14-21. http://dx.doi.org/10.1016/j. eaef.2013.12.003.
Tilak, K. V. B. R., Ranganayaki, N., Pal, K. K., De, R., Saxena, A.
K., Nautiyal, C. S., Mittal, S., Tripathi, A. K. and Tohri, B. N. (2005).
Diversity of plant growth and soil health supporting bacteria.
Current Science, 89, 136-150.
Townsend, P. A., Foster, J. R., Chastain, R. A. and Currie, W. S. (2003).
Application of imaging spectroscopy to mapping canopy nitrogen
in the forests of the central Appalachian Mountains using Hyperion
and AVIRIS. IEEE Transactions on Geoscience and Remote Sensing,
41, 1347-1354. http://dx.doi.org/10.1109/TGRS.2003.813205.
Verma, J. P., Yadav, J., Tiwari, K. N. and Singh, V. (2010). Impact
of plant growth promoting rhizobacteria on crop production.
International Journal of Agricultural Research, 5, 954-983. http:// dx.doi.org/10.3923/ijar.2010.954.983.
Vincent, J. M. (1970). A manual for the practical study of the
root nodule bacteria. IBP, Hand Book No. 15. Oxford: Blackwell
Publishers.
Walter, A., Studer, B. and Kölliker, R. (2012). Advanced phenotyping
offers opportunities for improved breeding of forage and turf
species. Annals of Botany, 110, 1271-1279. http://dx.doi.org/10.1093/ aob/mcs026.
Weber, V. S., Araus, J. L., Cairns, J. E., Sanchez, C., Melchinger, A.
E. and Orsini, E. (2012). Prediction of grain yield using reflectance
spectra of canopy and leaves in maize plants grown under different
water regimes. Field Crops Research, 128, 82-90. http://dx.doi. org/10.1016/j.fcr.2011.12.016.
Winterhalter, L., Mistele, B. and Schmidhalter, U. (2012). Assessing
the vertical footprint of reflectance measurements to characterize
nitrogen uptake and biomass distribution in maize canopies.