dEvEloPmENt of macaw Palm
leonardo duarte Pimentel(1)*, claudio Horst Bruckner(1), Hermínia Emília Prieto
martinez(1), sérgio yoshimitsu motoike(1), Candida Elisa Manfio(2) and rafael
carlos dos santos(3)
(1) Universidade Federal de Viçosa, Departamento de Fitotecnia, Viçosa, Minas Gerais, Brasil. (2) Universidade de Cruz Alta, Cruz Alta, Rio Grande do Sul, Brasil.
(3) Universidade Federal de Viçosa, Departamento de Fitotecnia, Programa de Pós-graduação em Fitotecnia, Viçosa, Minas Gerais, Brasil. * Corresponding author.
E-mail: [email protected]
aBstract
the economic exploitation of macaw palm [Acrocomia aculeate (Jacq.) lodd. ex mart.] is currently in transition, from extractivism to agricultural cultivation, thus requiring studies on the fertilization of the crop. this study evaluated the response of three genotypes of
macaw palm to increasing rates of nitrogen and potassium, grown in the field until the 2nd year and to establish reference contents of mineral nutrients in the leaf. the experiment
was a split-plot randomized block design with five main treatments (N and K rates) and
three secondary treatments (genotypes), with three replications, each plot containing three plants. Plant height, leaf number, vigor, and nutrient contents in leaf tissues were evaluated at the end of 2nd year of cultivation. differential responses were observed among genotypes, indicating that some genotypes are more efficient in the use of mineral inputs. There was a differentiated and positive response to increasing side-dressed N and K rates in the vegetative
development of macaw genotypes until the 2nd year of field cultivation, indicating variability in the species in terms of nutrient use efficiency. The N and K fertilization rate corresponding to 360 g N + 480 g K2o per plant, in four split applications over the two years of cultivation, was insufficient to induce maximum vegetative development in the three macaw genotypes.
there was no variation in macro- and micronutrient contents in leaf dry matter of the three macaw genotypes.
Keywords: Acrocomia aculeata, side-dressing fertilization, macaw palm, leaf mineral
nutrient content.
iNtroductioN
Macaw palm [Acrocomia aculeata (Jacq.) Lodd. ex Mart.] is a naturally occurring oil palm in almost the entire territory of Brazil. Its productive potential can be compared with the oil palm (Elaeis guineensis
Jacq.), which is the crop with highest oil yield and contributes to increase the proportion of vegetable oil produced worldwide (Corley and Tinker, 2003). In
this context, macaw was identified as strategic crop
to increase and diversify the production of vegetable oil, with a view to meet the demand for biodiesel (Motoike and Kuki, 2009; Pires et al., 2013).
Nearly all cumulative knowledge about this plant is compiled in studies addressing natural stands and restricted primarily to the evaluation of fruit production and oil quality (Scariot et al., 1991; Pimentel et al., 2011; Abreu at al., 2012; Pires et al., 2013). On the other hand, to establish macaw palm as raw material for biodiesel production, the trees must be grown and studied in agricultural environments. Several public and private institutions have dedicated efforts to the study of this crop, but the data of cultivated palm
stands are still partial. Most field experiments were
initiated after the laboratory germination process was developed in 2007 (Motoike et al., 2013). In this regard, little is known about the fertilization requirements of macaw palm.
Because the plant occurs naturally in savanna areas, there is a false impression that macaw palm is undemanding in terms of soil fertility. The natural occurrence of macaw palm trees in the State of Minas Gerais in relation with diagnostic
soil properties was analyzed by Motta et al. (2002); these authors observed that the presence of native macaw palm is associated with eutrophic soils, in which P levels are median and K levels high. Ares et al. (2003) studied the response of peach palm (Bactris gasipaes Kunth) to fertilization with N-P-K fertilizer and the nutritional status in soils of Central Amazonia, and found that plant growth of unfertilized trees was stunted, compared to trees treated with mineral fertilization. These studies indicate that the native palms are responsive to soil fertility, as similarly observed for cultivated palm trees, e.g., oil palm and coconut (Sobral, 1998; Viégas and Botelho, 2000).
Although palm trees developed in tropical soils and are tolerant to soil acidity and low fertility, fertilization is necessary for a sustainable production in agricultural systems. The continuous growth of coconut (Cocus nucifera L.) results in the removal of large quantities of nutrients that need to be replenished by fertilization (Sobral and Leal, 2005). The nutrients extracted from the soil at highest quantities by palms are mostly nitrogen and potassium (Pillai and Davis, 1963; Ouvrier, 1984; Corley and Tinker, 2003; Sobral and Leal, 2005). Ollivier et al. (1999) evaluated the nutritional status of commercial coconut plantations in New
Guinea and also identified N and K as the most
yield-limiting elements of this palm tree.
However, no data can be found in the literature on the nutrient demand and fertilization of macaw palm. The assessment of the response of this plant to different fertilization levels and information for the development of a fertilizer recommendation for RESUMO: EfEito dE dosEs CrEsCEntEs dE nitrogênio E Potássio no
dEsEnvolvimEnto iniCiAl dA mACAúBA
A exploração econômica da macaúba [Acrocomia aculeata (Jacq.) lodd. ex mart.] está passando por processo de transição do extrativismo para cultivos agronômicos, o que requer estudos com adubação para a cultura. objetivaram-se avaliar a resposta de três acessos de macaúba a doses crescentes de nitrogênio e potássio, cultivados até o segundo ano no campo; e obter um referencial para os teores de nutrientes minerais na folha. o experimento foi montado em parcelas subdivididas, no delineamento em blocos casualizados, com cinco tratamentos principais nas parcelas (doses de n e K) e três tratamentos secundários nas subparcelas (acessos), com três repetições, cada parcela contendo três plantas. Ao final do segundo ano de cultivo, foram avaliados: altura de plantas, número de folhas, vigor e teores de nutrientes minerais nos tecidos foliares. observou-se resposta diferenciada entre os acessos avaliados, indicando que existem genótipos mais eficientes no uso dos insumos minerais. Houve resposta diferenciada e positiva a doses crescentes de adubação com n e K em cobertura no desenvolvimento vegetativo de acessos de macaúba até o segundo ano de cultivo no campo, indicando que há variabilidade na espécie quanto à eficiência nutricional. A dose de fertilização com N e K correspondente a 360 g de N + 480 g de K2o por planta, aplicada em quatro parcelamentos durante os dois anos iniciais do cultivo, foi insuficiente para alcançar o desenvolvimento vegetativo máximo dos três acessos de macaúba avaliados. não houve variação nos teores de macro e micronutrientes na matéria seca das folhas de macaúba dos três acessos avaliados. Palavras-chave: Acrocomia aculeata, adubação de cobertura, cultivo agrícola, teor de nutriente mineral
this species are therefore essential in support of commercial cultivation.
This study evaluated the response of three macaw
genotypes, grown in the field until the 2nd year, to five N and K fertilizer rates, and proposed reference
values of the mineral nutrient leaf concentrations of cultivated palm stands.
matErial aNd mEtHods
The study was carried out at the Experimental Station of Araponga, MG, of the Universidade Federal de Viçosa (UFV; 20° 39’ 16.63” S and 42° 31’ 59.40” w). The soil of the experimental area was classified as latossolo vermelho-Amarelo,
according to Embrapa (2006), an Oxisol (Soil Survey Staff, 2014). The experimental area was located in the upper third of a slope (mean declivity approximately 25 %), previously used as natural pasture with low fertility, without records of previous crop cultivation at the site (Table 1).
The experiment was arranged in a split-plot
randomized block design with five main treatments in
plots (increasing N and K rates) and three secondary treatments in subplots (macaw palm genotypes) in three blocks, each plot containing three plants. For each crop row, a border line was established, in which the plants were not side-dressed.
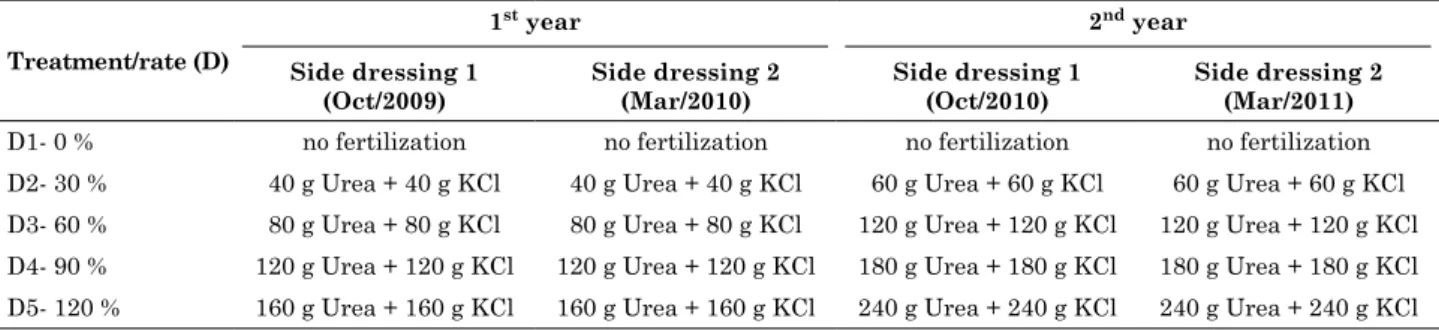
The main treatments were: T1 = no N and K side-dressing (control); T2 = side-dressing with 30 % of the estimated N and K rates; T3 = side-dressing with 60 % of the estimated N and K rates; T4 = side-dressing with 90 % of the estimated N and K rates; T5 = side-dressing with 120 % of the estimated N and K rates (Table 2).
The estimated N and K reference rates (100 %) applied per cultivated hectare of macaw palm, were based on the mean fertilizer recommendations for cultivated palm trees: coconut (Cocus nucifera), oil palm (Elaeis guineenses) and peach palm (Bactris gasipaes) (Sobral, 1998; Viégas and Botelho, 2000; Fonseca et al., 2008). Then, the mean estimated values per ha (100 %) were converted to increasing percentage levels: 0, 30, 60, 90, and 120 %.
The secondary treatments consisted of macaw genotypes from three regions of the State of Minas Gerais: Central region, municipality of Betim (genotype 1); Zona da Mata, municipality of Piranga (genotype 2); and Campos das Vertentes, municipality of Barroso (genotype 3); representing three macaw populations.
Eight-month-old seedlings were planted in
the field at the end of the rainy season, at a plant
spacing of 5 × 5 m (density 400 plants ha-1).
Fertilization at the plant base was carried out and
a first side-dressing, identical for all treatments, to
establish the crop in the field as follows: 400 g of
superphosphate plus 200 g limestone per seedling at planting, followed by 40 g urea, 40 g KCl and 25 g borax side-dressed per plant, 30 days after planting. At the beginning of the following rainy season, the fertilizer rate treatments (side-dressed N and K rates) were applied. Each year, two fertilization applications were side-dressed, one at the beginning and the other at the end of the rainy season (Table 2). At the end of the 2nd year of cultivation, the following
characteristics were assessed: plant height, leaf number and plant vigor; and the chemical properties: leaf contents of mineral nutrients. To enable statistical analysis by linear regression, the
fertilizer rates applied in side-dressing in the first
and second years were tallied, generating a value in grams that expresses the amount of applied N plus K (Table 3).
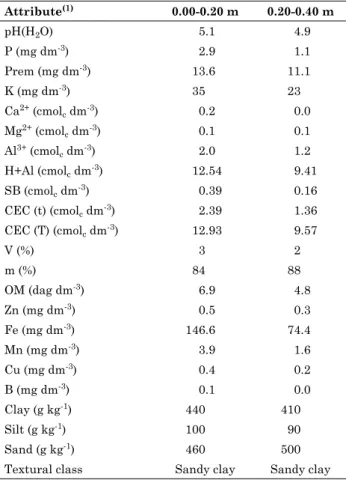
table 1. Physical and chemical analysis of the soil
in the experimental area, evaluating five N and K rates and three macaw genotypes, at the
Experimental station of araponga, mg
attribute(1) 0.00-0.20 m 0.20-0.40 m
pH(H2O) 5.1 4.9
P (mg dm-3) 2.9 1.1
Prem (mg dm-3) 13.6 11.1
K (mg dm-3) 35 23
Ca2+ (cmol
c dm-3) 0.2 0.0
Mg2+ (cmol
c dm-3) 0.1 0.1
Al3+ (cmol
c dm-3) 2.0 1.2
H+Al (cmolc dm-3) 12.54 9.41 SB (cmolc dm-3) 0.39 0.16 CEC (t) (cmolc dm-3) 2.39 1.36 CEC (T) (cmolc dm-3) 12.93 9.57
V (%) 3 2
m (%) 84 88
OM (dag dm-3) 6.9 4.8
Zn (mg dm-3) 0.5 0.3
Fe (mg dm-3) 146.6 74.4
Mn (mg dm-3) 3.9 1.6
Cu (mg dm-3) 0.4 0.2
B (mg dm-3) 0.1 0.0
Clay (g kg-1) 440 410
Silt (g kg-1) 100 90
Sand (g kg-1) 460 500
Textural class Sandy clay Sandy clay (1) P, K, Fe, Zn, Mn, Cu: extractor Mehlich-1; Ca2+, Mg2+, Al3+: extractor KCl 1 mol L-1; H+Al: extractor calcium acetate 0.5 mol L-1, pH 7.0; B: extractor hot water; S: extractor monocalcium
Plant height was measured with a ruler consisting of PVC pipe, graded in 0.10 m intervals. The height was measured from the apex of the youngest leaf to the ground level. The number of leaves was counted
from leaf 1 (first open leaf immediately below the
youngest leaf). The plant vigor was assessed on a 1-5 rating scale, where 1 represented very low plant vigor and 5 very high vigor. To evaluate the leaf
nutrient contents, the first fully expanded leaf from
the apex was used as index leaf (corresponding to
leaf 2 or 3 in this experiment). About 20 leaflets were
collected from either side of the midrib of the leaf in the three plants of the plot, to compose composite samples. Then the samples were dried at 72 °C for 72 h, ground and homogenized to determine the mineral nutrient contents by the following methods: N by titration (Kjeldahl method) after sulfuric acid digestion; B, S and P by nitro-perchloric digestion
and colorimetric quantification; K by nitro-perchloric digestion and quantification by flame photometry;
Ca, Mg, Fe, Cu, Zn, and Mn by nitro-perchloric
digestion and quantification by atomic absorption
spectrophotometry; and Cl by hot water extraction for 1 h, followed by titration with silver nitrate.
The leaf number and plant vigor values were
transformed by equation x’ = √x + 1 to approach
normal distribution, where x’ is the transformed value and x the original value; together with plant height data, these values were subjected to analysis
of variance. For comparison among genotypes, the Tukey test was used at 5 % probability. For the quantitative variables (rates), the data were
subjected to regression analysis and fit to polynomial
(linear or quadratic) equations, according to the
significance of the regression parameters of the t test and the adjusted coefficient of determination (R2).
To this end, software SAEG, version 9.1 (SAEG, 2007) was used.
rEsults
There was a significant effect of fertilizer rates
(plot) on all variables (plant height, plant vigor and leaf number - Figure 1). The response to all fertilizer levels was positive, whereas the peak of the curve was not reached in the experimental period, i.e., the maximum N and K fertilizer rates above which plants are no longer responsive to fertilization.
Difference among genotypes (subplots) was also observed in all response variables (plant height, plant vigor and leaf number), and the best development in the genotype from Barroso, with best performance for all characteristics (Figure 2).
In the study of interactions between rate and genotypes, the partitioning of the effect of fertilizer
Table 2. Side-dressing of N and K per macaw palm tree grown for two years of cultivation, at the
Experimental station of araponga, mg
treatment/rate (d)
1st year 2nd year
side dressing 1 (oct/2009)
side dressing 2 (mar/2010)
side dressing 1 (oct/2010)
side dressing 2 (mar/2011)
D1- 0 % no fertilization no fertilization no fertilization no fertilization D2- 30 % 40 g Urea + 40 g KCl 40 g Urea + 40 g KCl 60 g Urea + 60 g KCl 60 g Urea + 60 g KCl D3- 60 % 80 g Urea + 80 g KCl 80 g Urea + 80 g KCl 120 g Urea + 120 g KCl 120 g Urea + 120 g KCl D4- 90 % 120 g Urea + 120 g KCl 120 g Urea + 120 g KCl 180 g Urea + 180 g KCl 180 g Urea + 180 g KCl D5- 120 % 160 g Urea + 160 g KCl 160 g Urea + 160 g KCl 240 g Urea + 240 g KCl 240 g Urea + 240 g KCl
Table 3. Nutrients (N and K) applied in the first two years of development of macaw palm trees grown at
the Experimental station of araponga, mg
treatment (rate)
side dressing(1) (1st and 2nd year)(2)
applied nutrient (1st and 2nd year)
total applied
nutrients Ratio N/K
urea KCl N K2o N+K2o N K2o
g per plant
D1 0 0 0 0 0 0.00 0.00
D2 200 200 90 120 210 0.43 0.57
D3 400 400 180 240 420 0.43 0.57
D4 600 600 270 360 630 0.43 0.57
D5 800 800 360 480 840 0.43 0.57
(1) Commercial fertilizer applied - 45 % N - ureia; 60 % K
rates within genotypes showed that, for the variable plant height, plants of the genotype from Piranga
performed differently, fitting to the quadratic model, while the behavior of the other genotypes fitted
to the linear model. For the variable plant vigor, the behavior among genotypes was similar, with superior performance in plant development of the genotype from Barroso again. with regard to leaf number, the curve of the genotype from Barroso was different from the others, but the leaf number of all genotypes tended to increase in response to higher
N and K rates. This higher leaf number indicates earlier development in palm trees.
The partitioning of the effects of the interactions genotype - fertilizer rate showed that the genotype from Barroso had a taller plant height, higher plant vigor and greater leaf number at the lower rates (0 and 210 g N+K per plant). At higher rates, the genotypes performed similarly for leaf number and plant vigor, without differing from each other, while the genotype from Betim was shorter than the others (Figure 2).
figure 1. Plant height (a), plant vigor (b) and leaf number (c) of macaw palm plants in response to
five side-dressed N and K rates, estimated in the second year of field cultivation. **: significant
at 1 % by the t test.
(a)
(b)
(c)
Plant height (cm)
ŷ = 145.59 + 0.095** x R² = 0.92 250.0
215.0
180.0
145.0
110.0
75.0
Leaf number
Plant vigor
ŷ = 3.06 + 0.0004** x R² = 0.92
ŷ = 1.89 + 0.00049** x R² = 0.94
Rate of N+K2O (g per plant) 3.6
3.4
3.2
3.0
2.8
2.6
2.5
2.3
2.1
1.9
1.7
1.5
0 200 400 600 800
figure 2. Plant height (a), plant vigor (b) and leaf number (c) of plants of three macaw genotypes in the second year of field cultivation in
response to N+K rates. **: significant at 1 % by
the t test.
ŷ (Barroso) = 197.55 + 0.065** x R² = 0.92 (a)
(b)
(c)
Plant height (cm)
ŷ (Betim) = 110.77 + 0.11* x R² = 0.84
ŷ (Piranga) = 120.34 + 0.19 x - 0.000092* x² R² = 0.99
ŷ (Betim) = 2.93 + 0.00056* x R² = 0.75 ŷ (Piranga) = 2.93 + 0.00057** x R² = 0.87
ŷ (Barroso) = 3.4 + 0.022 x0.5 0.000799** x R² = 0.96
ŷ (Betim) = 1.72 + 0.00064** x R² = 0.88 ŷ (Piranga) = 1.82 + 0.00054** x R² = 0.95 ŷ (Barroso) = 2.12 + 0.00028** x R² = 0.99 250.0
215.0
180.0
145.0
110.0
75.0
Leaf number
Plant vigor
Rate of N+K2O (g per plant)
3.6
3.4
3.2
3.0
2.8
2.6
2.5
2.3
2.1
1.9
1.7
1.5
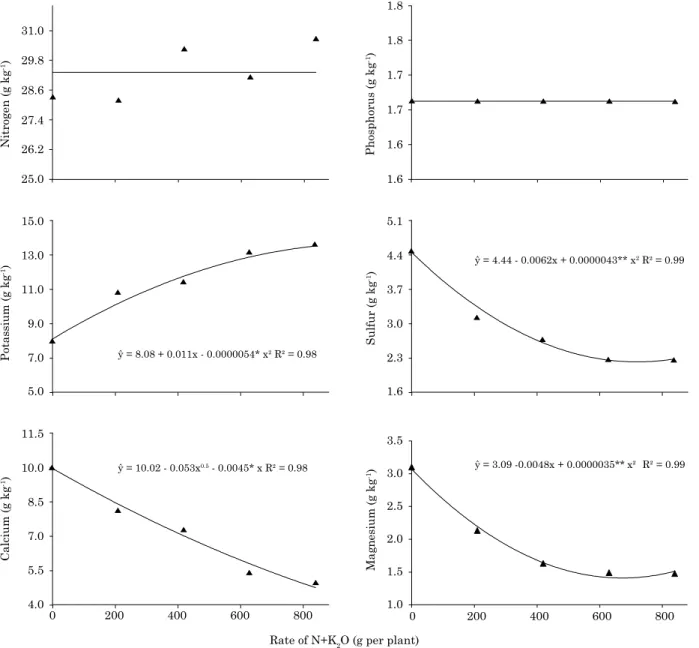
In terms of leaf contents of mineral nutrients, no effect of genotype or the interaction fertilizer rate - genotype was observed. However, an effect of N and K rates on K, Ca, Mg, S, Zn, Mn, and Cu contents was detected (Figures 3 and 4). The N,
P, Cl, B, and Fe leaf contents did not fit the tested
regression models. The means of the mineral
nutrient contents in treatment five, with best plant
development for the three genotypes in the 2nd year of field cultivation, as evidenced by taller plant
height, higher leaf number and greater plant vigor (Figure 1), were: 30.70; 1.67; 13.64; 4.94; 1.48; 2.26; 3.67 g kg-1 of N, P, K, Ca, Mg, S, and Cl, respectively,
and; 39.28; 4.00; 11.33; 126.89; 30.22 mg kg-1 Cu, Zn,
Fe, and Mn, respectively, in leaf 2 and 3 (Figure 4).
discussioN
An increasing plant response to higher fertilizer levels was observed in all treatments (Figure 1). It was however not possible to determine the rate of maximum response in the studied range of
regressions. Rate five, corresponding to 120 % of
Figure 3. Variation in mineral nutrients contents of macaw plants grown in the field for two years, in response to five side-dressed N and K rates. For N, P, and Ca, effect of rate was not significant by the t test, at 5 %; for K, S and Mg, ** and * indicate significance of the regression coefficient at 1 and 5 %
by the t test, respectively.
Nitrogen (g kg
-1)
Phosphorus (g kg
-1)
Sulfur (g kg
-1)
31.0
29.8
28.6
27.4
26.2
25.0
Potassium (g kg
-1)
Calcium (g kg
-1)
Rate of N+K2O (g per plant) 15.0
13.0
11.0
ŷ = 8.08 + 0.011x - 0.0000054* x2 R² = 0.98
9.0
7.0
5.0
11.5
10.0
8.5
7.0
5.5
4.0
0 200 400 600 800
1.8
1.8
1.7
1.7
1.6
1.6
5.1
4.4
3.7
ŷ = 4.44 - 0.0062x + 0.0000043** x2 R² = 0.99
ŷ = 10.02 - 0.053x0.5 - 0.0045* x R² = 0.98
3.0
2.3
1.6
ŷ = 3.09 -0.0048x + 0.0000035** x² R² = 0.99
1.0 1.5 2.0 2.5 3.0 3.5
0 200 400 600 800
Ma
gn
es
iu
m
(g kg
the mean fertilizer recommendations applied per hectare for coconut, oil palm and peach palm, was probably underestimated for macaw palm. A likely explanation would be the dilution of fertilizer per plant, since coconut and oil palm are planted at a density of 200 and 175 plants ha-1, respectively. For
macaw palm, the density is 400 plants ha-1, which
tends to reduce the N and K rate per plant by half. In comparison, the genotype from Barroso had a better vegetative growth than others (Figure 2), indicating best regional adaptation. One should however remember plants were assessed in the 2nd
year after planting, in the juvenile stage. Therefore, the assessment of fruit and oil yield was not addressed in this paper. A striking characteristic in this experiment was the slow initial plant growth, which can be explained by the wild character of
the (non-domesticated) species. In the first year of
cultivation, there was practically no visual difference between treatments, although the genotype from Barroso was apparently superior from the seedling phase onwards, which may have contributed to the better performance of this genotype under
field conditions. This slow initial growth has been
observed in commercial macaw plantations until the
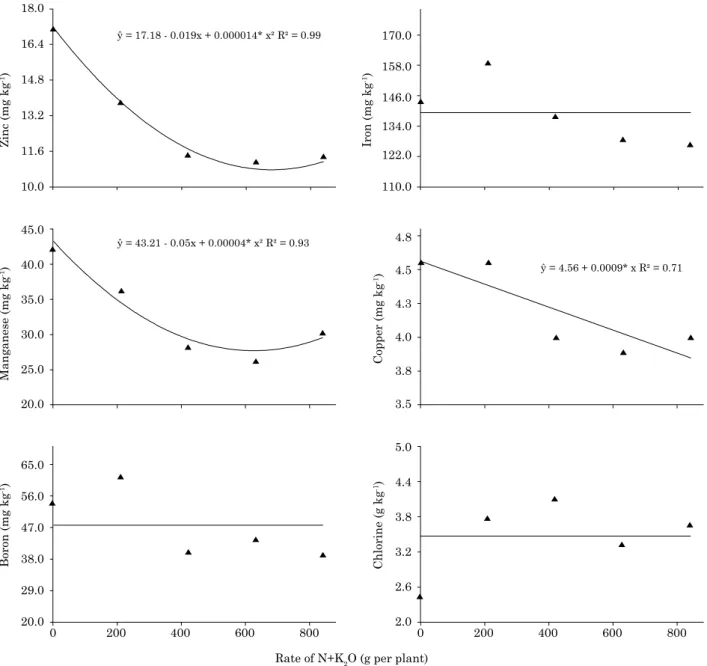
Figure 4. Variation in mineral nutrients contents of macaw plants grown in the field for two years, in response to five side-dressed N and K rates. For B and Fe, effect of rate was not significant by the t test, at 5 %; for Cu, Mn, Mo and Cl, ** and * indicate significance of the regression coefficient at 1 and
5 % by the t test, respectively.
Zinc (mg kg
-1)
Iron (mg kg
-1)
Copper (mg kg
-1)
Chlorine (g kg
-1)
18.0
16.4
14.8
13.2
11.6
10.0
Manganese (mg kg
-1)
Boron (mg kg
-1)
Rate of N+K2O (g per plant) 45.0
40.0
35.0
ŷ = 43.21 - 0.05x + 0.00004* x² R² = 0.93 ŷ = 17.18 - 0.019x + 0.000014* x² R² = 0.99
30.0
25.0
20.0
65.0
56.0
47.0
38.0
29.0
20.0
0 200 400 600 800
170.0
158.0
146.0
134.0
122.0
110.0
4.8
4.5
4.3
ŷ = 4.56 + 0.0009* x R² = 0.71
4.0
3.8
3.5
5.0
4.4
3.8
3.2
2.6
2.0
2nd year of growth. After this period, plant growth
is usually exponential until the end of the juvenile stage, normally in the 5th year after planting in the field (Motoike et al., 2013). However, more research
is needed on the subject to investigate the growth stages of the species.
Analyzing the effect of the partitioning of interactions genotype within fertilizer rate, higher plant height, vigor and a greater leaf number were observed at the lower rates (0 and 210 g N+K per plant) for the genotype from Barroso. The leaf number in juvenile palm plants indicates the phenological stage (Viégas and Botelho, 2000; Corley and Tinker, 2003). The higher the leaf number, the more advanced is the development stage, which in turn is strongly influenced by fertility, i.e., well-nourished palms are earlier. This difference in macaw genotype performance may be partly attributed to fertilization. On the other hand, it is
likely that the nutrient use efficiency of the genotype
from Barroso is higher, since the vegetative growth was superior to the others at lower fertilizer rates. At the higher rates (420, 630 and 840 g N+K per plant), the genotypes behaved similarly, with the exception of the Betim genotype, which had a shorter plant height at the highest rate (Figure 2). The nutritional
status and yield of coconut trees are influenced by
the interaction between climate, soil fertility and variety, indicating a similar performance in macaw palm, which would explain the different responses of genotypes to fertilizer rates (Ollivier et al., 1999).
For the contents of primary nutrients (N, P and K), it was observed that increasing N and K
rates influenced only K. The leaf concentrations of N and P did not fit the tested regression models.
Leaf N was probably strongly affected by soil N. In the experimental area, in spite of the low fertility (Table 1), the content of soil organic matter was high (6.9 and 4.8 % in the 0.00-0.20 and 0.20-0.40 m layers, respectively). This organic matter may have contributed to maintain high leaf N contents, even at the lowest fertilizer rates. The mean N contents in this experiment ranged from 28.3 to 30.7 g kg-1 at
the lowest and highest N and K rates, respectively. These levels are higher than those found by Pires et al. (2013), who reported leaf N contents between 21.1 (leaf 7 = lowest content) and 28.0 g kg-1 (leaf
1 = highest value), proving the hypothesis that N is supplied by organic matter. On the other hand, the mean P content was not changed in response to N rates and K (Figure 3), indicating that the P rate
applied at the plant base was sufficient to meet the
growing plant demand until the second year, with no dilution effect. Increasing N-P-K rates on coconut were tested, with no yield response to the P increase (Sobral and Leal, 2005). This suggests palms are little responsive to increasing P applications. The
increase in K leaf contents reflects the increasing
rates of this nutrient, indicating that the initial
rates were insufficient for full plant development, as
shown by the crop assessment, since the vegetative growth in response to the applied rates (Figures 1 and 2) fell short of the maximum potential. From the third rate, K leaf concentrations tended to become stable.
For the secondary macronutrients (Ca, Mg and S), the mathematical models showed a dilution effect caused by the greater vegetative growth of the plants under higher N and K rates (Figure 3). In addition, it can be inferred that the levels of these elements in the soil were underestimated. In this experiment, the fertility of the area used was low, with low Ca and Mg levels (Table 1) and liming was only applied at the plant base, not across the entire area. However, it is believed that the supply of
these elements was not deficient during the initial development phase (first two years of cultivation).
The Ca, Mg and S contents were 10.0-4.9; 3.1-1.48 and from 4.48-2.26 g kg-1, respectively. The
nutritional status of native macaw palm was studied in soil of the Cerrado region (Teles et al. 2008), resulting in mean values of Ca, Mg and S of 12.9; 1.6 and 0.4 g kg-1, respectively. Although the
mineral nutrient leaf concentrations were related to the plant age, the values in the above-cited studies were similar, and despite the dilution effect,
these elements were not deficient enough to limit
the plant development.
For the anionic micronutrients Cl and B, there was no adjustment of mathematical models to express the biological phenomenon. However, the Cl content at rate one without side-dressing (2.4 g kg-1) was significantly lower than the levels observed
at higher rates (3.78; 4.11; 3.33, and 3, 67 g kg-1 under rates, two, three, four, and five respectively)
(Figure 4). The commercial fertilizer used in the experiment as K source was potassium chloride (KCl), which justifies the increase in Cl under increasing N and K rates. However, the Cl content was relatively high compared to the other crops, but close to that observed in other palm species (Sobral, 1998; Viégas and Botelho, 2000; wijebandara and
Ranasinghe, 2004). The beneficial effect of Cl on
palms was demonstrated by Uexkull (1972), by the higher productivity in treatments with K fertilization with Cl (KCl) than in those treated with K fertilizer without Cl (KNO3), reinforcing the importance of
this element in the nutrition of palm trees. Chlorine has been reported as a complementary element in the osmotic balance of palms by Corley and Tinker (2003), for a better control of the stomatal regulation and osmotic balance within the cell vacuole. On the other hand, the B content decreased with increasing N and K rates, although it was not possible to
fit a mathematical model to the data, indicating
a dilution effect of this element. However, since fertilization at planting contained 25 g borax per
plant, a deficiency in B supply for growth and early
with regard to the cationic metal micronutrients, only Fe was not adjusted to a mathematical model to explain the biological phenomenon, although the means show a dilution trend of this element in response to the increases in N and K rates. For Zn, Mn, and Cu, as similarly observed for the secondary macronutrients, a dilution effect in leaf concentrations was also observed under increasing N and K rates (Figures 3 and 4). This dilution effect shows the importance of applying a balanced fertilizer, including the contribution of these metal micronutrients to ensure high yields, since in commercial coconut plantations, these elements are often below the critical level (wijebandara and Ranasinghe, 2004).
Despite the lack of studies on mineral nutrition of macaw, the order of magnitude of the levels of mineral nutrients was similar to that observed in other studies (Teles et al., 2008; Pires et al., 2013). On the other hand, in a study on the ecophysiological parameters of macaw palm by Pires et al. (2013), the authors observed variation in mineral contents according to the age of the sampled leaf on the plant. These authors showed that the primary macronutrient (N, P and K) contents tend to decrease with age in young leaves
of macaw plants. This indicates the difficulty of
establishing reliable benchmarks to assess the nutritional status of macaw at a given moment,
suggesting the need for studies to define the leaf index and sufficiency levels of mineral elements for
this crop. The dilution effects of Ca, Mg, S, B, Zn, Mn, and Cu would probably have been aggravated and become growth-limiting if the subsequent development stages had been evaluated.
It is noteworthy that the interactions of N and K with soil are weak, particularly the ionic bonds, for being monovalent ions. Moreover, in acid soils, these elements dissociate into positive valence ions (NH4+ and K+), facilitating their movement in the soil profile. This suggests ready availability
of these metals to plants when applied in soluble forms (fertilizers), which explains the increase in leaf contents under increasing fertilizer rates in this study. On the other hand, the plants have limited selectivity of the membranes, and an antagonistic effect on the uptake of nutrients with similar physico-chemical characteristics may occur (Marschner, 1995). In the case of high K+ contents
in the soil solution, there may be competition for absorption of other cations, such as Ca and Mg. However, plants have physiological mechanisms of adaptation to the physical and chemical variations in the environment. Thus, imbalances are only observed when the variations in soil nutrient concentrations are extreme (Ernani et al., 2007).
Nitrogen can be found in various forms in the soil. It is taken up by the plant both in anionic (NO3-) and cationic form (NH
4+), and the latter
can predominate in acidic soils with high organic matter content (Cantarella, 2007), as noted in the soil of the experimental area (Table 1). Nitrogen applied as urea can be quickly converted into NH4+, which in turn contributes to increase acidification.
In this case, the high N rates may also have contributed to the antagonistic effect observed in relation to other essential cations. Additionally, although N and K applied in this study were not
sufficient to induce maximum vegetative growth
(Figure 1), the highest amounts of N and K may have induced a nutrient imbalance in the soil, causing competitive antagonism. Therefore, it is suggested to evaluate the plant response to increasing fertilization in future studies, taking the increase of liming and micronutrient fertilization into account as well.
coNclusioNs
A differentiated and positive response to increasing side-dressed N and K fertilizer rates in the vegetative development of macaw genotypes was observed until the 2nd year of field cultivation,
indicating variability in the species in terms of
nutrient use efficiency.
Fertilization with N and K rates corresponding to 360 g N + 480 g K2O per plant, in four split
applications during the first two years of field cultivation, was insufficient to induce maximum vegetative development in the three tested macaw genotypes.
Fertilization with N and K rates induced no changes in macro- and micronutrients in leaf dry matter of the three macaw genotypes.
Leaf contents of 30.70; 1.67; 13.64; 4.94; 1.48; 2.26; 3.67 g kg-1 of N, P, K, Ca, Mg, S, and Cl,
respectively, and; 39.28; 4.00; 11.33; 126.89; 30.22 mg kg-1 of B, Cu, Zn, Fe, and Mn, respectively,
were related to a better vegetative development in
the first two years of cultivation of three macaw genotypes in the field.
ACKNOWLEDGEMENTS
rEfErENcEs
Abreu AG, Priolli RHG, Azevedo Filho JA, Nucci SM, Zucchi MI, Coelho RM, Colombo CA. The genetic structure and mating system of Acrocomia aculeata (Arecaceae). Genet Molec Biol. 2012;35:1-3.
Ares A, Falcão N, yuyama K, yost RS, Clement CR. Response to
fertilization and nutrient deficiency diagnostics in peach palm
in Central Amazonia. Nutr Cycl Agroecosyst. 2003;66:221-32. Cantarella H. Nitrogênio. In: Novais RF, Alvarez VVH, Barros NF, Fontes RLF, Cantarutti RB, Neves JCL, editores. Fertilidade do solo. Viçosa, MG: Sociedade Brasileira de Ciência do Solo; 2007. p.375-470.
Corley RHV, Tinker PB. The oil palm. 4th.ed. Oxford: Blackwell Science; 2003.
Empresa Brasileira de Pesquisa Agropecuária - Embrapa. Centro
Nacional de Pesquisa do Solo. Sistema brasileiro de classificação
de solos. Brasília, DF: 2006.
Ernani PK, Almeida JA, Santos FC. Potássio. In: Novais RF, Alvarez VVH, Barros NF, Fontes RLF, Cantarutti RB, Neves JCL, editores. Fertilidade do solo. Viçosa, MG: Sociedade Brasileira de Ciência do Solo; 2007. p.551-94.
Fonseca EBA, Moreira MA, Carvalho JG. Cultura da pupunheira (Bactris gasipaes Kunth). Lavras: Universidade Federal de Lavras; 2008.
Marschner H. Mineral nutrition of higher plants. 2nd.ed. London: Academic Press; 1995.
Motoike Sy, Carvalho M, Pimentel LD, Kuki KN, Paes JMV, Dias HCT, Sato Ay. A cultura da macaúba: implantação e manejo de cultivos racionais. Viçosa, MG: Universidade Federal de Viçosa; 2013.
Motoike Sy, Kuki KN. The potential of macaw palm (Acrocomia aculeata) as source of biodiesel in Brazil. Int Rev Chem Eng. 2009;1:632-5.
Motta PE, Curi N, Oliveira Filho AT, Gomes JBV. Ocorrência de macaúba em Minas Gerais: relação com atributos climáticos, pedológicos e vegetacionais. Pesq Agropec Bras. 2002;37:1023-31. Ollivier J, Akus w, Bonneau X. Coconut nutrition in Papua New Guinea. Coconut Res Develop. 1999;15:76-105.
Ouvrier M. Exportation par la récolte du cocotier PB-121 em function de la fumure potassique et magnésienne. Oleagineux. 1984;39:263-71.
Pillai NG, Davis TA. Exhaust of macronutrients by the coconut palm: a preliminary study. Indian Coconut J. 1963;16:81-7. Pimentel LD, Dias LAS, Paes JMV, Sato Ay, Motoike Sy. Diversidade no gênero Acrocomia e proposta de subdivisão da espécie Acrocomia aculeata. Inf Agropec. 2011;32:81-7.
Pires TP, Souza ES, Kuki KN, Motoike Sy. Ecophysiological traits of the macaw palm: A contribution towards the domestication of a novel oil crop. Ind Crops Produc. 2013;44:200-10.
Scariot A, Hay JD, Lleras E. Reproductive biology of the palm Acrocomia aculeata in Central Brazil. Biotrópica. 1991;23:12-22.
Sistema para Análises Estatísticas – SAEG. Sistema para Análises Estatísticas, Versão 9.1. Viçosa, MG: Fundação Arthur Bernardes - Universidade Federal de Viçosa; 2007.
Sobral LF, Leal MLS. Resposta do coqueiro à adubação com ureia, superfosfato simples e cloreto de potássio em dois solos do Nordeste do Brasil. R Bras Ci Solo. 2005;23:85-9.
Sobral LF. Nutrição mineral do coqueiro. In: Ferreira JMS, warnick DRN, Siqueira LA, editores. A cultura do coqueiro no Brasil. 2ª ed. Brasília, DF: Embrapa-Sistema de Pesquisa da Informação; 1998. p.129-57.
Soil Survey Staff. Keys to soil taxonomy. 12th.ed. washington, DC: United States Department of Agriculture. Natural Resources Conservation Service; 2014.
Teles HF, Rezende CFA, Leandro wM, Pires LL, Tavares PVA, Santos RASG. Teores de nutrientes em folhas de macaúba (Acrocomia aculeata) em diferentes estádios fenológicos no cerrado goiano. In: Anais do 9º Simpósio Nacional do Cerrado; 2008; Brasília, DF. Brasília, DF: Parla Mundi; 2008. p.1-6. Uexkull HR. Response of coconut to (potassium) chloride in the Philippines. Oléagineux. 1972;27:13-9.