INVESTMENT FUNDS’ PERFORMANCE AND ECONOMIC GROWTH
Apolzan Carmen Maria
West University Timisoara,
Faculty of Economics and Business Administration
In this paper we examine the performance of investment funds during the period 2006-2010, intending to comprise the portfolio performance’s dynamics before, during and after the present economic and financial crises climax. We categorize investment funds according to their investment strategy and geographical focus and distinguish a number of 11 classes. In order to analyze their returns’ dynamics, we create a fund performance index for each category using principal components method. The instability created in financial system in 2007 had a direct impact on institutional investors’ portfolios regardless of investment strategy, effects that have rapidly propagated on real economy. Analyzing index’s dynamics correlated with economic growth we conclude that financial and economic environment react in the same direction, but with a certain time delay, to instability factors. We also underline the major impact of boom and bust evolution of financial markets on real economy, cause of the current economic and financial crises.
Keywords: investment funds, portfolio performance, economic growth, crises, investment strategy JEL Classification: G20, G23, G29
Introduction
One of the important roles of institutional investors is given by the fact that they contribute to the overall efficiency of the financial sector. (Merton, Bodie, 1995) Taking into account this aspect, institutional investors also contribute to the global economic growth. The institutional investors’ role of attracting and allocating their resources induces the increase of financial market liquidity, introduction of new financial instruments and products, development of trading strategies and arbitrage and cross-border diversification of portfolios with direct effects on the economic environment. (Harichandra, K, Thangavelu, S, 2004)
One of the issues debated in the specialty literature is the strong correlation between the financial sector and the economic one, the interdependencies between these two leading to propagation of shocks occurring in any of the two environments. To analyze these interdependencies, we employ a comparative method of the institutional investors’ performance during 2006-2010 to the gross domestic product growth rate, reference to geographical area and the institutional investors’ portfolio-formation strategy.
Data
The study uses data from Thompson Reuters – Lipper database that includes information on annual returns during 2006-2010 for a total of 122.700 investment funds. To reflect the investment strategy and geographical focus, we proceeded to the selection of the following categories of institutional investors:
- Europe-oriented equity investment funds, with the total value of assets held more than 0.1 billion USD, Number of funds 469;
- U.S.-oriented equity investment funds, with the total value of assets held more than 1 billion USD, Number of funds 694;
- ASIA-oriented equity investment funds, with the total value of assets held more than 0.1 billion USD, Number of funds 365;
- Europe-oriented bond investment funds, with the total value of assets held more than 0.1 billion USD, Number of funds 146;
- ASIA-oriented bond investment funds, with the total value of assets held more than 0.1 billion USD, Number of funds 48;
- Europe-oriented mixed investment funds, with the total value of assets held more than 0.1 billion USD, Number of funds 131;
- U.S.-oriented mixed investment funds, with the total value of assets held more than 1 billion USD, Number of funds 161;
- ASIA-oriented mixed investment funds, with the total value of assets held more than 0.1 billion USD, Number of funds 34;
- global monetary funds, with the total value of assets held more than 1 billion USD, Number of funds 480;
- other types of funds, with the total value of assets held more than 1 billion USD, Number of funds 116.
Of all the entities resulting from the application of filters to each category, there were eliminated funds that do not register data for the entire period observed 2006-2010.
Methodology
In order to reflect the behavior of each group of investment funds, we create a fund performance index for each category using principal components method. Principal components analysis is a variable reduction procedure. The central idea of this analysis is to reduce the size of a set of interrelated variables, retaining as much as possible from the variation existing in the dataset observed. This procedure is used in a variety of fields, from climatology to economics, genetics, psychology and quality control (Jolliffe, 2002).
This type of analysis models the variance structure of a set of observed variables using linear combinations of the variables. These linear combinations, or components, are used in subsequent analysis, and combination coefficients (or weights) are used in interpreting these components. The principal components of a set of variables are obtained by computing the eigenvalue and decomposing the variance of the observed matrix (Johnson and Wichtern (1992)). The first principal component represents the unit-length combination of the original variables with maximum variance. Subsequent principal components maximize variance among the lengths of linear combinations that are orthogonal to the previous components.
In terms of singular value decomposition, a matrix of data (nxp) of rank r may be represented as:
Y=UDV’ (1)
U and V are orthonormal matrices of left singular and right singular vectors, and D is a diagonal matrix containing singular values.
More generally, we have:
Y = AB’ (2)
A is a (nxr) matrix and B is a (pxr) matrix, both of rank r and
(3)
=
V ! (4)So 0 ≤ α ≤ 1 is a factor that adjusts the relative weight of the left singular vector (observations) and right singular vector (variables), and the term n involving β are scaling factors where β € {0, α}
Basic options for computing the values A and the corresponding weights B imply the appropriate choice of the parameter α and the scaling parameter β.
& =
'#
! (6) =
#
! (7)A may be interpreted as the weighted values of principal components and B as the weights of principal components
Results
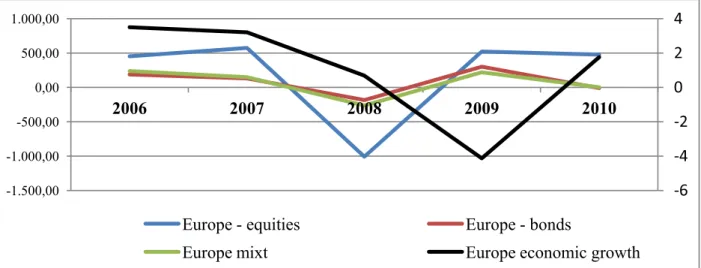
By analyzing the index dynamics for each category in relation to the economic growth dynamics, we see that institutional investors whose investment focus is Europe, the trend is that of sharp increase in the equity funds’ performance until 2007, in 2008 they registered a significant correction and reached a historical minimum. A similar dynamic is given by the fluctuation of the three indexes represented, the index of equity investment funds, bond funds and mixed funds, 2008 representing a significant decrease of the outcomes. The most important losses are registered in stock markets, which are most affected by the turbulences seen since the end of 2007, reaching a historical minimum in 2008. This phenomena can be explained by the panic created on stock markets worldwide, retail and institutional investors seeking to close their open positions on stocks based on the uncertainty of companies’ capacity to recover.
Thus, in 2008 international stock markets registered one of the most severe declines in history, international market capitalization suffered a 50% correction, initial public offerings (IPOs) were halved while total trading volume remained at a similar level of 2007. This situation was aggravated by the failure of U.S. Lehman Brothers investment bank in September 2008, an event that caused an extremely negative reaction of stock markets which in a period of about two months had a 40% correction at global level, and remained at minimal levels until the end of year. Stock market volatility remained high in 2009, when in the first two months suffered a decrease by 12%, followed by an increase of 15% starting from April 2009. The end of 2009 represented an increase of nearly 50% of market capitalization, but it is only a partial recovery of losses incurred in the previous year. In the first half of 2010, stock markets experienced a correction of about 7%, remaining well below the highs reached in 2007.
Comparing the index dynamics of investment funds and dynamics of macroeconomic indicator of economic growth, we observe a similar, but delayed behavior of the economic environment, emphasizing the significant influence of financial environment on real economy by transmitting the financial crisis in the real economy. (Figure no. 1)
Figure no. 1 Comparative dynamics of performance indexes for Europe-oriented investment funds and economic growth during 2006-2010
Source: Author’s calculations based on data provided by Thomson Reuters - Lipper, IMF database for data on economic growth
We also observe similar developments in the case of investment funds with investment horizon in the United States, although the period 2006-2007 is a slight tendency of performance index correction of all types of institutional investors observed, all indexes registering a significant decline in 2008 and a recovery since 2009. The year 2010 marked a new correction for all three indexes observed. We notice the same delayed response from the economic environment, the strong interconnections between the two causing a negative growth in 2009 (Figure 2)
Figure no. 2 Comparative dynamics of performance indexes for U.S.-oriented investment funds and economic growth during 2006-2010
Source: Author’s calculations based on data provided by Thomson Reuters - Lipper, IMF database for data on economic growth
We found an interesting evolution for investment funds whose investment area is Asia, mainly due to the dynamics of bond funds registering increased returns in 2008, their correction being highlighted only in 2009, simultaneously with economic growth correction. As far as it concerns bond market performance, we point out that volatility is lower than in equity markets.
-6 -4 -2 0 2 4
-1.500,00 -1.000,00 -500,00 0,00 500,00 1.000,00
2006 2007 2008 2009 2010
Europe - equities Europe - bonds
Europe mixt Europe economic growth
-3 -2 -1 0 1 2 3 4
-1.500,00 -1.000,00 -500,00 0,00 500,00 1.000,00
2006 2007 2008 2009 2010
as more financially stable. On the other hand, corporate bonds offered a potential increased yield during this period, reaching record levels in 2008 followed by a correction in 2009 (The City UK, 2010). The dynamics of equity and mixed funds’ indexes is similar to that of other areas, these indexes reaching a minimum in 2008, a recovery in 2009 and a new correction in 2010. (Figure no. 3)
Figure no. 3 Comparative dynamics of performance indexes for U.S.-oriented investment funds and economic growth in 2006-2010
Source: Author’s calculations based on data provided by Thomson Reuters - Lipper, IMF database for data on economic growth
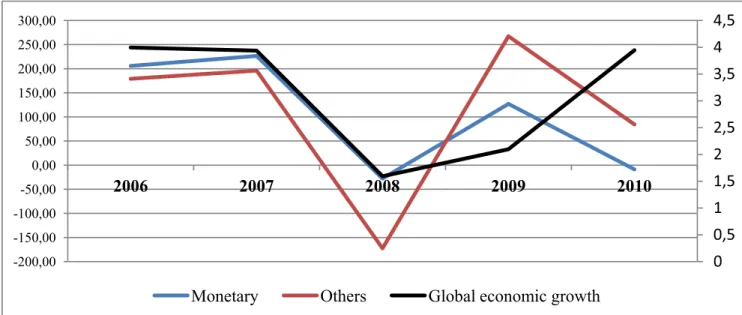
In terms of monetary funds and other funds, 2008 represents a minimum for the indexes of the two classes observed. By comparing the evolution of these investors to the global economic growth, we observe a decrease in the real economy since 2008, and a recovery in the second half of that year, this behavior corresponding over time to the general evolution of performance indexes for all selected categories of investors. Regarding the two classes presented in Figure no. 4, we highlight the sharp downward trend of performance indexes in 2010 due to the volatility created by the financial and economic instability experienced in the current period.
Figure no. 4 Comparative dynamics of performance indexes for monetary funds and other funds and economic growth in 2006-2010
0 1 2 3 4 5 6 7 8
-1.000,00 -800,00 -600,00 -400,00 -200,00 0,00 200,00 400,00 600,00 800,00
2006 2007 2008 2009 2010
Asia- equities Asia - bonds Asia mixt ASEAN 5 economic growth
0 0,5 1 1,5 2 2,5 3 3,5 4 4,5
-200,00 -150,00 -100,00 -50,00 0,00 50,00 100,00 150,00 200,00 250,00 300,00
2006 2007 2008 2009 2010
Source: Author’s calculations based on data provided by Thomson Reuters - Lipper, IMF database for data on economic growth
Conclusions
The most important aspect to note in this comparative analysis is that, as explained before, the instability created in the financial system worldwide has immediate repercussions on all institutional investors’ portfolios, regardless of their employment category. These effects have propagated to the real economy as the comparative dynamics presented clearly reflects this aspect. Therefore, we conclude that the financial environment and the real economy react in the same direction, with a certain time delay, to the moments of volatility created, pointing out the major impact of financial market dynamics, characterized by the boom and bust phenomenon, on real economy, an aspect considered as one of the causes triggering the current economic and financial crisis.
Aknowledgement
This article has been created in the project entitled „Creșterea calității și a competitivității cercetării doctorale prin acordarea de burse”, number 49516, part of the „Programul Operaţional Sectorial Dezvoltarea Resurselor Umane 2007 – 2013, Axa prioritară 1 Educaţia şi formarea profesională in sprijinul creşterii economice şi dezvoltării societăţii bazate pe cunoaştere,
Domeniul major de intervenţie 1.5 Programe doctorale şi postdoctorale în sprijinul cercetării”.
References
1. Harichandra, K, Thangavelu, S, Institutional Investors, Financial Sector Development and Economic Growth, University of Singapore, 2004
2. Johnson, Richard A., Dean W. Wichern , Applied Multivariate Statistical Analysis, Third Edi-tion, Upper Saddle River, New Jersey: Prentice-Hall, Inc., 1992
3. Jolliffe,I., T., Principal Component Analysis, Second Edition, Springer Series in Statistics, 2002
4. Merton R.C., Bodie, Z., A Conceptual Framework for Analyzing the Financial Environment in The Global Financial Systems - A Functional Perspective, Harvard Business School, 1995