25
ANALYSIS OF EFFICIENCY OF INVESTMENT
IN THE EU AGRICULTURAL FUNDS
Bojan Krstić, PhD
University of Niš, Faculty of Economics, Republic of Serbia, [email protected]
Tanja Stanišić, PhD
Researcher on the project No. 179066, [email protected]
Jelena Stanojević, MsC
Researcher on the project No. 179066, [email protected]
Abstract:
!
Keywords: agriculture, expenditures, results, indicators.
JEL classification: Q10, Q14
1. Introduction
Some very important questions in contemporary conditions, such as food production and environmental protection, place agriculture in the top priorities of modern society. Since agriculture is the backbone of the development of rural areas, there is an unbreakable relationship between the degree of agricultural development and the degree of rural development. Agriculture is the most important activity of most rural areas. Agriculture is of great importance for the way of life in rural areas and its economic development. The competitiveness of agriculture is caused by specific factors such as natural potential and the availability of fertile arable land, but also by factors such as the quality of the workforce, the quality of the organization of production, investment and modernization of the production process, sources of financing. This paper examines the role and importance of the resources provided from the European Agricultural Guarantee Fund (EAGF) and the European Agricultural Fund for Rural Development (EAFRD). We analyze efficiency of investment in the European Union agricultural funds in the member states. The importance of the European Union (EU) funds is reviewed based on examination of interdependence between agricultural expenditures and agricultural results in the EU countries. Also, the paper examines the homogeneity of the EU countries regarding allocation of the EU funds earmarked for agriculture and rural development and achieved agricultural results.
26 2. Literature Review
The absolute majority of the European Union population believes that agriculture and rural development are of great importance for the future of the community. The issues of agriculture and rural development are systematized by the Common Agricultural Policy (CAP).
The Common Agricultural Policy is the oldest policy of the European Union and this policy consists of two main pillars. The first pillar covers direct payments and market interventions, and the second pillar covers rural development. This policy has experienced many changes over time, but its key objectives essentially are unchanged. The CAP’s basic objectives are still precisely the same that was adopted in the Treaty of Rome, signed in 1957 and establishing the European Economic Community among its six original member countries in 1958 (Tangermann & Cramon:Taubadel, 2013, p. 19). Ensuring a stable income of the rural population, market stabilization and improvement of productivity and competitiveness in the food production stand out as a relatively stable objective (European Commission, 2012). Shortly, the common agricultural policy balances between enabling stable living standards of farmers and providing quality food at reasonable prices to consumers. For many years the common agricultural policy is the most important policy of the European Union. Nowadays, the CAP is a complex system of legal regulations, budgetary support and direct public intervention, which affects the state of agriculture and rural areas (Jankovic, 2009, p. 14). The latest reforms defined policy objectives for the period 2014:2020. Recent reforms emphasize the importance of rural development, small farms, and young farmers. Agriculture needs to adapt to new realities and to face challenges concerning the food safety, environmental protection, climate change, and the resurgence of the rural economy. In order to address these major challenges, the European Commission highlights the following objectives of the CAP for the period 2014:2020: a) viable food production; b) sustainable management of natural resources, and c) balanced territorial development (European Commission, 2010).
Financing in agriculture plays a significant role in carrying out of the economic activity in view of producing agricultural goods and services specific to this sector (Nanu & Buziernescu, 2008, p. 45). Financial support provided from the relevant EU funds plays a huge role in the realization of the objectives of the EU Common Agricultural Policy. State financial support to agriculture and the financial support provided from the EU funds are particularly important when agriculture needed alternative arrangements outside the finance and banking sector (Trzeciak:Duval, 2003, p. 106). The European Agricultural Guarantee Fund and the European Agricultural Fund for Rural Development are two main funds from which the European Union provides support to agriculture and rural development.
Resources of the European Agricultural Guarantee Fund are aimed to direct payments to farmers and measures regulating or supporting agricultural markets. When using the resources of this fund, Member States should: a) establish criteria to be met by farmers in order to fulfil the obligation to maintain an agricultural area, b) define the minimum activity to be carried out on agricultural areas (European Commission, 2013, p. 620). In addition to direct payments to farmers, the European Union has precisely prescribed the form and conditions of public interventions, which should contribute to the improvement of agricultural market (European Commission, 2013c).
27 territorial and environmentally balanced, climate:friendly and resilient and competitive and innovative. (European Commission, 2013b, p. 499). These funds are an important factor in achieving the objectives of the common agricultural and rural policy of the European Union.
3. Data and Methodology
The agricultural expenditures are an important category in modern conditions. Data on the absolute amount of financial resources intended for agricultural and rural development from the European funds confirms this fact. In order to evaluate the significance of agricultural expenditures of the European funds for achieving the objectives of rural development and agricultural development, interdependence between agricultural expenditures and agricultural results on a sample of the European Union countries, as well as the heterogeneity of the EU countries according to these indicators are examined in this paper. For the purpose of this research, we selected four agricultural results from the Eurostat database: Gross value added of the agricultural industry, Output of the agricultural industry, Animal output and Crop output. These results are valued at a basic price. The basic price is defined as the price received by the producer, after deduction of all taxes on products but
including all subsidies on products. " corresponds to the
value of output (at basic prices) less the value of intermediate consumption. #
is made up of the sum of the output of agricultural products, agricultural services and of the goods and services produced in inseparable non:agricultural secondary
activities. comprises sales, changes in stocks, and products used for processing
and own final use by the producers. $ comprises sales, changes in stocks, and crop
products used as animal feedingstuffs, for processing and own final use by the producers. In accordance with the objective of research, the following hypotheses are defined in this paper:
H1: There are differences between the EU countries regarding the efficiency of investment in the EU agricultural funds.
H2: The correlation between the agricultural expenditures and agricultural results in the European Union countries is positive.
H3: There is no heterogeneity among the European Union countries in terms of the agricultural expenditures and the achieved agricultural results.
Defined hypotheses are tested by using the methods of comparative analysis, correlation analysis and cluster analysis.
4. Research Results
4.1. Efficiency in investment of the EU agricultural funds
28 Table 1 ; Expenditure for agriculture and achieved results in agriculture in the European Union countries in 2012 (in million EUR)
Country E A F R D e x p en d it u re i n m il li o n eu ro E A G F e x p en d it u re i n m il li o n eu ro G ro ss v a lu e a d d ed o f th e a g ri cu lt u ra l in d u st ry ; b a si c p ri ce s O u tp u t o f th e a g ri cu lt u ra l in d u st ry ; b a si c p ri ce s A n im a l o u tp u t – b a si c p ri ce s C ro p o u tp u t – b a si c p ri ce s E ff ic ie n cy 1 E ff ic ie n cy 2 E ff ic ie n cy 3 E ff ic ie n cy 4
% & ' ( ) * +
,-(./&0'1 2-)./&0'1 %3-*./&0'1 %%-+./&0'1
Austria 535.9 744.9 2999.99 7246.29 3358.93 3233.95 2.34 5.66 2.62 2.52 Belgium 68.4 653.4 2696.47 8799.15 4769.46 3950.86 3.74 12.19 6.61 5.47 Bulgaria 306.7 425 1662.26 4423.72 1218.48 2672.89 2.27 6.05 1.67 3.65 Cyprus 19.8 46.2 332.81 719.56 339.75 347.83 5.04 10.90 5.15 5.27 Czech R. 418.9 768.9 1351.60 4860.58 1790.03 2849.85 1.14 4.09 1.51 2.40 Denmark 62.6 955.2 3595.28 11877.08 7059.66 4140.55 3.53 11.67 6.94 4.07 Estonia 325.6 91.4 360.14 898.20 383.69 428.62 0.86 2.15 0.92 1.03 Finland 302.3 552.3 1686.50 5052.80 2569.60 1856.00 1.97 5.91 3.01 2.17 France 933.1 8655.7 30136.10 76776.30 25996.00 44596.90 3.14 8.01 2.71 4.65 Germany 1311 5446.7 18261.00 55565.00 23562.00 28713.00 2.70 8.22 3.49 4.25 Greece 330.8 2416.4 5408.39 10734.60 2709.06 7017.53 1.97 3.91 0.99 2.55 Hungary 441.3 1165.4 2578.79 7498.53 2637.52 4339.45 1.61 4.67 1.64 2.70 Ireland 129.2 1293.2 1742.43 7033.48 4758.19 1915.06 1.22 4.94 3.35 1.35 Italy 1307.8 4813.9 27139.19 50512.00 16830.94 27160.79 4.43 8.25 2.75 4.44 Latvia 213.2 127.6 322.53 1326.69 460.00 750.07 0.95 3.89 1.35 2.20 Lithuania 235.2 332.1 1168.65 2972.89 917.31 1833.82 2.06 5.24 1.62 3.23 Luxembourg 10.3 35 123.75 411.59 177.65 201.58 2.73 9.09 3.92 4.45 Malta 8.9 5.6 57.06 127.96 71.17 49.32 3.94 8.82 4.91 3.40 Netherlands 102.2 927.6 9175.00 26866.72 10658.35 12790.85 8.91 26.09 10.35 12.42 Poland 2027 2847.7 9020.49 23198.35 10542.02 12036.20 1.85 4.76 2.16 2.47 Portugal 679 775.7 2311.97 6702.27 2781.99 3601.88 1.59 4.61 1.91 2.48 Romania 1101.9 1022.3 6209.14 14410.22 3992.65 9007.95 2.92 6.78 1.88 4.24 Slovakia 272.9 332.6 578.24 2397.06 959.27 1195.80 0.95 3.96 1.58 1.97 Slovenia 122 125.3 380.53 1143.52 530.64 592.59 1.54 4.62 2.15 2.40 Spain 821.1 5868.7 21329.39 41954.52 16245.06 24030.32 3.19 6.27 2.43 3.59 Sweden 293.1 715.9 1830.72 6402.11 2707.11 3038.43 1.81 6.35 2.68 3.01 U. Kingdom 734.7 3351.7 10377.63 29616.52 15900.10 11042.84 2.54 7.25 3.89 2.70
Source: http://ec.europa.eu/, http://epp.eurostat.ec.europa.eu/ and authors' calculation for the data on efficiency
Poland (2027), Germany (1311), Italy (1307.8) and Romania (1101.9) has the largest amount of EAFRD expenditure in million euro allocated in 2012. When it comes to EAGF expenditure in million euro, the largest allocations were recorded in France (8655.7), Spain (5868.7), Germany (5446.7) and Italy (4813.9). The second part of the table presents the values of selected indicators of agricultural development, or selected agricultural results. Gross value added of the agricultural industry in 2012 is the largest in France, Germany, Italy and Spain. These four countries have the largest results also when it comes to Output of the agricultural industry, Animal output and Crop output. Reviewing the empirical data shows us a certain conclusion. Namely, we observe that those countries in which is recorded the largest allocation of the EU funds, also are the countries that recorded the most favorable results in agriculture. Minimum allocations from both funds in 2012 were directed at Luxembourg, Malta and Cyprus. Luxembourg and Malta are the countries with the lowest results in terms of all four indicators of agricultural production (Gross value added of the agricultural industry, Output of the agricultural industry, Animal output and Crop output).
29 economic result (in nominator) and the amount of investment (in the denominator). We calculate the efficiency as the quotient between selected agricultural results and total amount of agricultural expenditures (EAFRD and EAGF expenditures). According to the ratio
Efficiency 1, the Netherlands is the best positioned country, followed by the Cyprus and Italy. The worst positioned countries according to this ratio are Estonia, Latvia and Slovakia. The minimum values of the ratio Efficiency 1 is 0.86, while the maximum value is 8.91. The highest value of the ratio Efficiency 2 is recorded in the Netherlands 26.09, while the lowest value of this ratio is recorded in Estonia 2.15. The Netherlands also has the highest value of the ratio Efficiency 3 10.35, while Estonia has the lowest value of this ratio 0.92. When it comes to the ratio Efficiency 4, the Netherlands is the best positioned country, followed by the Cyprus and Belgium. Estonia is again the worst positioned countries. The minimum values of the ratio Efficiency 4 is 1.03, while the maximum value is 12.42. Based on these results we can conclude that the hypothesis H1 is confirmed. There are differences between the EU countries in terms of the efficiency of investment in the EU agricultural funds.
4.2. Examining of Interdependence between Agricultural Expenditures and Agricultural Results in the EU Countries
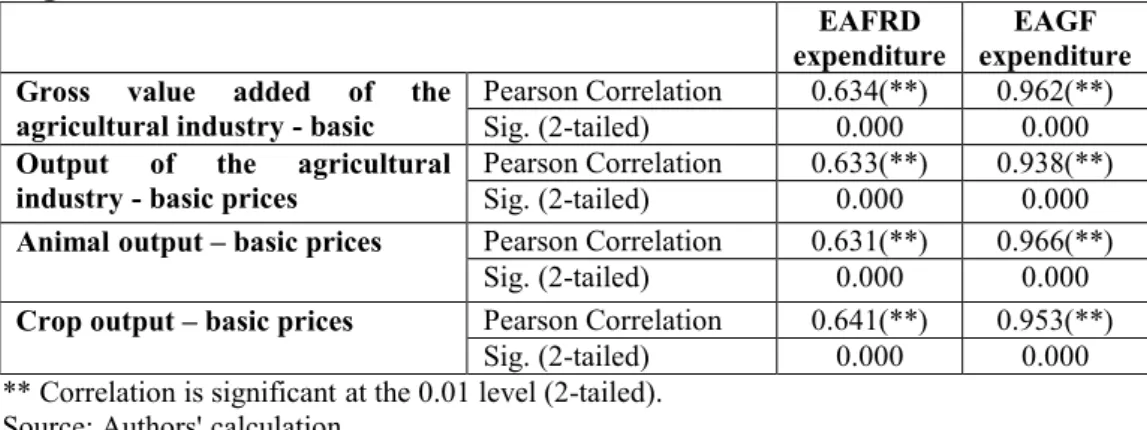
The interdependence between agricultural expenditures and four agricultural results on a sample of the European Union countries is examined by calculating of the Pearson correlation coefficient between the mentioned variables. The results of the correlation analysis are presented in Table 2.
Table 2 ; Pearson correlation coefficient between expenditure for agricultural and selected agricultural results
EAFRD expenditure
EAGF expenditure Gross value added of the
agricultural industry ; basic
Pearson Correlation 0.634(**) 0.962(**) Sig. (2:tailed) 0.000 0.000
Output of the agricultural industry ; basic prices
Pearson Correlation 0.633(**) 0.938(**) Sig. (2:tailed) 0.000 0.000
Animal output – basic prices Pearson Correlation 0.631(**) 0.966(**) Sig. (2:tailed) 0.000 0.000
Crop output – basic prices Pearson Correlation 0.641(**) 0.953(**) Sig. (2:tailed) 0.000 0.000 ** Correlation is significant at the 0.01 level (2:tailed).
Source: Authors' calculation.
30 The positive relationship between agricultural expenditures and all agricultural results indicates the great importance of this type of support that is provided from European funds for the overall agricultural and rural development.
4.3. Examining of the EU Countries Heterogeneity according to Agricultural Expenditures and Agricultural Results
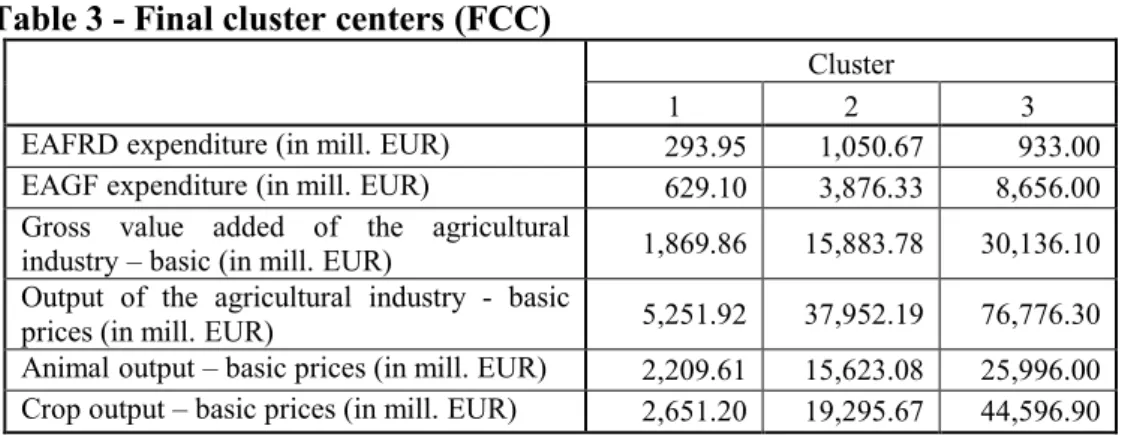
Given the high level of correlation between the agricultural expenditures and selected agricultural results, it is necessary to examine the heterogeneity of the European Union countries according to these variables using cluster analysis. Cluster analysis is the method of multivariate analysis and serves for the classification of countries according to their characteristics. The European Union countries are classified in this case, according to the agricultural expenditures and agricultural results.
The use of the final cluster centers shown in table 3 has demonstrated that countries in cluster 1 have the smallest agricultural expenditures and the smallest agricultural results. Cluster 2 includes countries with higher EAGF expenditure and agricultural results compared to cluster 1, and with the highest value of EAFRD expenditure. Finally, cluster 3 consists of the countries with the highest values of EAGF expenditure and agricultural results, and with the higher EAFRD expenditure compared to the cluster 1.
Table 3 ; Final cluster centers (FCC)
Cluster
1 2 3
EAFRD expenditure (in mill. EUR) 293.95 1,050.67 933.00 EAGF expenditure (in mill. EUR) 629.10 3,876.33 8,656.00 Gross value added of the agricultural
industry – basic (in mill. EUR) 1,869.86 15,883.78 30,136.10 Output of the agricultural industry : basic
prices (in mill. EUR) 5,251.92 37,952.19 76,776.30 Animal output – basic prices (in mill. EUR) 2,209.61 15,623.08 25,996.00 Crop output – basic prices (in mill. EUR) 2,651.20 19,295.67 44,596.90 Source: Authors' calculation.
Based on FCC analysis, we conclude that the SEE countries are divided into three fairly heterogeneous clusters according to the agricultural expenditures and results. Clusters are quite heterogeneous also according to the number of cases (countries) in each cluster (Table 4).
Table 4 ; Number of cases in each cluster Cluster
Cluster Cluster
1 20
2 6
3 1
Source: Authors' calculation.
Cluster 1 includes 20 countries, Cluster 2 includes six countries, while Cluster 3 consists of only one country. The cluster analysis of the European Union countries according to the agricultural expenditures and selected indicators determined the following structure of clusters:
Cluster 1: Austria, Belgium, Bulgaria, Cyprus, Czech Republic, Denmark, Estonia, Finland, Greece, Hungary, Ireland, Latvia, Lithuania, Luxembourg, Malta, Portugal, Romania, Slovakia, Slovenia, Sweden;
31 Based on the results presented in Table 3 and Table 4, the hypothesis H3 is rejected. There is quite heterogeneity of the EU countries according to the agricultural expenditure and agricultural results.
5. Conclusion
The great importance of agriculture and rural development is indisputable in modern conditions. Awareness of the importance becomes stronger in the EU member states, and agriculture and rural development are considered as a factor that is very significant for the future of the community. Along with these tendencies, awareness of the necessity of the existence of a stable source of financing for agriculture and rural development also becomes stronger. The allocation of the funds intended for the realization of the Common Agricultural Policy, as well as the results achieved in agriculture in the European Union are analysed in this paper. The only review of the data shows that those countries that are leading countries by the amount of funds received from the EAGF and EAFRD, also are countries that recorded the most significant results when it comes to the agricultural value added and agricultural production. There are differences between the EU countries when it comes to the efficiency of investment in the EU agricultural funds. The Netherlands is a country with the best performances, followed by the Cyprus and Belgium. The worst results in efficiency are recorded in Estonia.
In order to define a clear link between agriculture expenditures and agricultural results, the correlation analysis is carried out in the paper. Results of correlation analysis confirmed the existence of a strong positive interdependence between all the observed agricultural results (Gross value added of the agricultural industry, Output of the agricultural industry, Animal and Crop output output) and the EAGF expenditures, and the existence of a moderate positive correlation between the observed agricultural results and the EAFRD expenditures. On that basis, we conclude that the EU funds play a very important role in the agricultural and rural development in the European Union member countries. Based on cluster analysis, we have concluded that there is considerable heterogeneity of the EU countries when it comes to the amount of used resources from the EU funds, but also when it comes to agricultural results. Even 20 out of the 27 analyzed countries are located in cluster 1, cluster with the lowest performance. On the basis of this we conclude that a more balanced approach when it comes to using resources from the EU funds is needed, which would lead to a more balanced agricultural and rural development of the member countries.
6. References
1. European Commission, http://ec.europa.eu/, Accessed on October 2014
2. European Commission. (2010), “The CAP towards 2020: Meeting the food, natural resources and territorial challenges of the future”, Communication of 18 November 2010 from the Commission to the European Parliament, the Council, the European Economic and Social Committee and the Committee of the Regions (COM (2010) 672 final).
3. European Commission. (2012), “The Common Agricultural Policy, A partnership
between Europe and Farmers”, http://ec.europa.eu/agriculture/cap:
overview/2012_en.pdf, Accessed on November 2014
32 5. European Commission. (2013a), “Report from the Commission to the European
parliament and the Council”, 6th financial report from the Commission to the Council on the European Agricultural Guarantee Fund, 2012 financial year, Annexes, {COM (2013) 657 final}.
6. European Commission. (2013b), “Regulation (EU) No 1305/2013 of the European Parliament and of the Council of 17 December 2013 on support for rural development by the European Agricultural Fund for Rural Development (EAFRD) and repealing Council Regulation (EC) No 1698/2005”, Official Journal of the European Union, L 347, pp. 487:548.
7. European Commission. (2013c), “Regulation (EU) No 1308/2013 of the European Parliament and of the Council of 17 December 2013 establishing a common organisation of the markets in agricultural products and repealing Council Regulations (EEC) No 922/72, (EEC) No 234/79, (EC) No 1037/2001 and (EC) No 1234/2007”, Official Journal of the European Union, L 347, pp. 671–854.
8. European Commission. (2013d), “6th financial report from the Commission to the European Parliament and the Council on the European Agricultural Fund for Rural Development (EAFRD)”, 2012 financial year,{SWD(2013) 409 final}.
9. Eurostat, http://epp.eurostat.ec.europa.eu/, Accessed on October 2014
10. Janković, S. (2009), “Evropska unija i ruralni razvoj Srbije”, Institut za primenu nauke u poljoprivredi, Beograd.
11. Laptes, R. and Popa, A. (2011), “The European Funding in the Romanian Agriculture and the Need of the Specific Accounting”, Scientific Annals of the „Alexandru Ioan Cuza” University–Economic Sciences Section, Iasi, pp. 25:37.
12. Nanu, M. and Buziernescu, R. (2008), “The Romanian agriculture financing in the context of EU integration”, Revista Tinerilor Economisti, Vol. 4, Issue 10, pp. 45:51. 13. Pejanović, R., Njegovan, Z. (2009), “Aktuelni problemi poljoprivrede i sela Republike
Srbije”, Industrija, vol. 1/2009, str. 87 – 99.
14. Tangermann, S. and Cramon:Taubadel, S. (2013), “Agricultural Policy in the European Union: An overview”, Diskussionspapiere (No. 1302), Department für Agrarökonomie und Rurale Entwicklung.
15. Trzeciak:Duval, A. 2003. “Agriculture finance and credit infrastructure – conditions, policies and channels”, Agricultural Economic – Czech, Vol. 49, Issue 3, pp. 106:112.