Predictors of Uptake and Timeliness of Newly
Introduced Pneumococcal and Rotavirus
Vaccines, and of Measles Vaccine in Rural
Malawi: A Population Cohort Study
Hazzie Mvula1☯, Ellen Heinsbroek2☯, Menard Chihana1, Amelia C. Crampin1,3,
Storn Kabuluzi4, Geoffrey Chirwa4, Charles Mwansambo5, Anthony Costello6, Nigel A. Cunliffe2, Robert S. Heyderman7,8,9, Neil French2,9, Naor Bar-Zeev2,9*, VacSurv Consortium
1Karonga Prevention Study, Chilumba, Malawi,2Institute of Infection & Global Health, University of Liverpool, Liverpool, United Kingdom,3London School of Hygiene & Tropical Medicine, London, United Kingdom,4Expanded Programme for Immunisation Office and Preventive Services Office, Ministry of Health, Lilongwe, Malawi,5Chief of Health Services, Ministry of Health, Lilongwe, Malawi,6Institute of Global Health, University College London, London, United Kingdom,7Liverpool School of Tropical
Medicine, Liverpool, United Kingdom,8Division of Infection & Immunity, University College London, London, United Kingdom,9Malawi-Liverpool-Wellcome Trust Clinical Research Programme, College of Medicine, University of Malawi, Blantyre, Malawi
☯These authors contributed equally to this work.
¶ Membership of the VacSurv Consortium is listed in the Acknowledgments. *Naor.Bar-Zeev@liverpool.ac.uk
Abstract
Background
Malawi introduced pneumococcal conjugate vaccine (PCV13) and monovalent rotavirus vaccine (RV1) in 2011 and 2012 respectively, and is planning the introduction of a second-dose measles vaccine (MV). We assessed predictors of availability, uptake and timeliness of these vaccines in a rural Malawian setting.
Methods
Commencing on the first date of PCV13 eligibility we conducted a prospective population-based birth cohort study of 2,616 children under demographic surveillance in Karonga Dis-trict, northern Malawi who were eligible for PCV13, or from the date of RV1 introduction both PCV13 and RV1. Potential predictors of vaccine uptake and timeliness for PCV13, RV1 and MV were analysed respectively using robust Poisson and Cox regression.
Results
Vaccine coverage was high for all vaccines, ranging from 86.9% for RV1 dose 2 to 95.4% for PCV13 dose 1. Median time delay for PCV13 dose 1 was 17 days (IQR 7–36), 19 days (IQR 8–36) for RV1 dose 1 and 20 days (IQR 3–46) for MV. Infants born to lower educated or farming mothers and those living further away from the road or clinic were at greater risk
a11111
OPEN ACCESS
Citation:Mvula H, Heinsbroek E, Chihana M, Crampin AC, Kabuluzi S, Chirwa G, et al. (2016) Predictors of Uptake and Timeliness of Newly Introduced Pneumococcal and Rotavirus Vaccines, and of Measles Vaccine in Rural Malawi: A Population Cohort Study. PLoS ONE 11(5): e0154997. doi:10.1371/journal.pone.0154997
Editor:Ana Paula Arez, Instituto de Higiene e Medicina Tropical, PORTUGAL
Received:December 21, 2015
Accepted:April 22, 2016
Published:May 6, 2016
Copyright:© 2016 Mvula et al. This is an open access article distributed under the terms of the Creative Commons Attribution License, which permits unrestricted use, distribution, and reproduction in any medium, provided the original author and source are credited.
Data Availability Statement:Data are located on the servers of the Karonga Prevention Study, Chilumba, Malawi. Patient level data are restricted for ethical reasons. Enquiries for data access can be made to Dr Mia Crampin:kpschilumba@lshtm.ac.uk.
Funding:This work was supported by a Wellcome
of being not fully vaccinated and being vaccinated late. Delays in vaccination were also associated with non-facility birth. Vaccine stock-outs resulted in both a delay in vaccine timeliness and in a decrease in completion of schedule.
Conclusion
Despite high vaccination coverage in this setting, delays in vaccination were common. We identified programmatic and socio-demographic risk factors for uptake and timeliness of vaccination. Understanding who remains most vulnerable to be unvaccinated allows for focussed delivery thereby increasing population coverage and maximising the equitable benefits of universal vaccination programmes.
Introduction
Malawi has proactively pursued the fourth Millennium Development Goal of reducing child mortality which it is expected to meet [1]. The early adoption of thirteen-valent pneumococcal conjugate (PCV13) and monovalent rotavirus (RV1) vaccines has been part of this strategy, with introductions on 12thNovember 2011 and 29thOctober 2012 respectively. PCV13 and RV1 are given according to World Health Organisation (WHO) recommended schedule at 6 and 10 weeks for doses 1 and 2, and 14 weeks for third dose PCV13 along with Pentavalent vac-cine (diphtheria, pertussis, tetanus,Haemophilus influenzaetype B and hepatitis B) and oral polio. Initial catch-up vaccination for PCV13 was conducted at the time of introduction with infants<1 year of age at date of first dose to receive 3 doses at 1 month intervals, even if subse-quent doses would be given in the second year of life. Currently no PCV booster is scheduled. Measles vaccine (MV) is currently given as a single dose at 9 months of age, but a number of African countries including Malawi are planning introduction of a second dose [2]. Nationwide and district level MV campaigns are conducted when necessary. In our study site in Karonga district there have been four MV campaigns among infants<1 year of age between 2011 and 2014; one in 2011 and three in 2014.
Vaccination remains the cornerstone of public health intervention to reduce childhood morbidity and mortality, but oftentimes there are select groups that achieve poorer coverage than the national average [3]. Furthermore, vaccine coverage estimates do not reflect timeliness of vaccination, which may frequently be delayed [4,5]. Previous work in this setting prior to introduction of PCV1 and RV1 showed high uptake of vaccines but delays in schedule [6]. As part of a national evaluation of impact and effectiveness of new vaccines in Malawi [7], we analysed data from a population-based birth cohort study to investigate factors affecting vacci-nation coverage and timeliness in northern Malawi during the period of introduction of pneu-mococcal and rotavirus vaccines. We also took the opportunity to examine predictors of MV coverage and timeliness with a view to informing national considerations of introduction of a second dose.
Materials and Methods
Study population and design
In this prospective population-based birth cohort study we followed up all children born in the Karonga Health and Demographic Surveillance Site (KHDSS) on or after: 11thNovember 2010 (thus eligible for PCV13 catch-up), 30thSeptember 2011 (eligible for routine PCV13
collection and analysis, decision to publish, or preparation of the manuscript.
Competing Interests:NBZ and NF have received
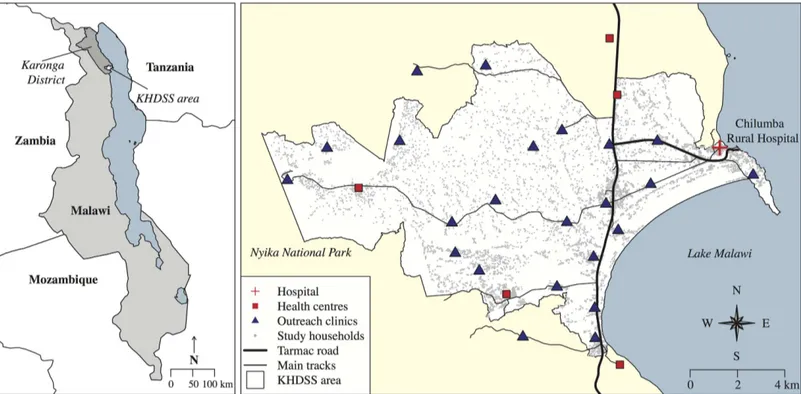
schedule) and 17thSeptember 2012 (eligible for RV1). Established in 2002, the KHDSS situ-ated in northern Malawi covers an area of 135km2and has a population of 35,000 persons under continuous surveillance through which all births, deaths and migrations are recorded [8,9]. The KHDSS area is predominantly rural, with agriculture, fishing and petty trading as main sources of income [8]. The surveillance area includes one rural hospital, five health centres and 23 outreach vaccination clinics (Fig 1). Data were collected during the KDHSS annual census at which all households are visited and individual and household socio-demo-graphic data are collected by trained interviewers. Individual socio-demosocio-demo-graphic data includ-ing vaccine status for children<5 years were available until August 2014. Vaccine status and date of vaccination were transcribed from parent-held booklets (“health passports”) issued free by the government to all children at birth or first clinic visit. Absent vaccine documenta-tion, parent/guardian reported vaccination status was recorded. Geographical Positioning System (GPS) coordinates were collected to calculate radial distance to nearest tarmac road or main track and to the nearest vaccination centre. We included in the analysis all children eligible for PCV13 or RV1 who were at least 1 year old at time of interview. We excluded: (1) children who died within the first year of life; (2) children who had migrated into the study area after 6 weeks of age from the PCV13/RV1 birth cohort or those migrating after start of the PCV13 catch-up campaign from the catch-up cohort; (3) any child whose date of birth or vaccination status could not be verified by written record. Children with documented evi-dence of vaccine receipt but lacking date were included in the coverage analysis, but excluded from timeliness analysis. Sensitivity analyses were performed to define risk factors associated with lack of written document and to repeat the main analyses including children without written documentation.
Fig 1. Map of the Karonga Health and Demographic Surveillance site (KHDSS), showing Chilumba Rural Hospital, 5 local health centres and 23 outreach clinic sites included in the study.Outline of Malawi and neighbouring countries downloaded from thematicmapping.org [10].
Definitions
Individual uptake of vaccination was defined by the child’s written record in the health pass-port. Population vaccination coverage in the PCV13 and RV1 birth cohorts was calculated as the number of children receiving vaccination by one year of age divided by age-eligible popula-tion for each respective vaccine. For PCV13 catch-up campaign coverage we used the number of children vaccinated from among all catch-up eligible children in our study site at the time of data collection regardless of age. For measles vaccination we calculated vaccination coverage at one year of age, and vaccination coverage at any age. We were unable to distinguish measles vaccination as a result of mass campaign from routine doses given off schedule. Timeliness of vaccination for birth cohorts was calculated as number of days between the recommended vac-cination age and the date vaccine was given, regardless of age. Children who never received the vaccine were right-truncated at one year of age. Delays in later doses subtracted any delays on account of prior doses (for example if dose 1 was given at 8 weeks (2 weeks delay) and dose 2 at 12 weeks, delay for dose 2 was considered 0, because it had been given correctly at 4 weeks after dose 1). Total delay was defined as the number of days between completing the schedule for a particular vaccine (third dose for PCV13, second dose for RV1, first dose for MV) and the rec-ommended vaccination age. We presumed vaccine non-availability at local clinic, among the birth cohort only, when PCV13 or RV1 were administered later than the corresponding dose of Pentavalent vaccine.
Statistical analysis
Potential individual level predictors of vaccine uptake and clinic level predictors of discordant delays (presumed non-availability) were separately examined using univariable and multivari-able Poisson regression with robust standard errors [11,12], and reported as risk ratios (RR) and adjusted RR (aRR) respectively (“risk”being probability of receiving a vaccine dose) [13]. We report timeliness as median days delay (and interquartile range [IQR]). Predictors of vac-cine timeliness (total delay in vaccination) were examined using univariable and multivariable Cox regression, and reported as crude and adjusted hazard ratio (HR and aHR) respectively, where HR<1 implies delayed vaccination compared with baseline group (“hazard”being prob-ability of receiving a vaccine dose at timet). Although our analysis examined numerous covari-ates, we did not perform correction for multiple comparisons in univariable analysis [14], but for multivariable models included initially only covariates achievingP-value<0.2 in univari-able analysis. We retained in the final multivariunivari-able model those covariates achieving a likeli-hood ratio testP-value<0.05. Analysis was performed using Stata 12.1 (Statacorp, Texas) and R 3.0.1 (R Foundation for Statistical Computing, Vienna).
Ethics
Informed written consent was obtained from all parents or legal guardians of participants. Eth-ical approval was obtained from the Malawi National Health Sciences Research Committee (#837) and the institutional review board of the London School of Hygiene and Tropical Medi-cine (#6047). The study was funded by the Wellcome Trust who had no input into data collec-tion, analysis, interpretation or decision to submit for publication.
Results
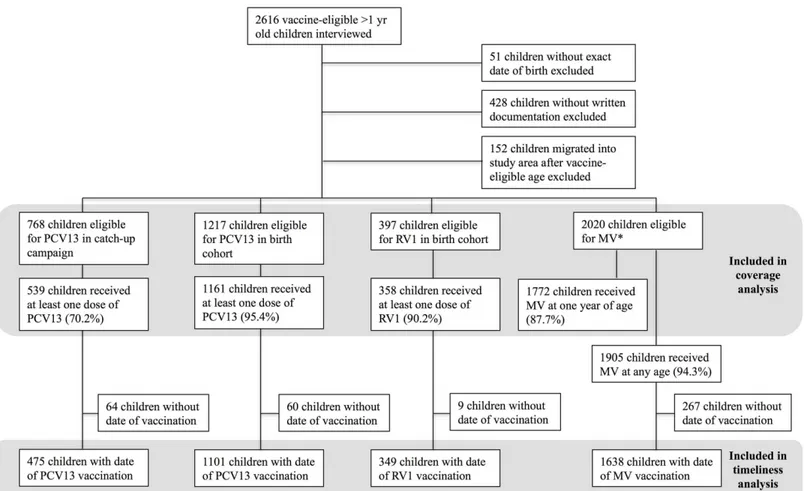
for analysis. Among these, 768 were eligible for PCV13 catch-up, 820 for PCV13 by routine schedule prior to RV1 introduction and 397 for both PCV13 and RV1 (Fig 2).
Vaccination coverage
PCV13 coverage in the catch-up cohort for dose 1, 2 and 3 was 70.2% (539/768), 61.6% (470/ 763) and 49.8% (378/759), respectively. Among children birth-eligible for PCV13, coverage by one year of age for each of three doses was 95.4% (1161/1217), 94.4% (1149/1217) and 89.4% (1086/1215), respectively. Among those eligible for RV1, 90.2% (358/397) received one dose and 86.9% (344/396) received two doses. Coverage for MV by one year, regardless of routine dose or mass campaign, was 87.7% (1772/2020). Coverage for MV at any age was 94.3% (1905/ 2020).
Vaccine
‘
non-availability
’
In the PCV13 birth cohort there were 276 of 1007 (27.4%) children who received the third dose of PCV13 later than the third dose of Pentavalent vaccine. Of 336 children eligible for RV1, 122 (36.3%) children received second dose RV1 later than the respective Pentavalent dose (S1 Table). Assumed“vaccine non-availability”for PCV13 decreased with time since national introduction, but vaccine non-availability for RV1 remained high and no clear association with
Fig 2. Flowchart of eligible children included in vaccination coverage and timeliness analyses.*There were 35 children for whom written documentation was available for MV but missing for PCV13/RV1.
time since introduction was observed. PCV13 non-availability was higher in the rainy than in the dry season (dose 1: aRR 1.63, 95% CI 1.12–2.37). Non-availability of vaccines was associ-ated with further distance from the road for both PCV13 dose 1 (aRR1.57, 95%CI 1.07–2.30) and RV1 dose 1 (aRR 2.65, 95%CI 1.68–4.19). Children whose initial PCV13 doses were delayed compared with Pentavalent, were less likely to complete their PCV13 series (aRR 0.82, CI 0.76–0.89 where dose 1 delayed; aRR 0.86, CI 0.81–0.91 where dose 2 delayed) (S2 Table).
Predictors of vaccination coverage by catch-up campaign
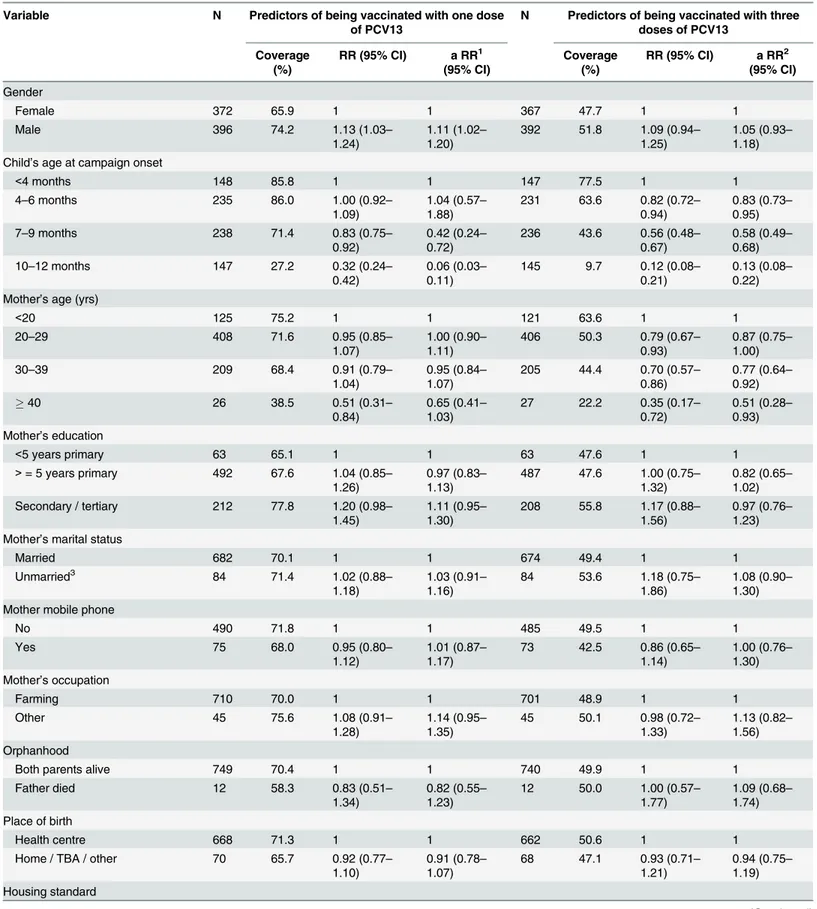
Among children in the PCV13 catch-up cohort, age at onset of campaign was strongly associ-ated with uptake of third dose of PCV13 with 77.5% vaccinassoci-ated among those<4 months old versus 9.7% amongst those 10–12 months old at time of campaign onset (aRR 0.13, CI 0.08– 0.22). Children born to mothers aged30 years were less likely to be vaccinated with three doses (aRR 0.77, CI 0.64–0.92). Vaccine coverage with at least one dose of PCV13 was higher amongst males (aRR 1.11, CI 1.02–1.20), but this effect was no longer observed for coverage with three doses (aRR 1.05, CI 0.93–1.18) (Table 1).
Predictors of vaccination coverage by routine schedule
Table 2summarizes the predictors of low uptake for all studied vaccines. Time since national introduction was an important predictor of vaccination coverage in the PCV13 birth cohort, with higher coverage>9 months compared to 0–3 months since introduction (aRR 1.09, CI 1.05–1.13; aRR 1.16, CI 1.09–1.23 for first and third dose respectively) (S2 Table). Uptake was lower if vaccination was due in the rainy season than in the dry season (aRR 0.97, CI 0.95–1.00 for dose 1). Maternal farming was associated with a lower uptake of PCV13 (aRR 0.96, CI 0.93–0.98 for dose 1, aRR 0.93, CI 0.89–0.98 for dose 3). Children from larger households or those with more children were more likely to receive PCV13. Children were less likely to be fully vaccinated for the third dose of PCV13 if distance to the nearest clinic was1.5km (aRR 0.89, CI 0.81–0.98).
For RV1 uptake was higher if mother was not married (aRR 1.08, CI 1.01–1.15 for dose 1) or if maternal age was40 years (aRR 1.10, CI 1.00–1.21 for dose 2), but lower if distance to the nearest road was1.5km (aRR 0.80, CI 0.69–0.93 dose 1; aRR 0.75, CI 0.63–0.90 dose 2) (S3 Table). In contrast to the PCV13 birth cohort, children were less likely to be vaccinated with RV1 if they lived in a household with more than three children<5 years of age (aRR 0.77, CI 0-59-1.00 dose 2).
Infants were less likely to receive MV if there were other children in the household (aRR 0.94, CI 0.91–0.97), if distance to the nearest clinic was1.5km (aRR 0.91, CI 0.85–0.98) or if their mothers were farmers (aRR 0.92, CI 0.89–0.96). Children were more likely to be vacci-nated if the mother attended post-primary education (aRR 1.09, CI 1.00–1.18) (S4 Table).
Timeliness of vaccination
Table 1. Univariable and multivariable analysis of predictors of pneumococcal vaccine uptake in the catch-up campaign cohort.
Variable N Predictors of being vaccinated with one dose of PCV13
N Predictors of being vaccinated with three doses of PCV13
Coverage (%)
RR (95% CI) a RR1 (95% CI)
Coverage (%)
RR (95% CI) a RR2 (95% CI)
Gender
Female 372 65.9 1 1 367 47.7 1 1
Male 396 74.2 1.13 (1.03–
1.24)
1.11 (1.02–
1.20)
392 51.8 1.09 (0.94–
1.25)
1.05 (0.93–
1.18) Child’s age at campaign onset
<4 months 148 85.8 1 1 147 77.5 1 1
4–6 months 235 86.0 1.00 (0.92–
1.09)
1.04 (0.57–
1.88)
231 63.6 0.82 (0.72–
0.94)
0.83 (0.73–
0.95)
7–9 months 238 71.4 0.83 (0.75–
0.92)
0.42 (0.24–
0.72)
236 43.6 0.56 (0.48–
0.67)
0.58 (0.49–
0.68)
10–12 months 147 27.2 0.32 (0.24–
0.42)
0.06 (0.03–
0.11)
145 9.7 0.12 (0.08–
0.21)
0.13 (0.08–
0.22) Mother’s age (yrs)
<20 125 75.2 1 1 121 63.6 1 1
20–29 408 71.6 0.95 (0.85–
1.07)
1.00 (0.90–
1.11)
406 50.3 0.79 (0.67–
0.93)
0.87 (0.75–
1.00)
30–39 209 68.4 0.91 (0.79–
1.04)
0.95 (0.84–
1.07)
205 44.4 0.70 (0.57–
0.86)
0.77 (0.64–
0.92)
40 26 38.5 0.51 (0.31–
0.84)
0.65 (0.41–
1.03)
27 22.2 0.35 (0.17–
0.72)
0.51 (0.28–
0.93) Mother’s education
<5 years primary 63 65.1 1 1 63 47.6 1 1
>= 5 years primary 492 67.6 1.04 (0.85–
1.26)
0.97 (0.83–
1.13)
487 47.6 1.00 (0.75–
1.32)
0.82 (0.65–
1.02) Secondary / tertiary 212 77.8 1.20 (0.98–
1.45)
1.11 (0.95–
1.30)
208 55.8 1.17 (0.88–
1.56)
0.97 (0.76–
1.23) Mother’s marital status
Married 682 70.1 1 1 674 49.4 1 1
Unmarried3 84 71.4 1.02 (0.88
–
1.18)
1.03 (0.91–
1.16)
84 53.6 1.18 (0.75–
1.86)
1.08 (0.90–
1.30) Mother mobile phone
No 490 71.8 1 1 485 49.5 1 1
Yes 75 68.0 0.95 (0.80–
1.12)
1.01 (0.87–
1.17)
73 42.5 0.86 (0.65–
1.14)
1.00 (0.76–
1.30) Mother’s occupation
Farming 710 70.0 1 1 701 48.9 1 1
Other 45 75.6 1.08 (0.91–
1.28)
1.14 (0.95–
1.35)
45 50.1 0.98 (0.72–
1.33)
1.13 (0.82–
1.56) Orphanhood
Both parents alive 749 70.4 1 1 740 49.9 1 1
Father died 12 58.3 0.83 (0.51–
1.34)
0.82 (0.55–
1.23)
12 50.0 1.00 (0.57–
1.77)
1.09 (0.68–
1.74) Place of birth
Health centre 668 71.3 1 1 662 50.6 1 1
Home / TBA / other 70 65.7 0.92 (0.77–
1.10)
0.91 (0.78–
1.07)
68 47.1 0.93 (0.71–
1.21)
0.94 (0.75–
1.19) Housing standard
was associated with moving house in the vaccination period and vaccination due in the rainy season, but no such associations were observed for RV1 and MV (S5,S6andS7Tables).
Sensitivity analysis including children without written documentation
There were 428 children without written documentation of PCV13 and RV1 vaccine status. Verbal report of PCV13 vaccine status was available for 356 children, provided by the mother
Table 1. (Continued)
Variable N Predictors of being vaccinated with one dose of PCV13
N Predictors of being vaccinated with three doses of PCV13
Coverage (%)
RR (95% CI) a RR1 (95% CI)
Coverage (%)
RR (95% CI) a RR2 (95% CI)
1 (lowest) 127 68.5 1 1 126 50.0 1 1
2 280 68.9 1.01 (0.87–
1.16)
1.02 (0.91–
1.15)
275 50.6 1.01 (0.82–
1.25)
1.06 (0.87–
1.27)
3 151 68.2 1.00 (0.85–
1.17)
0.99 (0.87–
1.14)
150 46.7 0.93 (0.73–
1.19)
0.96 (0.77–
1.20)
4 (highest) 124 72.6 1.06 (0.90–
1.24)
1.07 (0.93–
1.22)
124 50.0 1.00 (0.78–
1.28)
1.00 (0.80–
1.26) Household size
<4 148 74.3 1 1 145 57.2 1 1
4–6 396 69.7 0.94 (0.84–
1.05)
1.00 (0.91–
1.11)
393 50.1 0.88 (0.74–
1.04)
1.05 (0.88–
1.25)
7 224 68.3 0.92 (0.81–
1.05)
0.96 (0.86–
1.08)
221 44.3 0.77 (0.63–
0.95)
0.95 (0.78–
1.17) Number of children<5 years in
household
1 329 70.8 1 1 324 52.5 1 1
2 394 69.5 0.98 (0.89–
1.08)
0.96 (0.88–
1.05)
391 47.3 0.90 (0.78–
1.04)
0.95 (0.83–
1.09)
3 45 71.1 1.00 (0.82–
1.23)
0.96 (0.81–
1.14)
44 49.8 1.00 (0.74–
0.35)
0.99 (0.76–
1.31) Distance to road (km)
<1 579 71.0 1 1 571 49.6 1 1
1–1.5 125 67.2 0.95 (0.83–
1.08)
0.93 (0.84–
1.04)
124 52.4 1.06 (0.88–
1.28)
1.04 (0.89–
1.21)
1.5 64 68.8 0.97 (0.81–
1.15)
0.92 (0.77–
1.10)
64 46.9 0.95 (0.72–
1.24)
0.89 (0.68–
1.16) Distance to clinic (km)
<1 514 72.0 1 1 509 50.9 1 1
1–1.49 176 67.1 0.93 (0.83–
1.05)
0.93 (0.84–
1.03)
174 50.6 0.99 (0.84–
1.18)
0.98 (0.85–
1.13)
1.5 78 65.4 0.92 (0.77–
1.07)
0.94 (0.81–
1.08)
76 40.8 0.80 (0.60–
1.07)
0.85 (0.66–
1.09) Moved house
No 742 69.7 1 1 734 49.5 1 1
Yes 26 84.6 1.21 (1.02–
1.44)
1.14 (0.98–
1.31)
25 60.0 1.21 (0.87–
1.69)
1.10 (0.74–
1.38)
1Adjusted for child’s age at onset of catch-up vaccination campaign and sex 2Adjusted for child’s age at onset of catch-up vaccination campaign and maternal age 3Never married/divorced/widowed
(44.9%), father (34.3%), a sibling (3.7%), other relative (16.9%) or a non-relative (0.3%). Cover-age by verbal report amongst children without written documentation, excluded from the anal-yses reported above, was lower for the PCV13 catch-up cohort (45.8% (87/190) dose 1, 45.3% (86/190) dose 2, 45.3% (86/190) dose 3), PCV13 birth cohort (84.3% (140/166) dose 1, 84.3% (140/166) dose 2, 83.7% (139/166) dose 3) and RV1 (78.0% (39/50) dose 1, 76.0% (38/50) dose 2), but higher for coverage of MV (99.7% (361/362)). Moving house (aRR 0.89, CI 0.80–1.00) and being born to an unmarried mother (aRR 0.93, CI 0.87–1.00) were associated with lack of written documentation. Children born to farming mothers were found to be more likely to have written documentation available (aRR 1.17, CI 1.07–1.29). Including children without written documentation in the primary analyses did not change our main findings, although sig-nificance was lost for some risk factors, possibly as a result of misclassification of verbal report of vaccination status. No new risk factors for vaccine uptake were identified in analyses includ-ing only children without written documentation.
Discussion
Malawi has been proactive in the trialling, introduction and post-roll out evaluation of vac-cines, and as our data show, has achieved high coverage and good timeliness, even in our remote study setting. As with all universal programmes some gaps remain. Studies that have examined factors associated with vaccination coverage and timeliness of vaccines in
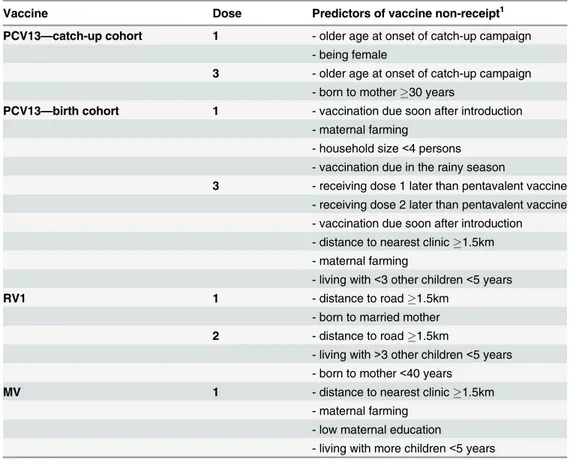
sub-Table 2. Summary of multivariate analyses on predictors of vaccine non-receipt.
Vaccine Dose Predictors of vaccine non-receipt1
PCV13—catch-up cohort 1 - older age at onset of catch-up campaign
- being female
3 - older age at onset of catch-up campaign - born to mother30 years
PCV13—birth cohort 1 - vaccination due soon after introduction
- maternal farming
- household size<4 persons - vaccination due in the rainy season
3 - receiving dose 1 later than pentavalent vaccine - receiving dose 2 later than pentavalent vaccine - vaccination due soon after introduction - distance to nearest clinic1.5km - maternal farming
- living with<3 other children<5 years
RV1 1 - distance to road1.5km
- born to married mother 2 - distance to road1.5km
- living with>3 other children<5 years - born to mother<40 years
MV 1 - distance to nearest clinic1.5km
- maternal farming - low maternal education
- living with more children<5 years
1Predictors listed in descending order by strength of association. Full details available inS2,S3andS4 Tables
Saharan Africa, have found that lower vaccine uptake and untimely vaccination were associ-ated with low socioeconomic status, low maternal education, non-facility birth, and increased distance to a health facility [4–6,15–31] (S8 Table), consistent with the findings of this study. No studies were conducted in the context of newly introduced PCV13 and RV1. In this study located at a Demographic Surveillance Site, despite our communal context of homogenous cul-tural affiliation and of socioeconomic standing and remoteness, we found programmatic and socio-demographic characteristics that are associated with vaccination coverage and timeliness amongindividualinfants in a rural region of Malawi. The recognition that there exist individ-ual vulnerabilities even in an otherwise homogenous setting is important, and we return to this point in our recommendations.
We made the assumption that if Pentavalent vaccine was received on time but PCV13 was delayed then this was due to local non-availability of the latter. At the time of PCV13 introduc-tion in late 2011 Malawi suffered major fuel shortages that impacted on distribuintroduc-tion of newly introduced vaccines and many other societal functions. Although we are unable to verify this assumption, presumed non-availability reduced with time since national introduction and was
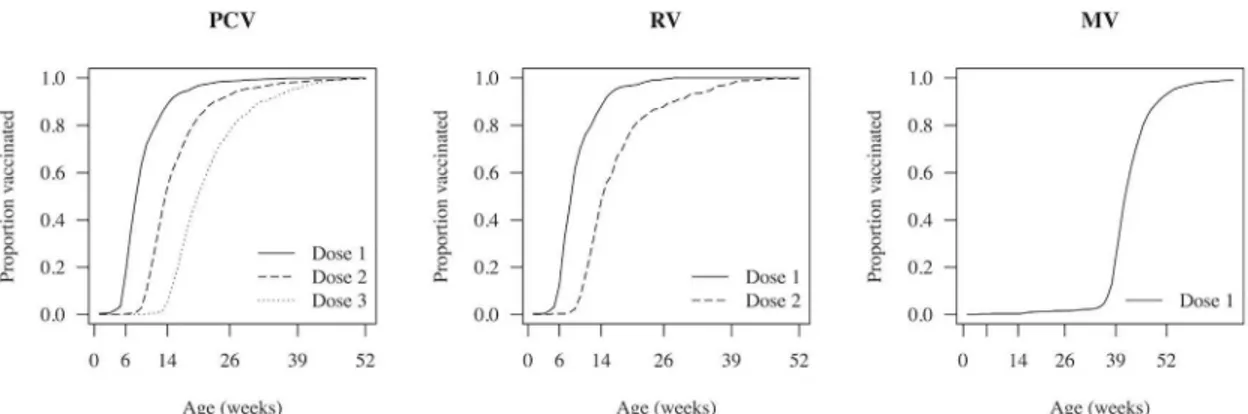
Fig 3. Timeliness of pneumococcal conjugate, rotavirus and measles vaccines, among vaccinated children in the Karonga Health and Demographic Surveillance Site.
doi:10.1371/journal.pone.0154997.g003
Table 3. Summary of survival analyses on predictors of delay in vaccination.
Vaccine Predictors of increased total delay in vaccination1
PCV132 - moving house in the vaccination period
- maternal farming - distance to road1.5km - non-facility birth
- vaccination due in the rainy season
RV1 - distance to road1km
- living with more children<5 years
MV - maternal farming
- low maternal education - non-facility birth
- living with more children<5 years
1Predictors listed in descending order by strength of association. Full details available inS5,S6andS7 Tables
2Delay calculated for PCV13 birth cohort only: not applicable to the PCV13 catch-up cohort
associated with seasonality and distance from the road. More remote health centres generally serve a more scattered population residing away from dense centres, and often away from sealed roads. Such health centres are more difficult to access by the vaccine programme deliv-ery mechanisms; we tried to capture this, albeit imperfectly, by including in distance to sealed road. Non-availability of early doses predicted not only total vaccination delay, but also non-completion of the vaccine course. Recognising the challenges in place at the time of PCV13 introduction, the Malawi National Immunisation Technical Advisory Group conducted several sessions to review lessons learnt from PCV13 in planning for RV1 introduction. These reviews included wide representation from ministerial, non-government and academic health planners with vaccine programme experience, epidemiologists, procurement, media, finance and trans-port specialists. Separately conducted coverage estimates from southern Malawi do suggest rapid attainment of RV1 population coverage [32], although in our more remote setting RV1 non-availability seemed to persist over time.
Despite the decision to provide catch-up vaccination to infants, the country was provided with doses adequate only for the birth cohort [33]. Coverage achieved among infants was mod-erate, but was low amongst older infants (9.7% for dose 3 amongst those 10–12 months at time of campaign onset). It is likely that available PCV13 doses were prioritised for younger infants, but alternative hypotheses for the lower uptake amongst older infants are that mothers were unaware of the programme for older infants, or that mothers were reluctant or could not afford to make an additional visit to the health centre, but accepted vaccination as part of the routine schedule for younger infants.
Vaccination timeliness is important for several reasons. Optimising vaccine schedules requires balancing benefits of delayed vaccination, such as prolonged immunity, against pro-tection at an early age in the context of high force of infection [34–36]. Timeliness is also a marker of the functionality of the national vaccine delivery system so is of inherent interest to health service planners.
Limitations
Our study has limitations. Excluding children if written documentation of dates was unavail-able may lead to an overestimation of vaccine coverage for PCV13 and RV1 since reported cov-erage was lower among children without documentation. Covcov-erage estimates for measles may have been underestimated if doses given during district-wide campaigns were unrecorded, consistent with higher coverage reported by parents than documented in health passport. A sensitivity analysis including children without written documentation did not alter the main findings of this study. Our data could not distinguish whether written documentation was missing because the health passport was truly lost, or because the mother, generally in charge of keeping the children’s health passports, was not available at time of the interview. The low proportion of mothers available at time of interview for children for whom written documenta-tion was not available (44.9% vs. 84.3% for children with documentadocumenta-tion) suggests that both scenarios occur. We included only children surviving to one year of age. We hypothesise that children dying in infancy are more likely to be unvaccinated, and this is currently being investi-gated [7]; results are anticipated in 2016. Our data come from an area under continuous demo-graphic surveillance which may have an increased vaccine uptake. Although vaccine uptake may be higher in our Demographic Surveillance Site than in other areas, the risk factors we found for low uptake or poor timeliness of vaccination are likely to be relevant to other rural African settings not under continuous demographic surveillance.A fortiori, if in an area with relatively good service provision we identified children whose circumstances adversely affect vaccine coverage, then in other rural areas with similar socio-demographics but less function-ing health systems, such children are very likely to be under-served. In the absence of reliable data on stock-outs, we made the assumption that delay in new vaccines when older vaccines were given on time was due to non-availability of new vaccines. The validity of this assumption cannot be confirmed. Our definition would miss non-availability of all vaccines, however in practice initial post-introduction delivery to clinics of PCV13 and RV1 occurred separately from routine vaccine delivery.
Conclusion
margins. These suggested recommendations are essential if the full benefits of vaccination pro-grammes are to be realized amongst the most vulnerable.
Supporting Information
S1 Table. Robust Poisson regression for factors associated with PCV13 or RV1 given at a later date than Pentavalent vaccine:“vaccine non-availability”.
(DOCX)
S2 Table. Univariable and multivariable analysis of predictors of pneumococcal vaccine uptake in the birth cohort.
(DOCX)
S3 Table. Univariable and multivariable analysis of predictors of rotavirus vaccine uptake.
(DOCX)
S4 Table. Univariable and multivariable analysis of predictors of measles vaccine uptake.
(DOCX)
S5 Table. Survival analysis of predictors of timeliness of pneumococcal vaccination.
(DOCX)
S6 Table. Survival analysis of predictors of timeliness of rotavirus vaccination.
(DOCX)
S7 Table. Survival analysis of predictors of timeliness of measles vaccination.
(DOCX)
S8 Table. Literature reporting risk factors for low vaccine uptake and/or late vaccination in sub-Saharan countries.
(DOCX)
Acknowledgments
This work was supported by a Wellcome Trust Programme Grant (number WT091909/B/10/ Z) awarded to NAC, RSH and NF; and the Karonga Prevention Study Core Award from the Wellcome Trust. We thank the members of the VacSurv Consortium: James Beard (University College London [UCL], London UK), Miren Iturriza-Gomara (University of Liverpool, Liver-pool, UK), Carina King (UCL), Sonia Lewycka (University of Auckland, New Zealand, for-merly UCL), Osamu Nakagomi (University of Nagasaki, Nagasaki, Japan), Umesh D Parashar (Centers for Disease Control & Prevention [CDC], Atlanta, GA, USA), Tambosi Phiri (Mai Mwana Project, Mchinji, Malawi), Jacqueline E Tate (CDC), Jennifer R Verani (CDC) and Cynthia G Whitney (CDC).
Author Contributions
References
1. O'Hare B, Makuta I, Bar-Zeev N, Chiwaula L, Cobham A. The effect of illicit financial flows on time to reach the fourth Millennium Development Goal in Sub-Saharan Africa: a quantitative analysis. J R Soc Med. 2014; 107(4):148–56. doi:10.1177/0141076813514575PMID:24334911
2. Government of Malawi. Comprehensive EPI Multi-Year Plan 2012–2016. Accessed on 08/07/2015 at
http://www.nationalplanningcycles.org/sites/default/files/country_docs/Malawi/document_no.pdf. 2011.
3. WHO, UNICEF, World Bank. State of the world’s vaccines and immunization, 3rd ed. Geneva, World Health Organization, 2009. Accessed on 11/05/2015 athttp://whqlibdoc.who.int/publications/2009/ 9789241563864_eng.pdf
4. Gram L, Soremekun S, ten Asbroek A, Manu A, O'Leary M, Hill Z, et al. Socio-economic determinants and inequities in coverage and timeliness of early childhood immunisation in rural Ghana. Trop Med Int Health. 2014; 19(7):802–11. doi:10.1111/tmi.12324PMID:24766425
5. Fadnes LT, Nankabirwa V, Sommerfelt H, Tylleskar T, Tumwine JK, Engebretsen IM. Is vaccination coverage a good indicator of age-appropriate vaccination? A prospective study from Uganda. Vaccine. 2011; 29(19):3564–70. doi:10.1016/j.vaccine.2011.02.093PMID:21402043
6. Jahn A, Floyd S, Mwinuka V, Mwafilaso J, Mwagomba D, Mkisi RE, et al. Ascertainment of childhood vaccination histories in northern Malawi. Trop Med Int Health. 2008; 13(1):129–38. doi: 10.1111/j.1365-3156.2007.01982.xPMID:18291011
7. Bar-Zeev N, Kapanda L, King C, Beard J, Phiri T, Mvula H, et al. Methods and challenges in measuring the impact of national pneumococcal and rotavirus vaccine introduction on morbidity and mortality in Malawi. Vaccine. 2015; 33(23):2637–45. doi:10.1016/j.vaccine.2015.04.053PMID:25917672
8. Crampin AC, Dube A, Mboma S, Price A, Chihana M, Jahn A, et al. Profile: the Karonga Health and Demographic Surveillance System. Int J Epidemiol. 2012; 41(3):676–85. doi:10.1093/ije/dys088
PMID:22729235
9. Jahn A, Branson K, Crampin AC, Fine PE, Glynn JR, McGrath N, et al. Evaluation of a village-informant driven demographic surveillance system in Karonga, Northern Malawi. Demographic Res. 2007; 16:217–48.
10. Sandvik B. World Borders Dataset—thematicmapping.org. 2009. Available from:http:// thematicmapping.org/downloads/world_borders.php.
11. Huber P. The behavior of maximum likelihood estimates under non-standard conditions. Proc Fifth Berkeley Symp Math Statist and Prob. 1967:221–33.
12. White H. A heteroskedasticity-consistent covariance matrix estimator and a direct test for heteroske-dasticity. Econometrica. 1980; 48:817–30.
13. Knol MJ, Le Cessie S, Algra A, Vandenbroucke JP, Groenwold RH. Overestimation of risk ratios by odds ratios in trials and cohort studies: alternatives to logistic regression. Can Med Assoc J. 2012; 184 (8):895–9. doi:10.1503/cmaj.101715
14. Button KS, Ioannidis JP, Mokrysz C, Nosek BA, Flint J, Robinson ES, et al. Power failure: why small sample size undermines the reliability of neuroscience. Nat Rev Neurosci. 2013; 14(5):365–76. doi:10. 1038/nrn3475PMID:23571845
15. Abadura SA, Lerebo WT, Kulkarni U, Mekonnen ZA. Individual and community level determinants of childhood full immunization in Ethiopia: a multilevel analysis. BMC Public Health. 2015; 15(1):972. doi:
10.1186/s12889-015-2315-z
16. Babalola S. Determinants of the uptake of the full dose of diphtheria-pertussis-tetanus vaccines (DPT3) in Northern Nigeria: a multilevel analysis. Matern Child Health J. 2009; 13(4):550–8. doi:10.1007/ s10995-008-0386-5PMID:18607704
17. Babirye JN, Engebretsen IM, Makumbi F, Fadnes LT, Wamani H, Tylleskar T, et al. Timeliness of child-hood vaccinations in Kampala Uganda: a community-based cross-sectional study. PLoS One. 2012; 7 (4):e35432. doi:10.1371/journal.pone.0035432PMID:22539972
18. Bosch-Capblanch X, Banerjee K, Burton A. Unvaccinated children in years of increasing coverage: how many and who are they? Evidence from 96 low- and middle-income countries. Trop Med Int Health. 2012; 17(6):697–710. doi:10.1111/j.1365-3156.2012.02989.xPMID:22943300
19. Canavan ME, Sipsma HL, Kassie GM, Bradley EH. Correlates of complete childhood vaccination in East African countries. PLoS One. 2014; 9(4):e95709. doi:10.1371/journal.pone.0095709PMID:
24752178
21. Favin M, Steinglass R, Fields R, Banerjee K, Sawhney M. Why children are not vaccinated: a review of the grey literature. Int Health. 2012; 4(4):229–38. doi:10.1016/j.inhe.2012.07.004PMID:24029668
22. Glatman-Freedman A, Nichols K. The effect of social determinants on immunization programs. Hum Vaccin Immunother. 2012; 8(3):293–301. doi:10.4161/hv.19003PMID:22327490
23. Jani JV, De Schacht C, Jani IV, Bjune G. Risk factors for incomplete vaccination and missed opportu-nity for immunization in rural Mozambique. BMC Public Health. 2008; 8:161. doi: 10.1186/1471-2458-8-161PMID:18485194
24. Le Polain de Waroux O, Schellenberg JR, Manzi F, Mrisho M, Shirima K, Mshinda H, et al. Timeliness and completeness of vaccination and risk factors for low and late vaccine uptake in young children liv-ing in rural southern Tanzania. Int Health. 2013; 5(2):139–47. doi:10.1093/inthealth/iht006PMID:
24030114
25. Munthali AC. Determinants of vaccination coverage in Malawi: evidence from the demographic and health surveys. Malawi Med J. 2007; 19(2):79–82. PMID:23878640
26. National Statistical Office (NSO) and ICF Macro. Malawi Demographic and Health Survey 2010. Zomba, Malawi, and Calverton, Maryland, USA: NSO and ICF Macro. 2011.
27. Odutola A, Afolabi MO, Ogundare EO, Lowe-Jallow YN, Worwui A, Okebe J, et al. Risk factors for delay in age-appropriate vaccinations among Gambian children. BMC Health Serv Res. 2015; 15:346. doi:
10.1186/s12913-015-1015-9PMID:26315547
28. Payne S, Townend J, Jasseh M, Lowe Jallow Y, Kampmann B. Achieving comprehensive childhood immunization: an analysis of obstacles and opportunities in The Gambia. Health Policy Plan. 2014; 29 (2):193–203. doi:10.1093/heapol/czt004PMID:23426974
29. Rainey JJ, Watkins M, Ryman TK, Sandhu P, Bo A, Banerjee K. Reasons related to non-vaccination and under-vaccination of children in low and middle income countries: findings from a systematic review of the published literature, 1999–2009. Vaccine. 2011; 29(46):8215–21. doi:10.1016/j.vaccine. 2011.08.096PMID:21893149
30. Schoeps A, Ouedraogo N, Kagone M, Sie A, Muller O, Becher H. Socio-demographic determinants of timely adherence to BCG, Penta3, measles, and complete vaccination schedule in Burkina Faso. Vac-cine. 2013; 32(1):96–102. doi:10.1016/j.vaccine.2013.10.063PMID:24183978.
31. Wiysonge CS, Uthman OA, Ndumbe PM, Hussey GD. Individual and contextual factors associated with low childhood immunisation coverage in sub-Saharan Africa: a multilevel analysis. PLoS One. 2012; 7 (5):e37905. doi:10.1371/journal.pone.0037905PMID:22662247
32. Bar-Zeev N, Kapanda L, Tate JE, Jere KC, Iturriza-Gomara M, Nakagomi O, et al. Effectiveness of a monovalent rotavirus vaccine in infants in Malawi after programmatic roll-out: an observational and case-control study. Lancet Infect Dis. 2015; 15(4):422–8. doi:10.1016/s1473-3099(14)71060-6PMID:
25638521
33. Clinton Health Access Initiative. Annual Report 2013. p. 1–24. Accessed on 17 March 2015 atwww. clintonhealthaccess.org/files/CHAI_Annual_Report_3.pdf.
34. Scott JA, Ojal J, Ashton L, Muhoro A, Burbidge P, Goldblatt D. Pneumococcal conjugate vaccine given shortly after birth stimulates effective antibody concentrations and primes immunological memory for sustained infant protection. Clin Infect Dis. 2011; 53(7):663–70. doi:10.1093/cid/cir444PMID:
21865175
35. Spijkerman J, Veenhoven RH, Wijmenga-Monsuur AJ, Elberse KE, van Gageldonk PG, Knol MJ, et al. Immunogenicity of 13-valent pneumococcal conjugate vaccine administered according to 4 different primary immunization schedules in infants: a randomized clinical trial. JAMA. 2013; 310(9):930–7. doi:
10.1001/jama.2013.228052PMID:24002279