The Area of Secondary Hyperalgesia
following Heat Stimulation in Healthy Male
Volunteers: Inter- and Intra-Individual
Variance and Reproducibility
Morten Sejer Hansen1*, Jørn Wetterslev2, Christian Bressen Pipper3, RebeccaØstervig4,
Mohammad Sohail Asghar4, Jørgen Berg Dahl5
1Department of Anesthesiology 4231, Centre of Head and Orthopedics, Rigshospitalet, Copenhagen, Denmark,2Department 7812, Copenhagen Trial Unit, Centre for Clinical Intervention Research,
Copenhagen, Denmark,3Section of Biostatistics, Faculty of Health, Copenhagen University, Copenhagen, Denmark,4Department of Anesthesiology 4231, Centre of Head and Orthopedics, Rigshospitalet, Copenhagen, Denmark,5Department of Anesthesiology, Bispebjerg and Frederiksberg Hospitals, Copenhagen, Denmark
Abstract
Introduction
Clinical pain models can be applied when investigating basic physiologic pain responses in healthy volunteers. Several pain models exist; however, only few have been adequately val-idated. Our primary aim with this prospective study was to investigate the intra- and inter-individual variation in secondary hyperalgesia elicited by brief thermal sensitization (45°C for 3 min) in healthy volunteers.
Material and Methods
Fifty healthy volunteers were included. Areas of secondary hyperalgesia following brief ther-mal sensitization were investigated by 2 observers on 4 experimental days, with a minimum interval of 7 days. Additionally, heat pain detection threshold and pain during thermal stimu-lation (45°C for 1 min.), and the psychological tests Pain Catastrophizing Scale and Hospital Anxiety and Depression Score were applied.
Results
For areas of secondary hyperalgesia, an intra-observer intra-person correlation of 0.85, 95% CI [0.78, 0.90], an intra-observer inter-person correlation of 0.03, 95% CI [0.00, 0.16], and a coefficient of variation of 0.17, 95% CI [0.14, 0.21] was demonstrated. Four percent of the study population had areas of secondary hyperalgesia both below the 1stand above the
3rdquartile considering all included participants. Heat pain detection threshold predicted
area of secondary hyperalgesia with an adjusted R2of 0.20 (P = 0.0006). a11111
OPEN ACCESS
Citation:Hansen MS, Wetterslev J, Pipper CB, Østervig R, Asghar MS, Dahl JB (2016) The Area of Secondary Hyperalgesia following Heat Stimulation in Healthy Male Volunteers: Inter- and Intra-Individual Variance and Reproducibility. PLoS ONE 11(5): e0155284. doi:10.1371/journal.pone.0155284
Editor:Branko Aleksic, Nagoya University Graduate School of Medicine, JAPAN
Received:September 18, 2015
Accepted:March 29, 2016
Published:May 11, 2016
Copyright:© 2016 Hansen et al. This is an open access article distributed under the terms of the
Creative Commons Attribution License, which permits unrestricted use, distribution, and reproduction in any medium, provided the original author and source are credited.
Data Availability Statement:All relevant data are within the paper and its Supporting Information files.
Funding:This work was supported by Doctor Fritz Karner and Wife’s Foundation (in Danish: Læge Fritz Karner og Hustrus Fond), no grant number available, no URL available: MSH and JBD received the funding. The Foundation for Medical Science’s Advancement (in Danish: Fonden for
Conclusions
We have demonstrated a low intra-individual, and a high inter-individual variation in ther-mally induced secondary hyperalgesia. We conclude that brief thermal sensitization pro-duce secondary hyperalgesia with a high level of reproducibility, which can be applied to investigate different phenotypes related to secondary hyperalgesia in healthy volunteers.
Trial Registration
clinicaltrials.govNCT02166164
Introduction
Clinical pain models are important in order to investigate basic physiologic pain responses in both healthy volunteers and patients. Such models play an important role in translational stud-ies and are necessary to bridge the gap between animal and human pain research.
There are numerous pain models, employed to investigate different aspects of the human physiologic pain response [1,2]. Models applying nociceptive stimulation to the skin, by heat [3–8], cold [9] or electrical stimuli [10] can be used in investigation of injury-induced sensitiza-tion of the central nervous system. Central sensitizasensitiza-tion is believed to be an important factor in the development and maintenance of pain, and represents an uncoupling of the nociceptive stimulus and the nociceptive response [11]. Likewise, central sensitization may have a promi-nent role in the inter-individual differences in pain sensitivity; the concept that different indi-viduals experience different levels of pain when exposed to identical noxious or nociceptive stimuli.
A standardized heat injury of the skin results in primary hyperalgesia at the site of injury, and secondary hyperalgesia surrounding the traumatized area [1,3–8]. Injury-induced second-ary hyperalgesia is characterized by reduced thresholds for mechanical stimulation, and is sup-posed to result from an altered central processing of mechano- and nociceptive input in A-fibers from the periphery, so that activation of these A-fibers produce painful sensations [11–14].
Moreover, a significant inter-individual difference in the size of the area of secondary hyper-algesia may persist, implying that the development of secondary hyperhyper-algesia may be a pheno-typic expression [15]. The inter-individual differences in areas of secondary hyperalgesia may be due to genetic [16], physiologic, and psychological differences [17], as well as differences in brain activation during pain stimulation [18]; however, further studies are needed to confirm this hypothesis.
Several pain models investigating cutaneous sensitization exist—each investigating different aspects of cutaneous sensitization. Brief thermal sensitization (BTS) [4–8] induces short lasting cutaneous sensitization, ideal for multiple inductions throughout a study day. With the BTS-model the skin is heated to 45°C for 3 min., resulting in mild pain perception, and short lasting secondary hyperalgesia [4–8]. Thus, the BTS-model can be applied in investigation of central sensitization. To our knowledge there have been no prospective trials investigating intra-indi-vidual, inter-indiintra-indi-vidual, and inter-investigator variances of areas of secondary hyperalgesia fol-lowing BTS. Validation of the models is paramount, and methodological sound studies investigating the inter-and individual reproducibility, as well as the inter- and intra-investigator reproducibility are needed in order to validate the use of the models in future sci-entific research [19,20].
and analysis, decision to publish, or preparation of the manuscript.
The primary aim of this prospective cohort study was to investigate the intra-individual and inter-individual variance in secondary hyperalgesia elicited by brief thermal sensitization in healthy male volunteers.
Material and Methods
The study was registered at clinicaltrials.gov (NCT02166164), and approved by the Danish Regional Committee on Health Research Ethics (Identifier: H-4-2014-027), and the Danish Data Protection Agency (Identifier: 30–1217). Informed written consent was obtained from all participants before inclusion in the study. The study was conducted at the Department of Anaesthesiology, 4231, Rigshospitalet, Copenhagen, Denmark, in the period from June 10, 2014 to September 17, 2014.
Study design
This prospective cohort study was designed to evaluate the method of BTS, and consisted of four identical experimental days and one information/inclusion day. To prevent carry-over effects, the information day and each of the four experimental days were separated by a mini-mum of seven days.
The participants were tested with three procedures, brief thermal sensitization (BTS), heat pain detection threshold (HPDT), and pain during 1 min. thermal stimulation (p-TS) (for defi-nitions, see below) on the four separate experimental days in a predefined sequence (see Ran-domization and allocation concealment).
All the pain models were performed with the computer-controlled Somedic Senselab MSA Thermotester™; size 2.5x5 cm.
On the information day the participants were given the psychological tests Pain Catastro-phizing Scale (PCS) and Hospital Anxiety and Depression Score (HADS). The participants completed the PCS and HADS questionnaires and handed them back on the first experimental day in a concealed opaque envelope to ensure blinding. Opening of the envelopes were post-poned until all participants had completed all four experimental days.
In order to investigate the inter-investigator variance, two different investigators were responsible for the testing on the different experimental days. Each participant was tested on four different study days. Two different investigators performed the testing. Every participant was thus tested by each investigator independently on two separate days—the order of the days being randomized.
The investigators were trained in performing the assessments similarly, but conducted the tests independently of each other. Test results were placed in an opaque sealed envelope to ensure blinding between the two investigators.
Study participants
50 healthy male volunteers were included (Fig 1). Informed consent was obtained from all included participants. Participants were recruited by advertisement in the medical student magazine and online atwww.forsøgspersoner.dk. Inclusion criteria were: Male sex, age18 years and35 years, speak and understand the Danish language, and signed informed consent. Exclusion criteria were: Failure to cooperate to the tests, alcohol and/or substance abuse, con-summation of analgesics within 48 hours before experimental day, concon-summation of prescrip-tion medicine within the last 30 days before experimental day, history of chronic pain, psychiatric diagnoses, tattoos on the extremities, and a Body Mass Index (BMI) of>30 kg/m2
Setting
The study was conducted in a quiet secluded room (temperature 22–25 degrees Celsius), where only the study participant and the responsible investigator were present. The participant was placed in a supine position during the assessment. The study was conducted during the time from 8.00 AM to 5.00 PM.
Pain models
Brief thermal sensitization (BTS). Induction of BTS was performed anterior on the right
thigh, in the midline between the anterior superior iliac spine and the base of patella [4–8]. The
Fig 1. Flowchart of included study participants.
skin was heated to 45°C for 3 min. After 3 min., while the 45°C thermode was still placed on the skin, the assessment of secondary hyperalgesia was performed (see section“assessment of secondary hyperalgesia”). The assessment of secondary hyperalgesia took approximately 1–2 minutes, with a maximum duration of heat stimulation of 5 min.
Pain during 1 min. thermal stimulation (p-TS). Evaluation of p-TS was performed on
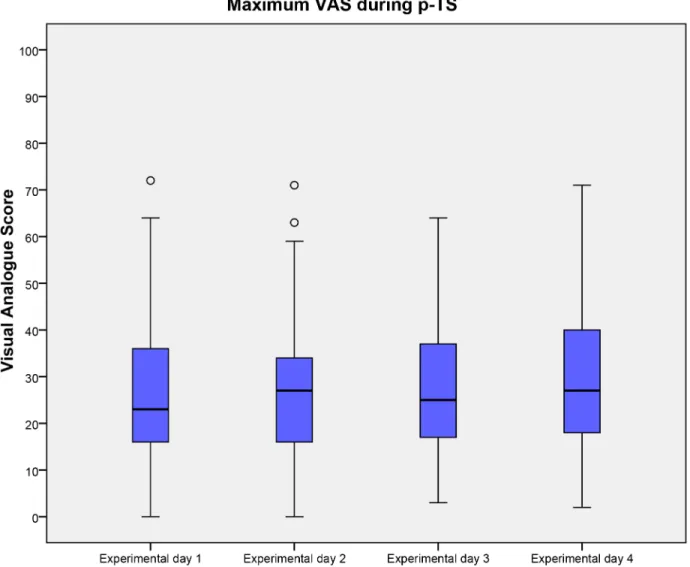
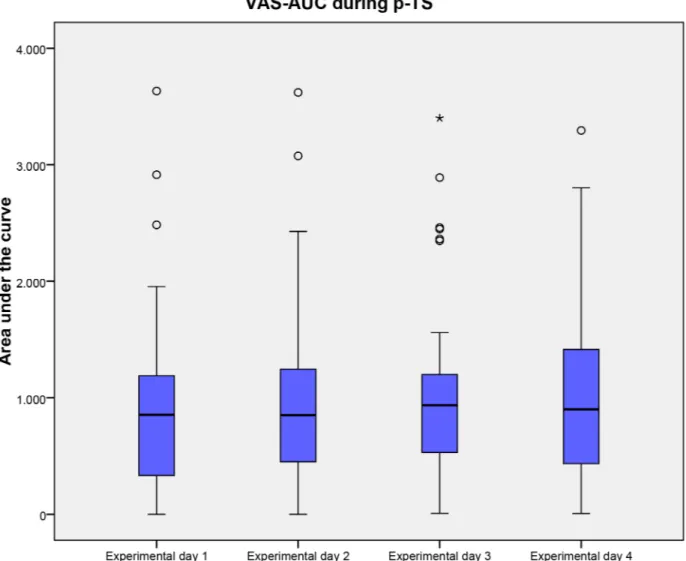
the anterior aspect of the non-dominant volar side of the forearm [5,21–24]. The participant’s skin was heated to 45°C for 1 min., while the participant performed continuous evaluation of pain on an electronic visual analogue scale (VAS, 0 mm = no pain; 100 mm = worst pain imag-inable). A maximum (Max.)-VAS and a VAS-Area under the curve (AUC) were registered. The participant was not able to see the computer-screen during the assessment.
Heat pain detection threshold (HPDT). The skin on the dominant anterior volar side of
the forearm was heated with an increase in temperature of 1°C/sec (initial temperature 32°C)
[5,8,21–24]. The study participant stated when the heat was perceived as painful by pressing a
button, and the temperature was registered. The HPDT was calculated as an average of 4 stim-ulations. Each stimulation was performed with an interval of 6–10 seconds. The participant was not able to see the computer-screen during the assessment.
Assessment of secondary hyperalgesia. The area of secondary hyperalgesia was evaluated
following BTS. The area was quantified by stimulation with a 19G monofilament (Von Frey hair) in 4 linear paths arranged 90° around the center of the heat-stimulation. The monofila-ment stimulation was initiated in normal skin, and advanced in steps of 5 mm with 1-second intervals towards the center of the heat-stimulation until the participant stated a clear change in the sensation (burning, intense pricking, tenderness). The borders were marked with a felt pen, and the transverse and longitudinal axes were measured with a pliable measuring tape for rectangular area calculation [4–8,15,21–27].
The area of primary hyperalgesia was defined as the area directly heated by the thermode (2.5x5 cm). The surrounding area with decreased mechanical thresholds was defined as the area of secondary hyperalgesia. For calculations, the area of the thermode (2.5x5 cm) was not subtracted from the total area of secondary hyperalgesia.
Psychological testing
Hospital Anxiety and Depression Scale (HADS). HADSis a questionnaire consisting of
14 questions [28]. HADS evaluates depression and anxiety, and can be subdivided in HAD-S-Anxiety and HADS-Depression. The highest achievable score is 42.
Pain Catastrophizing Score (PCS). PCSis a questionnaire consisting of 13 questions [29]
and can be subdivided into 3 subtests that each evaluates the central elements in catastrophiz-ing: Rumination, magnification, and helplessness. The highest achievable score is 52.
Outcomes
Primary outcome. To determine the and inter-participant variance, and the
intra-and inter-investigator variance of the secondary hyperalgesia areas following BTS on 4 separate experimental days with two different observers.
Secondary outcomes. To investigate:
1. How precise the scores of PCS and HADS predict the size of the area of secondary hyperalgesia.
3. How precise the HPDT evaluated on the 4 experimental days predicts the area of secondary hyperalgesia on the respective 4 experimental days.
4. How precise the Maximum VAS-score following p-TS evaluated on the 4 experimental days predicts the area of secondary hyperalgesia on the respective 4 experimental days.
5. How precise the VAS-AUC following p-TS evaluated on the 4 experimental days predicts the area of secondary hyperalgesia on the respective 4 experimental days
Sample size estimation
Estimation of the number of participants, investigators and experimental days were based on statistical simulations based on data from a previous study [4]. The simulations demonstrated that a scenario with 2 investigators, 4 experimental days and 50 study participants would enable us to discern the relevant variance components with acceptable precision.
For full documentation of statistical simulations, please see supporting information avail-able online (S1 Appendix).
Randomization and allocation concealment
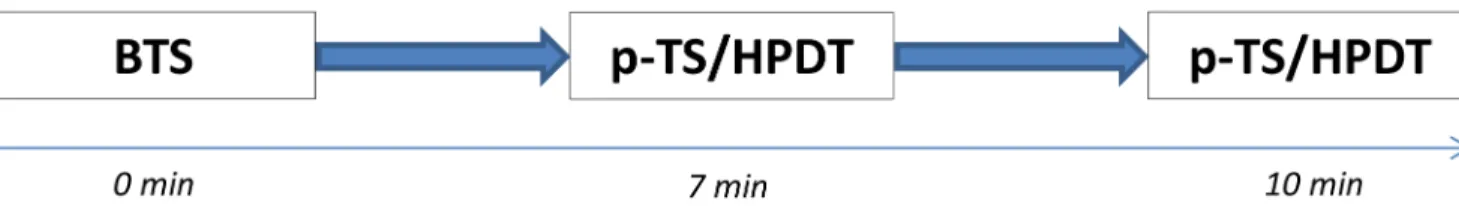
The reproducibility of the area of secondary hyperalgesia following BTS was the primary out-come. Thus, in order to avoid possible carry over effects of the HPDT and p-TS, all study days began with BTS. Testing with HPDT and p-TS were therefore subsequent to BTS on all study days; However, the sequence of testing (HPDT and p-TS) was randomized for each patient and each experimental day, so that on two of the four experimental days the sequence was: 1) BTS, 2) HPDT, 3) p-TS, and on the remaining two study days the sequence was: 1) BTS, 2) p-TS, 3) HPDT (Fig 2).
The investigator responsible for testing and registration of data on the respective experi-mental day was randomized, so the same investigator was not responsible for testing the same participant on two consecutive experimental days. The allocation sequence of participants to investigator, and the test allocation sequence (HPDT and p-TS) were randomly generated via a computer by the data manager at Copenhagen Trial Unit.
The randomization of the test allocation sequence was kept in opaque sealed envelopes pre-pared by Copenhagen Trial Unit to ensure allocation concealment. The envelopes remained sealed until immediately before the testing.
Statistical analysis
The variation in the areas of secondary hyperalgesia derived from the study participant, the experimental day, and the investigator was determined using a variance component model. For each of the 5 secondary outcomes, the ability of PCS, HADS, HPDT, Max-VAS and VAS-AUC (following p-TS), to predict individual variations in areas of secondary hyperalgesia
was investigated by linear regression on the estimated best linear unbiased predictors (EBL-UPS) of individual secondary hyperalgesia extracted from the primary analysis. HPDT, Max-VAS, and VAS-AUC profiles were also summarized in terms of EBLUPS.
Significance of the predictors was assessed by Analysis of variance (ANOVA) methods and their predictive abilities were quantified with various summaries of prediction errors including 95% prediction intervals for the predictions. Model reduction was done by means of backwards elimination with a cut-off value of 5%.
The variation in the areas of secondary hyperalgesia described in the primary outcomes will be reported as Intraclass Correlations (ICC) and Coefficient of Variations (CV).
The predictive abilities of the variables described in the secondary outcomes are summa-rized by adjusted R2and illustrated by 95% predictive intervals for selected values of the remaining predictor.
Reproducibility of area of secondary hyperalgesia
We planned to categorize the participants in three groups according to the mean size of the area of secondary hyperalgesia:“Small-area”(1stquartile),“medium-area”(2ndand 3rd quar-tile), and“large-area”(4thquartile).
Based on the study performed by Werner et al. [15] we expected measures of reproducibility as detailed below:
1. Intraclass correlation coefficient (ICC) around 0.74, corresponding to an intra-participant variance of approximately 25% of the inter-individual variance.
2. A pooled mean intra-participant CV around 0.25
3. No more than 10% of the study participants change group from“small-area”to“large-area”
or vice versa
Results
All study participants completed the study, and all study participants were analyzed for pri-mary and secondary outcomes (Fig 1).
Data on participants’characteristics are presented inTable 1. The median interval between the information day, experimental day 1, 2, 3 and 4 was 12 (Range; 7–33), 9 (7–35), 15 (7–61) and 8.5 (7–37) days respectively.
No adverse or serious adverse events were reported.
The results from this study has previously been presented in abstract form [30].
Secondary hyperalgesia following BTS
The secondary hyperalgesia following BTS was evaluated on the 4 separate experimental days by 2 different investigators (1 investigator per experimental day). We found (i) an
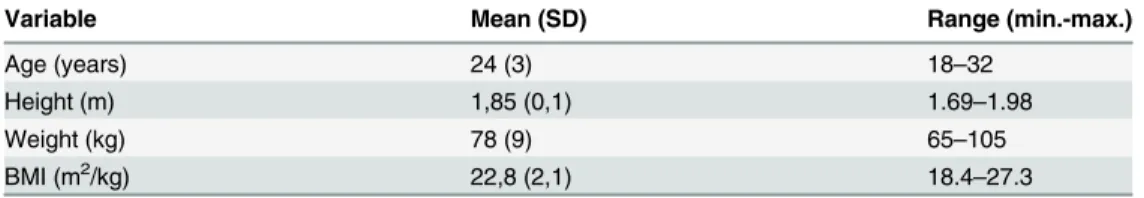
intra-Table 1. Characteristics of included participants.
Variable Mean (SD) Range (min.-max.)
Age (years) 24 (3) 18–32
Height (m) 1,85 (0,1) 1.69–1.98
Weight (kg) 78 (9) 65–105
BMI (m2/kg) 22,8 (2,1) 18.4
–27.3
investigator intra-participant correlation of 0.85, 95% CI (0.78, 0.90), (ii) an inter-investigator intra-participant correlation of 0.82 (0.69, 0.89), (iii) an intra-investigator inter-participant correlation of 0.03 (0.00, 0.16), and (iv) a coefficient of variation of 0.17 (0.14, 0.21).
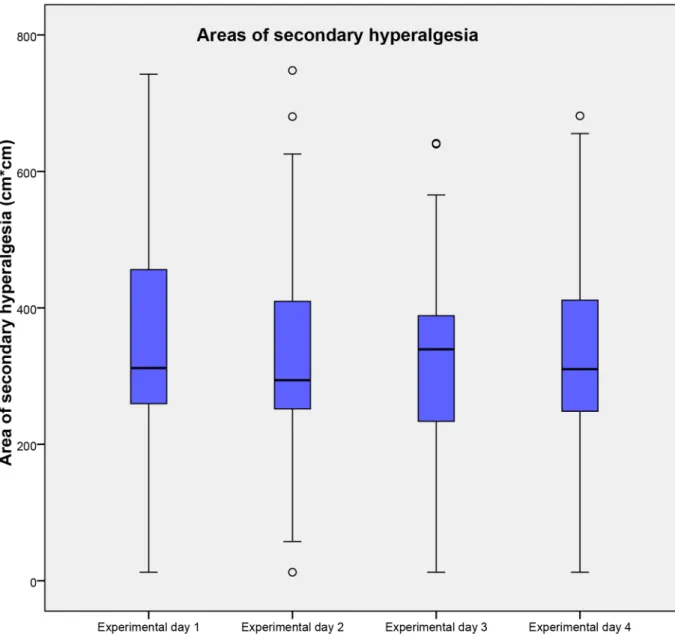
Only 2 participants, 4% (1%, 13%) of the total population, had areas of secondary hyperalge-sia in both below the 1stquartile and above the 3rdquartile, considering the total population. The sizes of the areas of secondary hyperalgesia as well as the results of the ICC are presented in Tables2and3andFig 3, respectively.
Predictive factors of the area of secondary hyperalgesia
The ability of HPDT, Max-VAS (following p-TS), VAS-AUC (following p-TS), PCS and HADS to predict inter-individual variations in area of secondary hyperalgesia was investigated. After backwards elimination with a cut-off value of 5% only HPDT offered a statistically signif-icant prediction of the area of secondary hyperalgesia with an adjusted R2of 0.20 (P = 0.0006). No other evaluated factors significantly predicted the area of secondary hyperalgesia. Results of HPDT, Max-VAS (following p-TS), VAS-AUC (following p-TS), PCS and HADS are pre-sented in Tables4and5and Figs4,5and6.
Discussion
The aim of this study was to investigate the intra-individual, inter-individual, and inter-investi-gator variances of BTS-elicited areas of secondary hyperalgesia, in order to examine the repro-ducibility of the pain model. There are no gold standards for reprorepro-ducibility; however, prior to our study we defined three criteria, hypothesized using data from previous studies. In order to confirm the reproducibility of the model, all three criteria had to be fulfilled (seemethods). Firstly, we demonstrated an inter-investigator intra-participant correlation of 0.82 (0.69, 0.89), secondly we found a coefficient of variation of 0.17 (0.14, 0.21), and lastly we demonstrated that only two participants, 4% (1%, 13%) of the total population, had areas of secondary hyper-algesia in both below the 1stquartile and above the 3rdquartile, considering the total
Table 2. Median size of the area of secondary hyperalgesia.
QST Experimental day 1 Experimental day 2 Experimental day 3 Experimental day 4
Median (IQR) Range Median (IQR) Range Median (IQR) Range Median (IQR) Range
BTS* 311.9 (256.6–457.0) 12.5–742.5 294.0 (250.5–417.3) 12.5–748.0 339.3 (231.7–389.9) 12.5–641.3 310.1 (244.1–413.3) 12.5–681.5
Median size and range of areas of secondary hyperalgesia following BTS on the four experimental days *Medians, IQRs and ranges are given in Cm2
Abbreviations: QST, Quantitative Sensory Testing; BTS, Brief thermal sensitization, IQR, Interquartile range doi:10.1371/journal.pone.0155284.t002
Table 3. Main results.
Parameter Result (95% CI)
ICCIntra-investigator intra-participant 0.85 (0.78–0.90)
ICCInter-investigator intra-participant 0.82 (0.69–0.89)
ICCIntra-investigator inter-participant 0.03 (0.0–0.16)
CV 0.17 (0.14–0.21)
Intraclass Correlations and Coefficient of Variation. Abbreviations: ICC, Intra Class Correlation; CV, Coefficient of Variation
population. By evaluating the point estimates, all three criteria are fulfilled, and according to our pre-defined criteria, we have demonstrated that BTS is a reproducible model in regards to eliciting secondary hyperalgesia in healthy volunteers. The rather high ICCs and low CV dem-onstrate a high reliability and reproducibility respectively.
We also demonstrated that HPDT significantly predicted the area of secondary hyperalge-sia. Our study was not designed to detect the correlation between HPDT and areas of second-ary hyperalgesia; however, we find a highly significant result (P = 0.0006). An adjusted R2of 0.20 is nonetheless an indication that HPDT only offers a very modest explanation of the varia-tion in BTS, which poses the quesvaria-tion: How precise does HPDT predict areas of secondary hyperalgesia? In the current study, we estimated a prediction interval for BTS to (53.14–
515.43) given a HPDT of 46°C, indicating wide prediction intervals. The possible variation of
Fig 3. Areas of secondary hyperalgesia following BTS.Areas of secondary hyperalgesia on the 4 experimental days following brief thermal sensitization. Medians and interquartile ranges are displayed. Values higher than 1.5 times of upper quartile or lower quartile are designated as outliers and marked with °. Abbreviations: Cm, centimeter; BTS, Brief thermal sensitization.
BTS for a given HPDT value is huge and HPDT and secondary hyperalgesia following BTS may thus represent two different pain entities. HPDT has been demonstrated to be highly reproducible [31], and both HPDT and brief thermal sensitization activates peripheral A-delta and C-fibers [32]. However, the secondary hyperalgesia to punctate mechanical stimuli, that occurs as a result of central neuronal plasticity of the nociceptive system is mediated by A-fiber nociceptors, not C-fibers [11–14]. Thus, secondary hyperalgesia as a result of central sensitiza-tion elicited by BTS may be significantly distinct from HPDT. To our knowledge, no studies have investigated this issue, and further studies are needed to confirm this hypothesis.
Individual characteristics, such as sex, and obesity, may influence pain thresholds and toler-ance [24,33–37]. Likewise it remains unclear whether the menstrual cycle influences the pain sensitivity in healthy women [38]. In addition we have no knowledge of what effect tattoos have on peripheral cutaneous sensitivity. To account for these variables, we applied strict inclu-sion and excluinclu-sion criteria, in order to minimize the unknown factors of variation. This enabled us to focus on the ability of BTS to produce an area of secondary hyperalgesia, rather than the influence of the individual characteristics of the participant.
Several clinical studies have demonstrated an association between psychological factors and pain [39,40]. In the present study the two psychological tests, HADS and PCS, did not signifi-cantly predict the area of secondary hyperalgesia. Our study was not designed to detect the cor-relation between psychological test scores and area of secondary hyperalgesia; however, post hoc analyses demonstrated that in order to investigate such a correlation with sufficiently high
Table 4. Heat pain detection threshold, and pain during 1 min. thermal stimulation.
QST Experimental day 1 Experimental day 2 Experimental day 3 Experimental day 4
Median (IQR) Range Median (IQR) Range Median (IQR) Range Median (IQR) Range
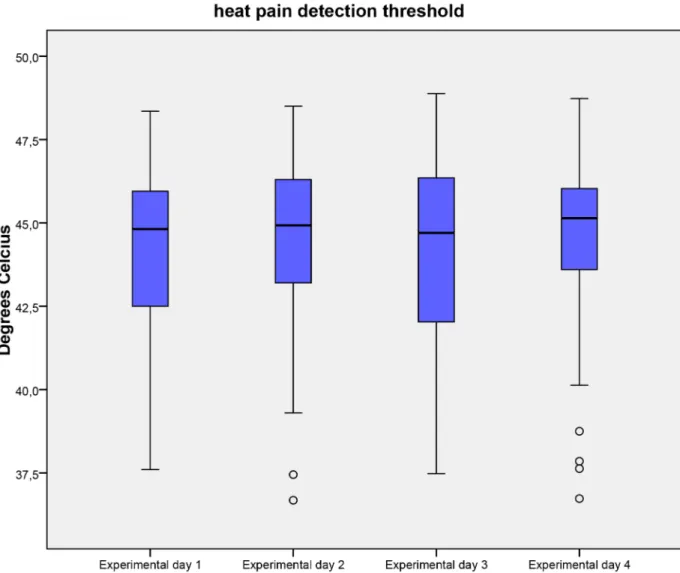
HPDT* 44.8 (42.4–46) 37.6–48.4 44.9 (43.1–46.3) 36.7–48.5 44.7 (42–46.4) 37.5–48.9 45.1 (43.6–46) 36.7–48.7
p-TS-max. VAS 23.0 (16–36) 0.0–72.0 27.0 (16–34) 0.0–71 25.0 (16.8–37.3) 3.0–64.0 27.0 (17.5–40) 2.0–71.0
p-TS-AUC VAS 853.8 (325.2–1198) 0.0–3663.0 851.8 (448.3–1275.3) 0.0–3620.50 936.2 (523.4–1216.2) 8.8–3400.7 901.7 (421.1–1416.6) 6.9–3294.5
Median, IQR and range of HPDT, p-TS-max VAS and p-TS-AUC VAS on the 4 experimental days. *Medians, IQRs and ranges are given in °C
Abbreviations: QST, Quantitative Sensory Test; HPDT, Heat pain detection threshold; p-TS, pain during 1 min. thermal stimulation, Max., maximum; AUC, Area Under the Curve; VAS, Visual Analog Scale, IQR, Interquartile range
doi:10.1371/journal.pone.0155284.t004
Table 5. Scores of Pain Catastrophizing Scale and Hospital Anxiety and Depression Scale.
Psychological test Median (IQR) Range
PCSRumination 6 (3.8–8) 0–15
PCSMagnification 2 (1–4) 0–7
PCSHelplessness 3 (2–7) 0–19
PCSTotal 12 (7.8–18) 0–38
HADSAnxiety 4 (1–6) 0–12
HADSDepression 1 (1–3) 0–9
HADSTotal 5 (3–10) 0–18
Median, IQRs and range of the PCS and HADS. Total scores and scores of individual subtests are displayed. Abbreviations: PCS, Pain Catastrophizing Score; HADS, Hospital Anxiety and Depression Scale, IQR, Interquartile range
power, 300 healthy participants should have been included in the study. A plausible reason for the weak correlation between psychological test scores and secondary hyperalgesia may be that we included a very homogenous population of healthy volunteers, that all had relatively low scores on HADS and PCS. By including healthy volunteers in an experimental pain study, it can be speculated that only few persons with a high anxiety-index or high-catastrophizing scores are enrolled, because they rarely consider volunteering in experimental pain studies. Thus, avoidance of sampling bias may be difficult. Therefore, in order to minimize sampling bias when investigating a possible association of high psychological vulnerability and experi-mental pain entities, consecutive inclusion of patients awaiting surgery, or specific inclusion of healthy volunteers with high psychological vulnerability seems necessary.
When evaluating the area of secondary hyperalgesia there exist different methods [4–8,15,
18,21–27,41]. We chose a pragmatic approach that can be easily applied in a clinical setting by
non-specialists, and evaluated the area of secondary hyperalgesia with the same polyamide fila-ment (19g), in all the participants. Likewise, we chose a simple approach in calculating the area of secondary hyperalgesia, by using a 4 vector rectangular area calculation that has been
applied in several previous studies [4–8,15,21–27]. More favorable results may have been achieved by using the up-down method when applying punctate mechanical stimuli with the polyamide monofilaments [42]; however, our results demonstrate that the methods we applied were sufficient to demonstrate that BTS produce a reproducible area of secondary hyperalgesia.
The area of secondary hyperalgesia elicited by BTS may represent the level of central sensiti-zation in the individual participant. Woolf describes that different pain hypersensitivity syn-dromes may share a common contribution of central sensitization, and hypothesizes that the comorbidity of different clinical pain syndromes may be explained by a“central sensitization syndrome”[11]. Thus, individuals with high pain sensitivity may share common factors that may be identified prior to the development of chronic pain. Moreover, it unlocks the possibility that individuals can be“phenotyped”in regards to their pain hypersensitivity. The assessment of secondary hyperalgesia may be a tool for investigation of central sensitization, and thus, be applied as a predictive factor of e.g. postoperative pain. To our knowledge, only few studies have investigated the assessment of secondary hyperalgesia as a possible predictive factor of
Fig 5. maximum VAS during p-TS.Maximum visual analogue score during 1 min. thermal stimulation on the 4 experimental days. Medians and interquartile ranges are displayed. Values higher than 1.5 times of upper quartile or lower quartile are designated as outliers and marked with °. Abbreviations: VAS, Visual analogue score; p-TS, Pain during 1 min. thermal stimulation.
postoperative pain, with one study demonstrating no correlations between area of secondary hyperalgesia following burn injury [43], and another demonstrating that postoperative second-ary hyperalgesia around the surgical incision following an iliac crest bone harvest was predic-tive for the development of chronic postsurgical neuropathic pain [44]. Our results
demonstrate a high inter-participant variance in the area of secondary hyperalgesia. The pri-mary aim with this study was not to identify possible causal factors that could explain the high inter-participant variance; however our results are interesting and several factors could provide explanation for the remarkable inter-participant variance in an otherwise homogenous popula-tion. Factors such as stress [45], diet, including tryptophan intake [46,47], hormone levels [45], skin receptor density, anatomical and functional brain differences [18], as well as genetics [16] could have influenced our results. The area of secondary hyperalgesia as a phenotypic indicator of pain hypersensitivity, and as a predictor for the development of acute and chronic pain is yet unexplored and further research is needed in order to clarify this.
The applicability of quantitative sensory testing (QST) and experimental pain models in translational and clinical studies has been widely debated. Should QST be implemented in the daily clinical practice, and should trials investigating analgesics implement the use of experi-mental pain models? When evaluating the increasingly body of research performed on QST and pain models, the main problem appears to be the heterogeneity in study methodology and statistical approaches [1,48]. When using QST it is recommend that intra-participant reliabil-ity is determined [19]. Thus, before QST and experimental pain models can be fully imple-mented in clinical studies, reliability of the individual models is necessary. This means that several prospective methodological studies of the individual models should be performed [49]; evaluating intra- and inter-participant variance, as well as intra- and inter-investigator vari-ance. Moreover, general accepted measures of reproducibility are needed. So far, no general recommendations have been proposed on how reproducible or reliable the various pain models or QSTs should be before they are implemented in translational or clinical research [50]. In the present study, we attempted to pre-define measures of reproducibility based on an earlier retro-spective study [15]. This is in our opinion an important strength, and hypotheses regarding reproducibility/reliability should be implemented in study design as well as sample size analysis in future studies. If a test is not reliable and/or reproducible, then it cannot be used as tool in a diverse scientific community.
Our study has some limitations. Firstly, the two investigators were trained to perform BTS in precisely the same manner. That includes the assessment of secondary hyperalgesia, as well as the information given to the participants. This means, that if two entirely independent inves-tigators were to perform the assessment without rigorous simultaneous training, the inter-investigator variance might increase. Moreover, even though our simulation study (see sup-porting information:S1 Appendix, simulation study 2, Figs4and5) demonstrated that a sce-nario with 2 investigators and 50 study participants would enable us to discern the relevant variance components with acceptable precision, a higher number of independent observers is required to obtain final conclusions on the inter-observer variance and inter-study
comparisons.
Secondly, we applied BTS on a highly homogenous population of healthy, male volunteers. Inclusion of women, elderly patients and chronic pain patients could potentially have increased the inter-participant variance with a clustering of effects in chronic pain patients. Thus, studies investigating a heterogeneous clinical population are needed in order to clarify the potential of BTS as a tool for evaluating both male and female patients, as well as the young and elderly population. Thirdly, we did not evaluate the participants’dietary intake or hormone levels. Studies have demonstrated that tryptophan may increase the pain sensitivity [46,47], and cor-tisol and testosterone levels may influence the pain sensitivity [45]. Consequently, control of the dietary intake may have decreased intra-participant variance, and evaluation of hormone levels may have been an explanatory factor in the high inter-participant variance in the area of secondary hyperalgesia.
Lastly, even though our HPDT was within the range reported in previous studies [51], it may be that the three participants with a mean HPDT below 40°C possibly misunderstood the procedure.
Supporting Information
S1 Appendix. Statistical simulation study.
(PDF)
S2 Appendix. All relevant study data.
(XLSX)
S3 Appendix. Trend Checklist.
(PDF)
S4 Appendix. Study protocol, original language, Danish.
(DOCX)
S5 Appendix. Study protocol, translated, English.
(DOCX)
Acknowledgments
We would like to thank research nurse Karen Lisa Hilsted for valuable comments to the con-ception and design of the study.
Author Contributions
Conceived and designed the experiments: MSH JBD MSA JW CBP RØ. Performed the experi-ments: MSH RØ. Analyzed the data: MSH CBP JW. Wrote the paper: MSH JBD MSA JW CBP RØ.
References
1. Reddy KS, Naidu MU, Rani PU, Rao TR. Human experimental pain models: A review of standardized methods in drug development. J Res Med Sci. 2012; 17(6):587–95. PMID:23626642; PubMed Central
PMCID: PMC3634303.
2. Handwerker HO, Kobal G. Psychophysiology of experimentally induced pain. Physiol Rev. 1993; 73 (3):639–71. PMID:8332641.
3. Moiniche S, Dahl JB, Kehlet H. Time course of primary and secondary hyperalgesia after heat injury to the skin. Br J Anaesth. 1993; 71(2):201–5. PMID:8123392.
4. Dirks J, Petersen KL, Dahl JB. The heat/capsaicin sensitization model: a methodologic study. J Pain. 2003; 4(3):122–8. PMID:14622709
5. Dirks J, Petersen KL, Rowbotham MC, Dahl JB. Gabapentin suppresses cutaneous hyperalgesia fol-lowing heat-capsaicin sensitization. Anesthesiology. 2002; 97(1):102–7. PMID:12131110.
6. Frymoyer AR, Rowbotham MC, Petersen KL. Placebo-controlled comparison of a morphine/dextrome-thorphan combination with morphine on experimental pain and hyperalgesia in healthy volunteers. J Pain. 2007; 8(1):19–25. doi:10.1016/j.jpain.2006.05.010PMID:17113353.
7. Petersen KL, Iyengar S, Chappell AS, Lobo ED, Reda H, Prucka WR, et al. Safety, tolerability, pharma-cokinetics, and effects on human experimental pain of the selective ionotropic glutamate receptor 5 (iGluR5) antagonist LY545694 in healthy volunteers. Pain. 2014; 155(5):929–36. PMID:24486883.
8. Petersen KL, Meadoff T, Press S, Peters MM, LeComte MD, Rowbotham MC. Changes in morphine analgesia and side effects during daily subcutaneous administration in healthy volunteers. Pain. 2008; 137(2):395–404. PMID:17977662.
9. Ruscheweyh R, Stumpenhorst F, Knecht S, Marziniak M. Comparison of the cold pressor test and con-tact thermode-delivered cold stimuli for the assessment of cold pain sensitivity. J Pain. 2010; 11 (8):728–36. doi:10.1016/j.jpain.2009.10.016PMID:20338822.
10. Koppert W, Dern SK, Sittl R, Albrecht S, Schuttler J, Schmelz M. A new model of electrically evoked pain and hyperalgesia in human skin: the effects of intravenous alfentanil, S(+)-ketamine, and lido-caine. Anesthesiology. 2001; 95(2):395–402. PMID:11506112.
12. Latremoliere A, Woolf CJ. Central sensitization: a generator of pain hypersensitivity by central neural plasticity. J Pain. 2009; 10(9):895–926. doi:10.1016/j.jpain.2009.06.012PMID:19712899
13. Ziegler EA, Magerl W, Meyer RA, Treede RD. Secondary hyperalgesia to punctate mechanical stimuli. Central sensitization to A-fibre nociceptor input. Brain. 1999; 122 (Pt 12):2245–57. PMID:10581220.
14. Treede RD. Chapter 1 Pain and hyperalgesia: definitions and theories. Handb Clin Neurol. 2006; 81:3–
10. doi:10.1016/S0072-9752(06)80005-9PMID:18808823.
15. Werner MU, Petersen KL, Rowbotham MC, Dahl JB. Healthy volunteers can be phenotyped using cuta-neous sensitization pain models. PLoS One. 2013; 8(5):e62733. doi:10.1371/journal.pone.0062733. Print 2013. PMID:23671631
16. Diatchenko L, Slade GD, Nackley AG, Bhalang K, Sigurdsson A, Belfer I, et al. Genetic basis for individ-ual variations in pain perception and the development of a chronic pain condition. Hum Mol Genet. 2005; 14(1):135–43. doi:10.1093/hmg/ddi013PMID:15537663.
17. Hansen MS, Horjales-Araujo E, Dahl JB. Associations between psychological variables and pain in experimental pain models. A systematic review. Acta Anaesthesiol Scand. 2015; 59(9):1094–102. doi:
10.1111/aas.12555PMID:26088747.
18. Asghar MS, Pereira MP, Werner MU, Martensson J, Larsson HB, Dahl JB. Secondary Hyperalgesia Phenotypes Exhibit Differences in Brain Activation during Noxious Stimulation. PLoS One. 2015; 10(1): e0114840. doi:10.1371/journal.pone.0114840PMID:25615578; PubMed Central PMCID:
PMC4304709.
19. Dyck PJ. Quantitative sensory testing: a consensus report from the Peripheral Neuropathy Association. Neurology. 1993; 43(5):1050–2. PMID:8388089.
20. Siao P, Cros DP. Quantitative sensory testing. Phys Med Rehabil Clin N Am. 2003; 14(2):261–86.
PMID:12795516.
21. Petersen KL, Jones B, Segredo V, Dahl JB, Rowbotham MC. Effect of remifentanil on pain and second-ary hyperalgesia associated with the heat—capsaicin sensitization model in healthy volunteers.
Anes-thesiology. 2001; 94(1):15–20. PMID:11135717.
22. Dirks J, Petersen KL, Rowbotham MC, Dahl JB. Effect of systemic adenosine on pain and secondary hyperalgesia associated with the heat/capsaicin sensitization model in healthy volunteers. Reg Anesth Pain Med. 2001; 26(5):414–9. doi:10.1053/rapm.2001.22256aPMID:11561260.
23. Cavallone LF, Frey K, Montana MC, Joyal J, Regina KJ, Petersen KL, et al. Reproducibility of the heat/ capsaicin skin sensitization model in healthy volunteers. J Pain Res. 2013; 6:771–84. doi:10.2147/
JPR.S53437PMID:24232380; PubMed Central PMCID: PMC3827105.
24. Jensen MT, Petersen KL. Gender differences in pain and secondary hyperalgesia after heat/capsaicin sensitization in healthy volunteers. J Pain. 2006; 7(3):211–7. doi:10.1016/j.jpain.2005.10.013PMID:
16516827.
25. Mikkelsen S, Dirks J, Fabricius P, Petersen KL, Rowbotham MC, Dahl JB. Effect of intravenous magne-sium on pain and secondary hyperalgesia associated with the heat/capsaicin sensitization model in healthy volunteers. Br J Anaesth. 2001; 86(6):871–3. PMID:11573598.
26. Petersen KL, Brennum J, Dahl JB. Experimental evaluation of the analgesic effect of ibuprofen on pri-mary and secondary hyperalgesia. Pain. 1997; 70(2–3):167–74. PMID:9150290.
27. Petersen KL, Rowbotham MC. A new human experimental pain model: the heat/capsaicin sensitization model. Neuroreport. 1999; 10(7):1511–6. PMID:10380972.
28. Zigmond AS, Snaith RP. The hospital anxiety and depression scale. Acta Psychiatr Scand. 1983; 67 (6):361–70. PMID:6880820
29. Sullivan MJL, Bishop SR, Pivik J. The Pain Catastrophizing Scale: Development and validation. Psy-chol Assess. 1995; 7(4):524–32.
30. Hansen MS, Wetterslev J, Pipper CB, Asghar MS, Dahl JB, editors. The area of secondary hyperalge-sia to heat stimulation characterizes healthy volunteers Conference Abstract Scandinavian Society of Anaesthesiology and Itensive care; 2015; Reykjavik, Iceland.
31. Khambam SK, Naidu MU, Rani PU, Rao TR. A simple contact heat experimental pain model for evalua-tion of analgesic agents in healthy volunteers. Curr Ther Res Clin Exp. 2011; 72(6):233–42. doi:10.
1016/j.curtheres.2011.11.001PMID:24648591; PubMed Central PMCID: PMC3957161.
32. McCormack K, Prather P, Chapleo C. Some new insights into the effects of opioids in phasic and tonic nociceptive tests. Pain. 1998; 78(2):79–98. PMID:9839818.
33. Alabas OA, Tashani OA, Tabasam G, Johnson MI. Gender role affects experimental pain responses: a systematic review with meta-analysis. Eur J Pain. 2012; 16(9):1211–23. doi:10.1002/j.1532-2149.
34. Bartley EJ, Fillingim RB. Sex differences in pain: a brief review of clinical and experimental findings. Br J Anaesth. 2013; 111(1):52–8. doi:10.1093/bja/aet127PMID:23794645; PubMed Central PMCID:
PMC3690315.
35. Campesi I, Fois M, Franconi F. Sex and gender aspects in anesthetics and pain medication. Handb Exp Pharmacol. 2012;(214: ):265–78. doi:10.1007/978-3-642-30726-3_13PMID:23027455.
36. Mogil JS. Sex differences in pain and pain inhibition: multiple explanations of a controversial phenome-non. Nat Rev Neurosci. 2012; 13(12):859–66. doi:10.1038/nrn3360PMID:23165262.
37. Okifuji A, Hare BD. The association between chronic pain and obesity. J Pain Res. 2015; 8:399–408.
doi:10.2147/JPR.S55598PMID:26203274; PubMed Central PMCID: PMC4508090.
38. Iacovides S, Avidon I, Baker FC. Does pain vary across the menstrual cycle? A review. Eur J Pain. 2015; 19(10):1389–405. Epub 2015 Apr 21. PMID:25899177
39. Granot M, Ferber SG. The roles of pain catastrophizing and anxiety in the prediction of postoperative pain intensity: a prospective study. Clin J Pain. 2005; 21(5):439–45. PMID:16093750.
40. Papaioannou M, Skapinakis P, Damigos D, Mavreas V, Broumas G, Palgimesi A. The role of catastro-phizing in the prediction of postoperative pain. Pain Med. 2009; 10(8):1452–9. Epub 2009 Oct 26.
PMID:19863742
41. Pedersen JL, Kehlet H. Secondary hyperalgesia to heat stimuli after burn injury in man. Pain. 1998; 76 (3):377–84. PMID:9718256.
42. Chaplan SR, Bach FW, Pogrel JW, Chung JM, Yaksh TL. Quantitative assessment of tactile allodynia in the rat paw. J Neurosci Methods. 1994; 53(1):55–63. PMID:7990513.
43. Werner MU, Duun P, Kehlet H. Prediction of postoperative pain by preoperative nociceptive responses to heat stimulation. Anesthesiology. 2004; 100(1):115–9; discussion 5A. PMID:14695732.
44. Martinez V, Ben Ammar S, Judet T, Bouhassira D, Chauvin M, Fletcher D. Risk factors predictive of chronic postsurgical neuropathic pain: the value of the iliac crest bone harvest model. Pain. 2012; 153 (7):1478–83. PMID:22560289.
45. Choi JC, Chung MI, Lee YD. Modulation of pain sensation by stress-related testosterone and cortisol. Anaesthesia. 2012; 67(10):1146–51. doi:10.1111/j.1365-2044.2012.07267.xPMID:22804789.
46. Lieberman HR, Corkin S, Spring BJ, Growdon JH, Wurtman RJ. Mood, performance, and pain sensitiv-ity: changes induced by food constituents. J Psychiatr Res. 1982; 17(2):135–45. PMID:6764930.
47. Abbott FV, Etienne P, Franklin KB, Morgan MJ, Sewitch MJ, Young SN. Acute tryptophan depletion blocks morphine analgesia in the cold-pressor test in humans. Psychopharmacology (Berl). 1992; 108 (1–2):60–6. PMID:1410147.
48. Werner MU, Petersen MA, Bischoff JM. Test-retest studies in quantitative sensory testing: a critical review. Acta Anaesthesiol Scand. 2013; 57(8):957–63. doi:10.1111/aas.12150PMID:23826705.
49. Geber C, Klein T, Azad S, Birklein F, Gierthmuhlen J, Huge V, et al. Test-retest and interobserver reli-ability of quantitative sensory testing according to the protocol of the German Research Network on Neuropathic Pain (DFNS): a multi-centre study. Pain. 2011; 152(3):548–56. PMID:21237569.
50. Shy ME, Frohman EM, So YT, Arezzo JC, Cornblath DR, Giuliani MJ, et al. Quantitative sensory test-ing: report of the Therapeutics and Technology Assessment Subcommittee of the American Academy of Neurology. Neurology. 2003; 60(6):898–904. PMID:12654951.