Microbiological Evaluation of Household
Drinking Water Treatment in Rural China
Shows Benefits of Electric Kettles: A
Cross-Sectional Study
Alasdair Cohen1,2*, Yong Tao3, Qing Luo3, Gemei Zhong4, Jeff Romm1, John M. Colford, Jr2, Isha Ray5
1Department of Environmental Science, Policy and Management, University of California, Berkeley, California, United States of America,2School of Public Health, University of California, Berkeley, California, United States of America,3National Center for Rural Water Supply Technical Guidance, Chinese Center for Disease Control and Prevention, Beijing, China,4Institute of Environmental Health and Endemic Disease Control, Guangxi Zhuang Autonomous Region Center for Disease Control and Prevention, Nanning, Guangxi, China,5Energy and Resources Group, University of California, Berkeley, California, United States of America
Abstract
Background
In rural China ~607 million people drink boiled water, yet little is known about prevailing household water treatment (HWT) methods or their effectiveness. Boiling, the most com-mon HWT method globally, is microbiologically effective, but household air pollution (HAP) from burning solid fuels causes cardiovascular and respiratory disease, and black carbon emissions exacerbate climate change. Boiled water is also easily re-contaminated. Our study was designed to identify the HWT methods used in rural China and to evaluate their effectiveness.
Methods
We used a geographically stratified cross-sectional design in rural Guangxi Province to col-lect survey data from 450 households in the summer of 2013. Household drinking water samples were collected and assayed for Thermotolerant Coliforms (TTC), and physico-chemical analyses were conducted for village drinking water sources. In the winter of 2013–
2104, we surveyed 120 additional households and used remote sensors to corroborate self-reported boiling data.
Findings
Our HWT prevalence estimates were: 27.1% boiling with electric kettles, 20.3% boiling with pots, 34.4% purchasing bottled water, and 18.2% drinking untreated water (for these analy-ses we treated bottled water as a HWT method). Households using electric kettles had the
OPEN ACCESS
Citation:Cohen A, Tao Y, Luo Q, Zhong G, Romm J, Colford JM, Jr, et al. (2015) Microbiological Evaluation of Household Drinking Water Treatment in Rural China Shows Benefits of Electric Kettles: A Cross-Sectional Study. PLoS ONE 10(9): e0138451. doi:10.1371/journal.pone.0138451
Editor:John J. Kelly, Loyola University Chicago, UNITED STATES
Received:May 22, 2015
Accepted:August 31, 2015
Published:September 30, 2015
Copyright:© 2015 Cohen et al. This is an open access article distributed under the terms of the Creative Commons Attribution License, which permits unrestricted use, distribution, and reproduction in any medium, provided the original author and source are credited.
Data Availability Statement:Due to legal restrictions, the National Center for Rural Water Supply & Technical Guidance (NCRWSTG) and the Chinese Center for Disease Control & Prevention (CCDC) do not share raw data related to water quality. At the discretion of the NCRWSTG and CCDC, exceptions to this policy may be made. Requests should be emailed [email protected] with this paper's title in the subject line.
#91744201-lowest concentrations of TTC (73% lower than households drinking untreated water). Multi-level mixed-effects regression analyses showed that electric kettles were associated with the largest Log10TTC reduction (-0.60,p<0.001), followed by bottled water (-0.45,p<0.001)
and pots (-0.44,p<0.01). Compared to households drinking untreated water, electric kettle users also had the lowest risk of having TTC detected in their drinking water (risk ratio, RR = 0.49, 0.34–0.70,p<0.001), followed by bottled water users (RR = 0.70, 0.53–0.93,p<0.05) and households boiling with pots (RR = 0.74, 0.54–1.02, p = 0.06).
Conclusion
As far as we are aware, this is the first HWT-focused study in China, and the first to quantify the comparative advantage of boiling with electric kettles over pots. Our results suggest that electric kettles could be used to rapidly expand safe drinking water access and reduce HAP exposure in rural China.
Introduction
Globally ~1.8 billion people lack access to safe drinking water [1,2]. After decades of uneven
success promoting household water treatment (HWT) using retail products such as chlorine
and ceramic filters, boiling remains the most common HWT method globally [3]. Although
boiling is microbiologically effective, household air pollution (HAP) from biomass and coal combustion causes cardiovascular and pulmonary disease, biomass harvesting is time-consum-ing, water boiled in pots is easily re-contaminated, and black carbon emissions exacerbate
cli-mate change [4–6].
Since the 1980s, China has invested heavily in rural development and drinking water
infra-structure. According to Joint Monitoring Program (JMP) data, from 1990–2012, 488 million
Chinese gained access to“improved”water sources (water utilities, boreholes, protected
springs, etc.) [7]. However, improved sources are not necessarily microbiologically safe sources
[1,2] and many smaller utilities in China do not regularly chlorinate drinking water. According
to one study, as few as 10.4% of recently built water utilities in rural China consistently used
disinfectants [8]. Contamination in bottled water is also a problem: 23.8% of the bottled water
tested in a recent government-led investigation fell below China’s national standards for water
safety [9].
There are few available national estimates of access to safe drinking water in China.
Accord-ing to a 2006–2007 nationwide survey led by the National Center for Rural Water Supply
Tech-nical Guidance (NCRWSTG), a specialized agency at the Chinese Center for Disease Control and Prevention (CCDC), 317 million rural Chinese lack access to microbiologically safe water
[10]. More recently, the Chinese Ministry of Environmental Protection reported that 280
mil-lion (rural and urban) Chinese lack access to safe water [11].
There is a strong cultural preference for boiled water in China where 85% of the rural
popu-lation (~607 million people) heats or boils its drinking water [10]. This figure includes many of
the households who purchase large (19L) bottles of drinking water. In rural China, most of the population combusts biomass or coal for boiling, cooking, and heating; the resulting HAP
exposure causes a number of negative health outcomes [11–14].
Despite the scale of these problems, in the water, sanitation, and hygiene (WASH) literature very little is known about HWT in China. This is in part because water quality is a politically
0) and the International Fund for Agricultural Development, a specialized United Nations agency (www.ifad.org). The funders had no role in study design, data collection and analysis, decision to publish, or preparation of the manuscript. Funding and support for data collection and water sample analyses were provided by the Chinese Center for Disease Control and Prevention (www.chinacdc.cn).
sensitive issue in China, and in part because available data is both limited and almost all in
Chi-nese-language sources [3]. When such sources do discuss water quality, concentrations and
risk classifications are rarely provided, and instead results are reported as being over or under
official standards (seeS1 Textfor more details). This study was born from a desire to better
understand existing HWT methods and their effectiveness in rural China, with the long-term goal of expanding access to safe water while reducing HAP exposure.
Methods
Field sites, study design, sample size, and village selection
Given our research focus on HWT in relatively poor rural areas of China, we selected the Guangxi Zhuang Autonomous Region (Guangxi) for our study. Home to ~47 million people,
Guangxi’s per capita GDP is one of the lowest among China’s provinces. Based on data from
their unpublished National Rural Environmental Health Monitoring survey, the Guangxi CCDC estimated that the boiling prevalence in rural Guangxi was 68%. We used this figure for our sample size calculations to estimate the prevalence of boiling with a desired precision of ±5%. There was no prior research or data available to calculate the intracluster correlation coef-ficient (ICC). We used rough estimates of boiling prevalence from our pilot work to estimate an ICC of 0.01 (in order to calculate the design effect). Using a constant of 30 households per village, this yielded a required sample size of 431 households. Our final sample was 450
house-holds (effective ICC = 0.012, design effect = 1.35 (seeS2 Text)).
In light of the sensitive nature of water quality data in China, we agreed to use codes for county and village names in all publications and presentations. One benefit of this arrangement was that, because no one outside our project team would know which specific counties and vil-lages had been selected, Guangxi county CCDC staff were comfortable providing feedback and critiques throughout our work. While not ideal, using codes for household research of this nature is not atypical in China.
We used a geographically stratified, population-weighted, multi-stage, cross-sectional design to select our study villages. After working with the Guangxi CCDC to select a relatively low-income county (County A) and a higher income county (County B), we used lists with up-to-date population data and population-based proportional sampling to randomly select study
townships and then 15 study villages. The mean 2012 reported annual income for villages 1–8
in County A was RMB 4,425 (USD 702), and for villages 9–15 in County B it was RMB 6,912
(USD 1,097).
Surveys, household sampling, and participant eligibility
For our primary survey, we used the Multidimensional Poverty Assessment Tool (MPAT)
Household Survey [15]. MPAT was designed to collect a wide range of household-level data,
has already been extensively tested in rural China [16,17], and is an open-source tool (all
mate-rials are available atwww.ifad.org/mpat). We also developed new survey modules on water use,
behaviors, attitudes [18,19], fuel use, and household ventilation; we added these to the end of
the MPAT survey. Following validation of the Chinese MPAT surveys, and double-blind trans-lation of the new survey questions, we conducted multiple rounds of piloting in a non-study county in June 2013.
After enumerator training and field practice, in August 2013, during the rainy/summer
sea-son, we surveyed 450 households in villages 1–15 (30 households per village). In December
because we expected to find higher rates of microbial contamination during the rainy season,
an assumption supported by recent research [20] (and subsequently by our summer-winter
data comparisons).
Our team used local government data to prepare numbered tabs of paper corresponding to all the households in each village. Village leaders were asked to randomly select 30 tabs out of a basket, with additional households then selected to address non-response. Since this was done in public, selected households often heard of our visit and understood they had been chosen by
chance (“like a lottery”) before enumerators visited their homes and read the consent
state-ment. Households were eligible for participation if an adult (age18 years) who lived in the
household (>9 months/year) was available and consented to participate (<4% of households
refused). Other details of the training and sampling procedures we used are explained in the
MPAT User’s Guide [15].
Water sampling, analyses, and temperature logging
Enumerators asked respondents to provide a cup of water as if the respondent were going to drink it. 500mL samples were collected aseptically and taken on ice to the county CCDC labo-ratories within six hours (in most cases). We did not control for chlorine residuals since we knew that, in practice, none of the local treatment plants or households used chlorine.
Experi-enced CCDC laboratory staff used Multiple Tube Fermentation, the CCDC’s official method
for the microbiological analysis of drinking water [21], to determine the Most Probable
Num-ber (MPN) of Total Bacteria (i.e., total aerobic bacteria count), Total Coliforms (TC), and
Thermotolerant Coliforms (TTC) per 100mL for each sample (seeS3 Textfor protocol details).
Following World Health Organization (WHO) guidelines, we used TTC as an indicator of fecal
contamination in drinking water [22].
To assess potential physicochemical contamination, CCDC enumerator supervisors
col-lected 5L samples from each village’s primary drinking water source(s). Samples were analyzed
in the CCDC county laboratories for Chloride (Cl-), Fluoride (F-), Iron (Fe), Nitrate (NO3-),
pH, Sulfate (SO4), total hardness, and turbidity (seeS3 Textfor details). During the winter
data collection, the lead author also collected village samples and analyzed them for Aluminum (Al), Fe, NO3-, Nitrite (NO2-), Phosphate (PO4), and SO4, using a Hach CEL/850 Basic Drinking Water Laboratory (Hach, Loveland, CO).
To corroborate self-report boiling frequency and duration data, during the winter data
col-lection we affixed Stove Use Monitoring System (SUMS) temperature loggers [23] to pots and
kettles in a subsample of 47 households, recording one temperature reading (range 0–125°C at
±1°C precision) per minute over 72 hours.
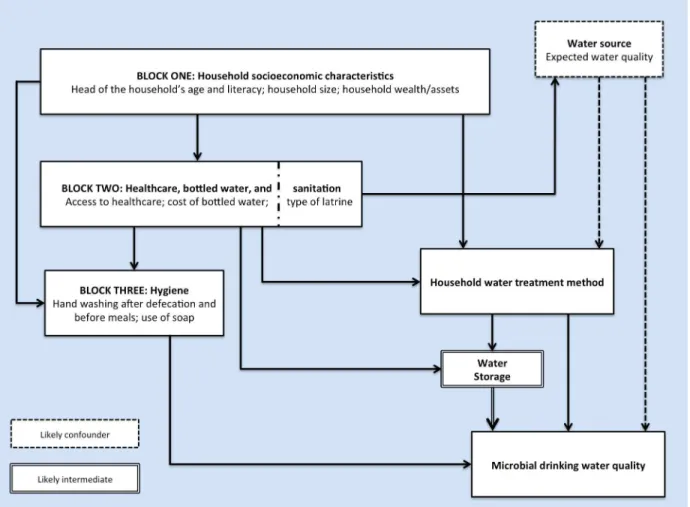
Conceptual framework for causal pathway analysis and modeling
Intermediate and confounding variables can mask or dampen the effect of an exposure (e.g., HWT) on an outcome (e.g., microbial water quality); as such, direct effects cannot beconfi-dently estimated if such variables are not also analyzed in isolation [24,25]. Conceptual
hierar-chies help to visualize how distal determinants (usually socioeconomic variables that remain stable in the short term) may impact an outcome via proximate determinants (usually factors that may be more amenable to interventions, such as the decision to treat drinking water or
not) [26,27].Fig 1shows the hierarchical conceptual framework we used to guide the step-wise
construction of our models. The hypothesized intermediate variable“water storage”
(safe = covered, unsafe = uncovered), and confounding variable“water source”(improved or
Data preparation and water quality outliers
Completed surveys were subjected to a three-stage quality control process [15] and data entry
was performed by staff at the NCRWSTG. Internal data consistency was assessed and two sur-veys from each village were randomly selected to manually check data entry accuracy. We used
a Log10transformation for the TC and TTC data after assigning a value of one to all cases
where TC or TTC were below the detection limit.
We identified 38 coliform-related outlier cases in the summer data (from 444 out of 450 households with TC and TTC data available). Of these outliers, 31 showed very high
concen-trations of TC (>2,000 MPN/100mL) but the corresponding TTC from the same samples were
below the detection limit or<2 MPN/100mL. The other seven outliers had TTC to TC ratios
1, indicating the same or more TTC contamination versus TC (a highly unlikely outcome).
Statistical analyses and multilevel mixed-effects modeling
For the summer data (n = 450), we applied sampling weights for population parameter estima-tion to balance the 240 households in County A and 210 households in County B. Missing data were ignored. We performed water quality related analyses with and without TTC outliers.
Our surveys included multiple overlapping questions related to drinking water and fuel use, allowing us to verify rates of primary (i.e., most of the time) HWT method use, and to
Fig 1. Simplified hierarchical conceptual framework of the primary factors that may impact the microbial contamination of drinking water.
disaggregate boiling by electric kettles and pots (i.e., metal pots or kettles, heated with wood, gas, crop residue, or coal). Initial analyses consisted of t-tests, Wilcoxon rank-sum, ANOVA,
Bonferroni tests, Scheffe’s tests, and assorted bivariate analyses. Bland-Altman plots were used
to compare SUMS data to self-reported winter boiling data.
Because our study households were deliberately clustered in villages, they could not be con-sidered independent units of analysis. Therefore, we used mixed-effects multilevel regression modeling (MLM) to examine the impact of HWT (the exposure) and other variables on the dependent variable, Log10TTC (the outcome), while controlling for confounders and interme-diates. The structure of our models can be better understood by referencing the
null/uncondi-tional variance components model (Eq 1).
yLog10TTCij ¼ b1þzjþij ð1Þ
Assuming,
ij~N (0,θ), withzjas the cluster-level error term
zj~N (0,ψ)for villagej,j= 1,2,3. . .15 (J is the total number of villages andβis the regression
coefficient).
InEq 1,irepresents each individual household andjrepresents each individual village (i.e.,
level-one unitiis clustered in level-two unitj). MLM allows us to break down the errors into
village-level residuals, denotedz, and household-level residuals within the clusters, denoted.
The between-cluster variance is denotedψ. Similar to the interpretation of residuals in ordinary
least squares (OLS) regression, the household-level residualijindicates the deviation from the
cluster (village) mean; this within-cluster variance is denotedθ. Thus, the total residual error
for a householdiin villagejis the sum ofzjandij. Assuming these two residuals are
indepen-dent, the total residual variance is the sum of the variance componentsψandθ. Because we
had a relatively small number of clusters (J = 15), and our data were balanced across clusters (30 households per village), we used Restricted Maximum Likelihood Estimation (REML) which provides less biased variance component estimates, as compared to Maximum
Likeli-hood Estimation (MLE) [28].
Following the calculation of the Null model (Eq 1), we analyzed Log10TTC associations with
HWT methods, and with potential confounder and intermediate variables combined and in
isolation (Models 1–6:S1 Table). Covariates were then added in a step-wise fashion based on
the block hierarchy inFig 1(Models 7–10:S2 Table). For all the models, we used likelihood
ratio tests to verify the need for MLM (versus OLS). For each model, R2was calculated by
tak-ing the difference in total variance between that model and the Null model, and dividtak-ing by the
Null model’s total variance [28]. The equation for the final, fully adjusted, model is
yLog10TTCij ¼ b1þb2BoilElecKettleijþb3BoilPotijþb4BottledWaterijþ
b5ImprovedSourceijþb6SafeStorageijþb7HeadHHLiteracyijþ
b8HeadHHageijþb9TVperCapijþb10BottledWPriceijþb11HandwashPDijþ
b12SoapUsedijþb13HandwashBMijþzjþij
ð2Þ
Assuming,
zj|xij~ N (0,ψ)
ij|zj,xij~ N(0,θ)
InEq 2,iare households,jare clusters (villages),zare cluster-level residuals,are
house-hold-level residuals,ψis the between-cluster variance, andθis the within-cluster variance. The
zero mean and variance assumptions are conditional on the model covariates, denoted by
We attempted to validate our models quantitatively and qualitatively. In November 2014, a groundtruthing meeting was held in Nanning (capital of Guangxi) with Guangxi CCDC staff from both counties, as well as the provincial headquarters, to discuss initial analyses and results. Feedback was used for model revisions and additional analyses. Model diagnostics and analysis of residuals were also performed. Sensitivity analysis for Model 10 was conducted using: OLS; MLE; MLE with sample weights; a more lenient use-of-soap covariate; a stricter safe water storage covariate; without safe water storage and water source; with TTC outliers; and with a number of other controls. Final modeling and analyses were performed using STATA version 13.1 (Stata Corporation, College Station, TX).
Ethics
This study was approved by the Committee for the Protection of Human Subjects at the
Uni-versity of California Berkeley (protocol ID: 2012-05-4368) and by the CCDC’s Institutional
Review Board (IRB) in Beijing. All participants provided informed written consent (note:
Berkeley’s IRB approved the use of unsigned/verbal consent, but the CCDC’s IRB required
signed consent). This manuscript was prepared using the STROBE guidelines [29].
Results
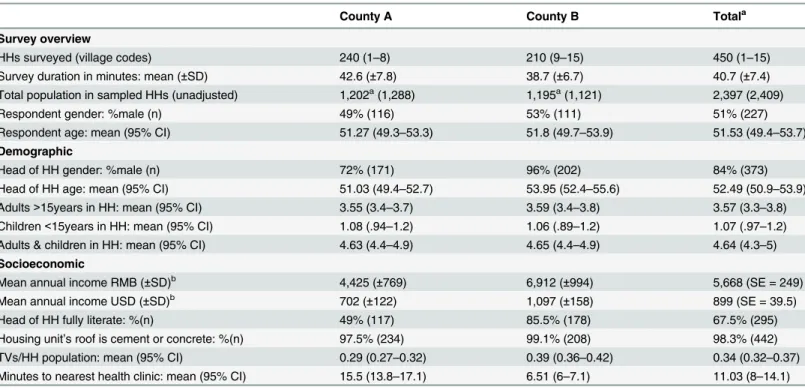
Demographic characteristics in our sample were similar across the two counties (Table 1) and
closely in line with village-level government data, indicating a representative sample (S3 Table).
Our prevalence estimates for the population were that 47.5% (95% CI = 37.7–57.2) of
house-holds boiled locally sourced water for drinking, 34.4% (95% CI = 22.2–46.5) purchased bottled
Table 1. Survey, demographic, and socioeconomic characteristics by County.
County A County B Totala
Survey overview
HHs surveyed (village codes) 240 (1–8) 210 (9–15) 450 (1–15)
Survey duration in minutes: mean (±SD) 42.6 (±7.8) 38.7 (±6.7) 40.7 (±7.4)
Total population in sampled HHs (unadjusted) 1,202a(1,288) 1,195a(1,121) 2,397 (2,409)
Respondent gender: %male (n) 49% (116) 53% (111) 51% (227)
Respondent age: mean (95% CI) 51.27 (49.3–53.3) 51.8 (49.7–53.9) 51.53 (49.4–53.7) Demographic
Head of HH gender: %male (n) 72% (171) 96% (202) 84% (373)
Head of HH age: mean (95% CI) 51.03 (49.4–52.7) 53.95 (52.4–55.6) 52.49 (50.9–53.9) Adults>15years in HH: mean (95% CI) 3.55 (3.4–3.7) 3.59 (3.4–3.8) 3.57 (3.3–3.8)
Children<15years in HH: mean (95% CI) 1.08 (.94–1.2) 1.06 (.89–1.2) 1.07 (.97–1.2)
Adults & children in HH: mean (95% CI) 4.63 (4.4–4.9) 4.65 (4.4–4.9) 4.64 (4.3–5) Socioeconomic
Mean annual income RMB (±SD)b 4,425 (±769) 6,912 (±994) 5,668 (SE = 249)
Mean annual income USD (±SD)b 702 (±122) 1,097 (±158) 899 (SE = 39.5)
Head of HH fully literate: %(n) 49% (117) 85.5% (178) 67.5% (295)
Housing unit’s roof is cement or concrete: %(n) 97.5% (234) 99.1% (208) 98.3% (442) TVs/HH population: mean (95% CI) 0.29 (0.27–0.32) 0.39 (0.36–0.42) 0.34 (0.32–0.37) Minutes to nearest health clinic: mean (95% CI) 15.5 (13.8–17.1) 6.51 (6–7.1) 11.03 (8–14.1)
HH = household | SD = standard deviation | CI = confidence interval | SE = standard error
aTotal means, standard errors, and con
fidence intervals were adjusted with sample weights
bBased on government data, using the mean 2012 exchange rate: USD 1 = RMB 6.3
water, and the remaining 18.2% (95% CI = 11.3–25.0) did not treat their drinking water.
Disag-gregating boiling methods, we found that 20.3% (95% CI = 11.5–29.1) of all households used
pots, and 27.1% (95% CI = 17.2–37.0) used electric kettles (<5% of whom used small metal
ket-tles placed on electric burners) (Table 2andS4 Table). While bottled water is not usually
consid-ered a HWT method, we treated it as such for these analyses, in part because at least half of the households purchasing bottled water in our sample regularly heated or boiled it before drinking (seeS2 Text). After including bottled water users who likely heated or boiled their bottled water,
our overall prevalence estimate for boiling was 63.13% (95% CI = 57.28–68.97); the CCDC’s
68% boiling prevalence estimate for Guangxi falls within this confidence interval.
Nearly all households (97.5%) reported having a piped source of water in their home or courtyard (mostly from utilities, wells, rainwater harvesting cisterns, or boreholes) and 99.8% of households had access to electricity. Reported two-week diarrhea prevalence (3.8%, n = 17) was similar to that in other middle-income countries.
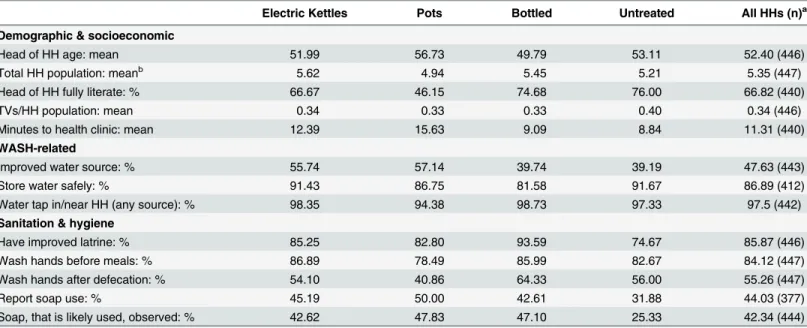
Courtesy bias can be a problem in self-reported WASH surveys. For example, in a study focused on hygiene and social desirability, 97% reported using soap, though it was observed in
only 68% of households [30]. In our study, rates of reported and observed soap use were very
similar overall (Table 2) and in most villages (Fig 2); this suggests that courtesy bias was not a
significant problem. Similarly, winter self-report boiling duration and frequency data were cor-roborated by the SUMS data.
For the 15 villages sampled, the mean pH of the primary drinking water source was 7.78
(SD = 0.20), turbidity was<1 for all villages, and mean total hardness was 177.6 mg/L
(SD = 48.57). Aside from SO4 concentrations in two villages, none of the physicochemical
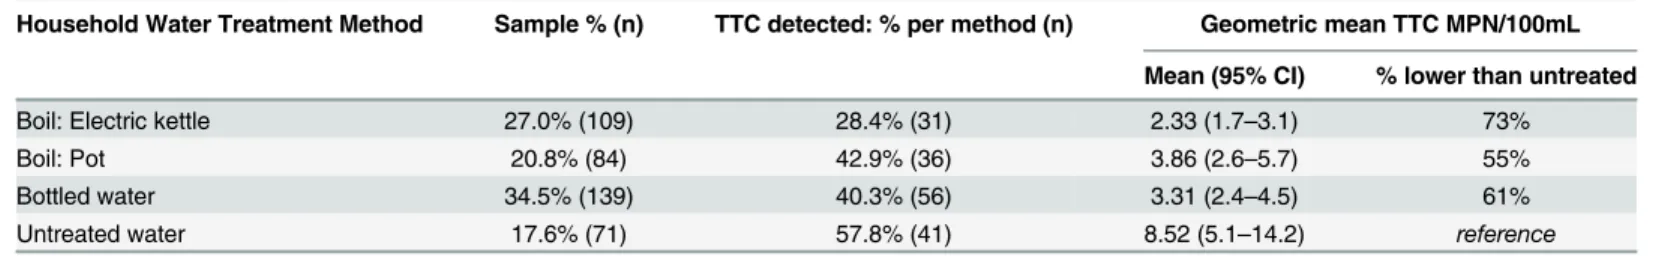
vari-ables exceeded CCDC standards (seeS3 Textfor additional results). TTC were detected in
38.7% of households. Across HWT methods, TTC concentrations and the proportion of house-holds with TTC detected were both lowest for househouse-holds boiling with electric kettles (see
Table 2. Socioeconomic and WASH characteristics by HWT method.
Electric Kettles Pots Bottled Untreated All HHs (n)a
Demographic & socioeconomic
Head of HH age: mean 51.99 56.73 49.79 53.11 52.40 (446)
Total HH population: meanb 5.62 4.94 5.45 5.21 5.35 (447)
Head of HH fully literate: % 66.67 46.15 74.68 76.00 66.82 (440)
TVs/HH population: mean 0.34 0.33 0.33 0.40 0.34 (446)
Minutes to health clinic: mean 12.39 15.63 9.09 8.84 11.31 (440)
WASH-related
Improved water source: % 55.74 57.14 39.74 39.19 47.63 (443)
Store water safely: % 91.43 86.75 81.58 91.67 86.89 (412)
Water tap in/near HH (any source): % 98.35 94.38 98.73 97.33 97.5 (442)
Sanitation & hygiene
Have improved latrine: % 85.25 82.80 93.59 74.67 85.87 (446)
Wash hands before meals: % 86.89 78.49 85.99 82.67 84.12 (447)
Wash hands after defecation: % 54.10 40.86 64.33 56.00 55.26 (447)
Report soap use: % 45.19 50.00 42.61 31.88 44.03 (377)
Soap, that is likely used, observed: % 42.62 47.83 47.10 25.33 42.34 (444)
HH = household
aTotal n excludes missing data (with no missing data n = 450) | Totals were not adjusted with sample weights bTotal household population includes adults living/working outside the home>9 months/year
Table 3andFig 3). TC were detected in 93.7% of households and TC median values were
low-est in the electric kettle group (seeS12 Tablefor more details).
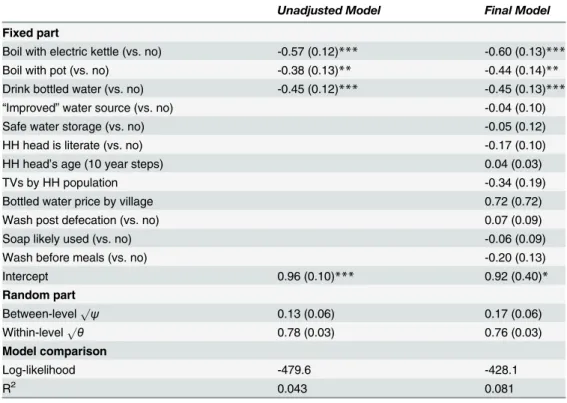
Table 4displays Log10TTC coefficients for HWT methods adjusted only for clustering (i.e.,
Model Two) compared to the final, fully adjusted, model (i.e., Model Ten; seeEq 2). After
con-trolling for the influence of likely confounders and intermediates, as well as the impact of clus-tering and other covariates often associated with microbial water quality, boiling with electric
kettles was associated with the largest Log10TTC reduction (-0.60,p<0.001), followed by
bot-tled water (-0.45,p<0.001) and boiling with pots (-0.44,p<0.01).
Model diagnostics and analysis of level-1 (household) and level-2 (village) residuals did not reveal any outlier observations. HWT effect sizes and significance levels were stable across
sen-sitivity analysis models, and TTC outlier inclusion consistently yielded larger effects (seeS5–S8
Tables). After using MLM to control for potential confounders and intermediaries (which were not significantly associated with Log10TTC), as well as the impact of clustering and other covariates, we found that boiling with electric kettles was consistently associated with the larg-est Log10TTC reductions. Geometric mean TTC was 73% lower for households boiling with
electric kettles as compared to households drinking untreated water (Table 3).
Fig 2. Reported and observed soap use: Proportions by village.
doi:10.1371/journal.pone.0138451.g002
Table 3. Thermotolerant Coliform concentrations by HWT method.
Household Water Treatment Method Sample % (n) TTC detected: % per method (n) Geometric mean TTC MPN/100mL
Mean (95% CI) % lower than untreated
Boil: Electric kettle 27.0% (109) 28.4% (31) 2.33 (1.7–3.1) 73%
Boil: Pot 20.8% (84) 42.9% (36) 3.86 (2.6–5.7) 55%
Bottled water 34.5% (139) 40.3% (56) 3.31 (2.4–4.5) 61%
Untreated water 17.6% (71) 57.8% (41) 8.52 (5.1–14.2) reference
HH = household | MPN = Most Probable Number | CI = confidence interval; Data exclude 38 TTC outliers and proportions were not adjusted with sample weights. Outlier inclusion yielded lower geometric mean TTC estimates for all three HWT methods and a higher estimate for the untreated group. Geometric means were calculated using all observations.
Compared to households drinking untreated water, electric kettle users had the lowest risk
of having TTC detected in their drinking water (RR = 0.49, 0.34–0.70,p<0.001), followed by
bottled water users and households boiling with pots (Table 5). Although our study was not
powered to detect differences in diarrhea, the pattern of risk ratios for reported diarrhea by
HWT method was consistent with the TTC risk ratios (Table 5). TTC concentration risk
classi-fications are shown across HWT methods inFig 4.
Discussion
Our findings in rural China are in line with the post-boiling TTC reductions observed in rural
Guatemala, India, Peru, and Vietnam, as well as post-boilingEscherichia Colireductions
observed in Cambodia [31–35]. Other than HWT, no other covariates were significantly
asso-ciated with Log10TTC (except for adult literacy in a few models:S2 Table). That factors such as
safe water storage and latrine type were not significantly associated with water quality is likely due to the particularities of rural China, the cultural preference for boiled water, excellent access to electricity and water, and decent levels of sanitation and hygiene.
As would be expected, then, Log10TTC means derived from Model 10 were similar to
unad-justed means (e.g., 0.35 (0.17–0.53) and 0.37 (0.24–0.49) MPN/100mL, respectively, for electric
kettles). While there was no significant association between improved and unimproved drink-ing water sources and TTC concentrations overall, households in the untreated group usdrink-ing
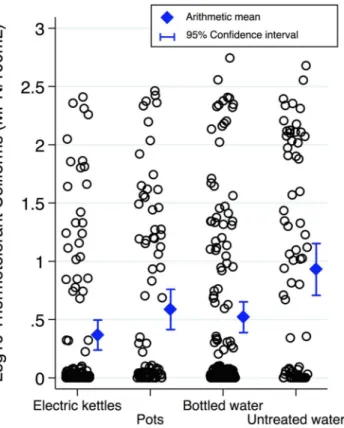
Fig 3. Log10Thermotolerant Coliform data by HWT method.A jitter of five was used to better display
observation frequencies. Data exclude 38 TTC outlier cases. Drinking water samples from households using electric kettles were associated with the lowest mean Log10TTC concentrations. Scheffe’s
multiple-comparison test showed mean Log10TTC for kettles and bottled water were both statistically significantly
different than untreated (p<0.001 and p<0.01, respectively); Bonferroni test showed kettles, pots, and bottled
water were significantly different than untreated (p<0.001, p<0.05, and p<0.01, respectively).
water from improved sources had significantly lower mean Log10TTC than households using unimproved sources (0.57 vs. 1.17 MPN/100mL; two-sided t-test with unequal variances,
p<0.01). This finding further supports the observed overall effectiveness of HWT for microbial
contaminant reduction in our study population. That said, of the HWT users, 25% reported
“sometimes”or“often”drinking untreated water, highlighting the phenomenon of inconsistent
HWT use [36,37].
Compared to electric kettle users, households drinking untreated water were twice as likely
to have TTC detected (RR = 2.03, 1.42–2.90,p<0.001) and pot users were 1.5 times as likely
(RR = 1.51, 1.02–2.22,p<0.05) (S9 Table). Respondents drinking untreated water were also
more likely to report diarrhea than electric kettle users, though the association was not
signifi-cant (RR = 1.63, 0.42–6.31,p= 0.478) (S10 Table).
There could be several reasons for the significantly lower levels of TTC in drinking water from households boiling with electric kettles. Though many pathogens are inactivated at
tem-peratures below boiling [38], electric kettles bring water to a rolling boil for full inactivation. In
addition, the kettle’s built-in lid must be closed for operation, reducing the potential for
post-boiling secondary contamination [6]. Households using electric kettles also reported boiling
Table 4. Log10Thermotolerant Coliform coefficients from select models.
Unadjusted Model Final Model
Fixed part
Boil with electric kettle (vs. no) -0.57 (0.12)*** -0.60 (0.13)***
Boil with pot (vs. no) -0.38 (0.13)** -0.44 (0.14)**
Drink bottled water (vs. no) -0.45 (0.12)*** -0.45 (0.13)***
“Improved”water source (vs. no) -0.04 (0.10)
Safe water storage (vs. no) -0.05 (0.12)
HH head is literate (vs. no) -0.17 (0.10)
HH head’s age (10 year steps) 0.04 (0.03)
TVs by HH population -0.34 (0.19)
Bottled water price by village 0.72 (0.72)
Wash post defecation (vs. no) 0.07 (0.09)
Soap likely used (vs. no) -0.06 (0.09)
Wash before meals (vs. no) -0.20 (0.13)
Intercept 0.96 (0.10)*** 0.92 (0.40)*
Random part
Between-levelpψ 0.13 (0.06) 0.17 (0.06)
Within-levelpθ 0.78 (0.03) 0.76 (0.03)
Model comparison
Log-likelihood -479.6 -428.1
R2 0.043 0.081
HH = household
*p<0.05; **p<0.01; ***p<0.001
Values are Log10TTCβcoefficients with standard errors (SE) in parentheses.pψandpθare the
between-cluster and within-between-cluster standard deviation, with SE in parentheses. As modelfit improves, variance and log-likelihood decrease. R2indicates the linearity between covariates and Log
10TTC, not an overall
goodness offit. The large bottled water price SE is because village means were used for all households in a village.“Improved”water source classifications were based on JMP definitions.
more frequently (2.48x/day, n = 93, 95% CI = 2.10–2.87) than households boiling with pots
(1.39x/day, n = 115, 95% CI = 1.20–1.57) (two-sided t-test with unequal variances,p<0.001)
suggesting that households using electric kettles may boil smaller quantities more frequently. Among households using electric kettles, shorter boiling durations were significantly associated
with lower TTC concentrations (p<0.05 with a Kruskal Wallis test, and p<0.01 for a trend test
of odds ratios). This was the case even after controlling for household size and other covariates,
whereas no such relationship was observed for households boiling with pots (seeS4 Text).
Luby et al. [39] also found that shorter boiling durations were associated with lower coliform
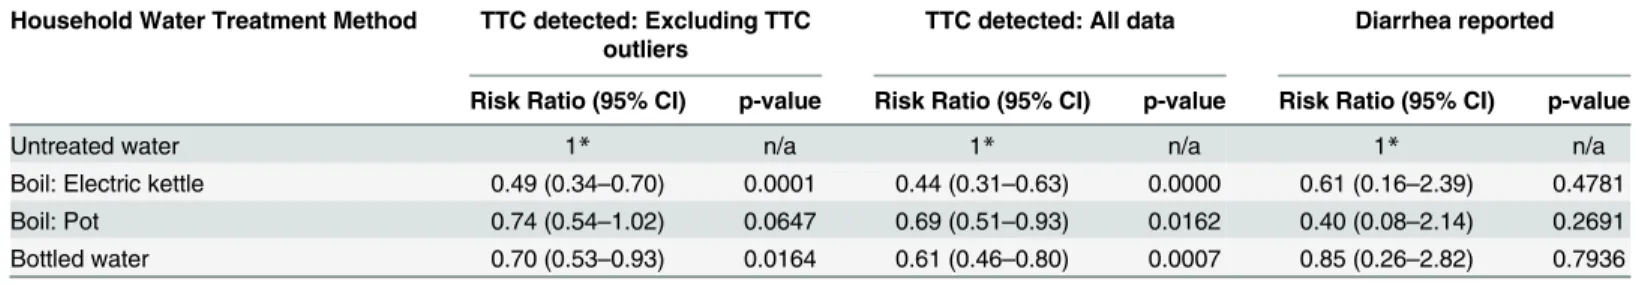
Table 5. Risk ratios for TTC and diarrhea by HWT method.
Household Water Treatment Method TTC detected: Excluding TTC outliers
TTC detected: All data Diarrhea reported
Risk Ratio (95% CI) p-value Risk Ratio (95% CI) p-value Risk Ratio (95% CI) p-value
Untreated water 1* n/a 1* n/a 1* n/a
Boil: Electric kettle 0.49 (0.34–0.70) 0.0001 0.44 (0.31–0.63) 0.0000 0.61 (0.16–2.39) 0.4781
Boil: Pot 0.74 (0.54–1.02) 0.0647 0.69 (0.51–0.93) 0.0162 0.40 (0.08–2.14) 0.2691
Bottled water 0.70 (0.53–0.93) 0.0164 0.61 (0.46–0.80) 0.0007 0.85 (0.26–2.82) 0.7936
*Reference for unadjusted risk ratios (No TTC detected = 0 | No diarrhea reported = 0)
doi:10.1371/journal.pone.0138451.t005
Fig 4. Basic risk classification of Thermotolerant Coliforms by HWT method.Each stacked bar displays TTC concentrations divided into categories based on likely health risk, and the percentage of households in each risk category by HWT method. The WHO’s standard for the microbiological safety of water using TTC as an indicator of fecal contamination is no detectable TTC/100mL [22]. The CCDC’s risk classification also considers TTC samples that are below the detection limit as microbiologically safe [21]. At counts of 1–9 MPN/100mL, if sanitary conditions are decent, drinking water is usually low risk for most people, except young children, the elderly, and the immunocompromised. Data exclude 38 TTC outlier cases (outlier inclusion yielded slightly larger proportions of households in the high risk category).
counts. Taken together, these data suggest that, compared to pots, electric kettles provide con-sistent and full pathogen inactivation and limited opportunity for secondary contamination.
Our findings also highlight the presence of microbial contamination in bottled water. We found no association between price and the microbial quality of bottled water. Our survey data and qualitative feedback from the 2014 groundtruthing meeting suggest that a significant pro-portion of rural households purchase bottled water for its perceived convenience, rather than its perceived safety. In the population we sampled, an electric kettle of mid-range quality would cost the equivalent of seven 19L bottles of water, or 1% of mean annual reported income (RMB 55, USD 8.8). If chemical contaminant concentrations were the same or higher in bottled water as compared to local water sources, then a one-time purchase of an electric kettle would provide safer drinking water and significant long-term savings compared to bottled water.
Our study had some limitations. In deference to CCDC officials and their Institutional Review Board, some of the MPAT survey questions (and the entire MPAT Village Survey) were censored and we did not test for all industrial and agricultural contaminant indicators of interest. Due to logistical constraints related to the rainy season we replaced three of the origi-nally (and randomly) selected villages in County A using socio-demographic matching which
may have introduced some selection bias (S11 Table). In some cases water samples arrived at
county laboratories after the proscribed six hours, which may partially explain the 38 coliform outlier cases. However, the inclusion of TTC outliers in our analyses resulted in larger risk ratio
estimates (except for bottled water, seeS9 Table) and larger Log10TTC reduction estimates in
our models (seeS8 Table). In future research, we plan to collect more data in order to more
precisely disaggregate bottled water users based on their bottled water heating and boiling behaviors. Finally, with regard to HAP from boiling, cooking, and heating, it remains unclear whether removing HAP from boiling alone would result in improved health outcomes. This, too, is something we wish to investigate in future research.
Conclusions
As far as we are aware, this is the first HWT-focused study in China. Our findings indicate that promoting electric kettles, and/or providing free or subsidized kettles to low-income house-holds, could rapidly expand reliable access to microbiologically safe drinking water in rural
China. Considering that new HWT methods face numerous adoption barriers [40–42],
pro-moting an easier, cheaper, and faster way to practice a widely used existing HWT method
could result in high uptake and sustained use. Given the scale of China’s rural population and
the high baseline rate of boiling with pots and solid fuels, resulting reductions of HAP exposure and black carbon emissions could be substantial. Looking beyond China, our conclusions are pertinent to other low- and middle-income countries that are seeking safe water access through viable and scalable HWT approaches.
Supporting Information
S1 Text. Limited drinking water data for China.
(DOCX)
S2 Text. Intracluster Correlation Coefficient calculation.
(DOCX)
S3 Text. Protocols, equipment, and physicochemical results summary for water sample analyses.
S4 Text. Details of boiling duration and TTC analyses.
(DOCX)
S1 Table. Log10TTC coefficients for Models Null-6.
(DOCX)
S2 Table. Log10TTC coefficients for Models 7–10.
(DOCX)
S3 Table. Sample and government data comparisons.
(DOCX)
S4 Table. Primary HWT method proportions: Sample and population estimates.
(DOCX)
S5 Table. Sensitivity analysis: HWT coefficients part I.
(DOCX)
S6 Table. Sensitivity analysis: HWT coefficients part II.
(DOCX)
S7 Table. Sensitivity analysis: HWT coefficients part III.
(DOCX)
S8 Table. Sensitivity analysis: Null Model and Model 10 with TTC outliers included.
(DOCX)
S9 Table. Risk ratios for TTC by HWT method: Electric kettles as reference (and outliers).
(DOCX)
S10 Table. Risk ratios for diarrhea by HWT method: Electric kettles as reference.
(DOCX)
S11 Table. Comparison of County A replacement and randomly selected villages.
(DOCX)
S12 Table. Total Coliform summary statistics by HWT method.
(DOCX)
Acknowledgments
We thank the Guangxi CCDC staff, Zhenbo Yang at UNICEF-China, and Benjamin Arnold, Jill Baumgartner, Zachary Burt, the ERG Water Lab, Perman Gochyyev, Daniel Kammen, Kara Nelson, Thomas Rath, Vincent Resh, Kirk Smith, and Anna Zimmermann.
Author Contributions
Conceived and designed the experiments: AC JC IR YT JR. Performed the experiments: AC QL YT GZ. Analyzed the data: AC JC. Contributed reagents/materials/analysis tools: GYT GZ AC. Wrote the paper: AC IR. Provided feedback on initial analyses and contributed to the final manuscript: AC YT QL GZ JR JC IR.
References
2. Onda K, LoBuglio J, Bartram J. Global access to safe water: Accounting for water quality and the result-ing impact on MDG progress. International Journal of Environmental Research and Public Health. 2012; 9(3):880–94. PMC3367284. doi:10.3390/ijerph9030880PMID:22690170
3. Rosa G, Clasen T. Estimating the scope of household water treatment in low- and medium-income countries. The American Journal of Tropical Medicine and Hygiene. 2010; 82(2):289–300. doi:10. 4269/ajtmh.2010.09-0382PMID:20134007
4. Bonjour S, Adair-Rohani H, Wolf J, Bruce NG, Mehta S, Prüss-Ustün A, et al. Solid fuel use for house-hold cooking: Country and regional estimates for 1980–2010. Environmental Health Perspectives. 2013; 121(7):784–90. PMC3701999. doi:10.1289/ehp.1205987PMID:23674502
5. Ramanathan V, Carmichael G. Global and regional climate changes due to black carbon. Nature Geosci. 2008; 1(4):221–7.
6. Wright J, Gundry S, Conroy R. Household drinking water in developing countries: A systematic review of microbiological contamination between source and point-of-use. Tropical Medicine & International Health. 2004; 9(1):106–17.
7. WHO/UNICEF. Progress on drinking water and sanitation: 2014 update. Geneva, Switzerland: World Health Organization, 2014.
8. Tao Y, editor中国农村饮水健康[Drinking water and health in rural China].中国水利学会2008学术年会
暨八届五次理事会[Chinese Hydraulic Engineering Society: 2008 Annual Academic Conference (Fifth Session of the Eighth Council)]; 2008;海口[Haikou]:中国水利学会[Chinese Hydraulic Engineering Society].
9. CFDA.国家食品药品监督管理总局2014年第一阶段瓶(桶)装饮用水专项监督抽检结果及整治情况通报
[China Food and Drug Administration 2014 First Phase Bottled Water Special Monitoring and Inspec-tion Results and RegulaInspec-tion Report]. Beijing:国家食品药品监督管理总局[China Food and Drug Admin-istration], 2014.
10. Tao Y.中国农村饮用水与环境卫生现状调查[China Rural Drinking Water and Environmental Health Survey].环境与健康杂志[Chinese Journal of Environmental Health]. 2009; 26(1):1–2.
11. MoEP.中国人群环境暴露行为模式研究报告(成人卷) [Report of Environment Exposure Related Activ-ity Patterns Research of Chinese Population (Adult pop.)]. Beijing:中华人民共和国环境保护部 [Peo-ple's Republic of China Ministry of Environmental Protection], 2013.
12. Zhang J, Smith KR. Household air pollution from coal and biomass fuels in China: Measurements, health impacts, and interventions. Environmental Health Perspectives. 2007; 115(6):848–55. PMID: 17589590
13. Jin Y, Ma X, Chen X, Cheng Y, Baris E, Ezzati M. Exposure to indoor air pollution from household energy use in rural China: The interactions of technology, behavior, and knowledge in health risk man-agement. Social Science & Medicine. 2006; 62(12):3161–76.
14. Baumgartner J, Schauer J, Ezzati M, Lu L, Cheng C, Patz JA, et al. Indoor air pollution and blood pres-sure in adult women living in rural China. Environmental Health Perspectives. 2011; 119(10):1390–5. doi:10.1289/ehp.1003371PMID:21724522
15. IFAD. The Multidimensional Poverty Assessment Tool: User's Guide. Rome: The International Fund for Agricultural Development; 2014.
16. Cohen A. The Multidimensional Poverty Assessment Tool: A new framework for measuring rural pov-erty. Development in Practice. 2010; 20(7):887–97.
17. Cohen A, Saisana M. Quantifying the qualitative: Eliciting expert input to develop the Multidimensional Poverty Assessment Tool. Journal of Development Studies. 2014; 1(50):35–50.
18. Mosler H-J. A systematic approach to behavior change interventions for the water and sanitation sector in developing countries: A conceptual model, a review, and a guideline. International Journal of Envi-ronmental Health Research. 2012; 22(5):431–49. doi:10.1080/09603123.2011.650156PMID: 22292899
19. Huber A, Bhend S, Mosler H-J. Determinants of exclusive consumption of fluoride-free water: A cross-sectional household study in rural Ethiopia. Journal of Public Health. 2011:1–10.
20. Kostyla C, Bain R, Cronk R, Bartram J. Seasonal variation of fecal contamination in drinking water sources in developing countries: A systematic review. Science of The Total Environment. 2015; 514 (0):333–43.
21. MoH.生活饮用水标准检验方法:总则[Standard examination methods for drinking water: General prin-ciples]. Beijing:中华人民共和国卫生部[People's Republic of China, Ministry of Health], 2006 Docu-ment No.: GB/T 5750.1–2006.
23. Ruiz-Mercado I, Canuz E, Smith KR. Temperature dataloggers as stove use monitors (SUMs): Field methods and signal analysis. Biomass and Bioenergy. 2012; 47:459–68. PMID:25225456 24. Westreich D, Greenland S. The Table 2 fallacy: Presenting and interpreting confounder and modifier
coefficients. American Journal of Epidemiology. 2013; 177(4):292–8. doi:10.1093/aje/kws412PMID: 23371353
25. Petersen ML, Sinisi SE, van der Laan MJ. Estimation of direct causal effects. Epidemiology. 2006; 17 (3):276–84. PMID:16617276
26. Genser B, Strina A, Teles CA, Prado MS, Barreto ML. Risk factors for childhood diarrhea incidence: Dynamic analysis of a longitudinal study. Epidemiology. 2006; 17(6):658–67. PMID:17003687 27. Victora CG, Huttly SR, Fuchs SC, Olinto MT. The role of conceptual frameworks in epidemiological
analysis: A hierarchical approach. International Journal of Epidemiology. 1997; 26(1):224–7. PMID: 9126524
28. Rabe-Hesketh S, Skrondal A. Multilevel and longitudinal modeling using Stata: Volume 1: Continuous responses. College Station, TX: Stata Press; 2012.
29. Vandenbroucke JP, von Elm E, Altman DG, Gøtzsche PC, Mulrow CD, Pocock SJ, et al. Strengthening
the reporting of observational studies in Epidemiology (STROBE): Explanation and elaboration. PLoS Med. 2007; 4(10):e297. PMID:17941715
30. Manun'Ebo M, Cousens S, Haggerty P, Kalengaie M, Ashworth A, Kirkwood B. Measuring hygiene practices: a comparison of questionnaires with direct observations in rural Zaïre. Tropical Medicine &
International Health. 1997; 2(11):1015–21.
31. Rosa G, Miller L, Clasen T. Microbiological Effectiveness of Disinfecting Water by Boiling in Rural Gua-temala. The American Journal of Tropical Medicine and Hygiene. 2010; 82(3):473–7. doi:10.4269/ ajtmh.2010.09-0320PMID:20207876
32. Clasen T, McLaughlin C, Nayaar N, Boisson S, Gupta R, Desai D, et al. Microbiological effectiveness and cost of disinfecting water by boiling in semi-urban India. The American Journal of Tropical Medicine and Hygiene. 2008; 79(3):407–13. PMID:18784234
33. Rosa G, Huaylinos ML, Gil A, Lanata C, Clasen T. Assessing the consistency and microbiological effec-tiveness of household water treatment practices by urban and rural populations claiming to treat their water at home: A case study in Peru. PLoS ONE. 2014; 9(12):e114997. doi:10.1371/journal.pone. 0114997PMID:25522371
34. Clasen T, Thao DH, Boisson S, Shipin O. Microbiological effectiveness and cost of boiling to disinfect drinking water in rural Vietnam. Environmental Science & Technology. 2008; 42(12):4255–60. 35. Brown J, Sobsey MD. Boiling as household water treatment in Cambodia: A longitudinal study of boiling
practice and microbiological effectiveness. The American Journal of Tropical Medicine and Hygiene. 2012; 87(3):394–8. doi:10.4269/ajtmh.2012.11-0715PMID:22826487
36. Clasen T. Household water treatment and safe storage to prevent diarrheal disease in developing countries. Curr Envir Health Rpt. 2015:1–6.
37. Enger KS, Nelson KL, Rose JB, Eisenberg JNS. The joint effects of efficacy and compliance: A study of household water treatment effectiveness against childhood diarrhea. Water Research. 2013; 47 (3):1181–90. doi:10.1016/j.watres.2012.11.034PMID:23290123
38. Spinks AT, Dunstan RH, Harrison T, Coombes P, Kuczera G. Thermal inactivation of water-borne path-ogenic and indicator bacteria at sub-boiling temperatures. Water Research. 2006; 40(6):1326–32. PMID:16524613
39. Luby SE, Syed AH, Atiullah N, Faizan MK, Fisher-Hoch S. Limited effectiveness of home drinking water purification efforts in Karachi, Pakistan. International Journal of Infectious Diseases. 2000; 4(1):3–7. PMID:10689207
40. Figueroa ME, Kincaid DL. Social, cultural and behavioral correlates of household water treatment and storage. Baltimore: Johns Hopkins Bloomberg School of Public Health and USAID, 2010 Contract No.: Center Publication HCI 2010–1.
41. Waddington H, Snilstveit B, White H, Fewtrell L. Water, sanitation and hygiene interventions to combat childhood diarrhoea in developing countries. Washington & London: The International Initiative for Impact Evaluation (3ie), 2009.