American Journal of Animal and Veterinary Sciences 2 (4): 72-78, 2007 ISSN 1557-4555
© 2007 Science Publications
The Determination of Buffering Capacity of Some Ruminant’s Feedstuffs and their
Cumulative Effects on TMR Ration
A. Moharrery
Department of Animal Science, Agricultural College,
Shahrekord University, Shahrekord, P.O. Box 115, IRAN
Abstract: Two experiments have been conducted in order to investigate the buffering capacity of some ruminant’s feedstuffs and their additivity to calculate ration buffering capacity as a tools for feed formulation. The first experiment was performed with different types (65 samples) of feedstuffs to determine the Buffering Capacity (BC) and Buffer Value Index (BVI). For investigation of cumulative effects of buffering capacity or buffer value index, 6 Total Mixed Rations (TMR) for dairy cow and other six TMR for sheep were formulated using the feedstuffs with known BC or BVI. The calculated and analyzed values were compared using paired t-test. In the second experiment rumen fluid pH was measured using 5 simple rations on 5 adult sheep and correlation was calculated between rumen fluid pH and fiber or ash content of the diets. The analyzed BC and BVI for all the TMRs appeared to be lower than the values calculated from these variables, for individual feedstuffs (p<0.05). The analyzed BVI was also two times higher than the calculated BVI for each diet (p<0.05). In spite of this, the correlation (0.88) between calculated and analyzed values was strong and positive (p = 0.021) for BC and for BVI (0.64) (p and 0.172), respectively. No significant correlation was detected between BC or BVI and non-fiber carbohydrate (NFC) or fiber content of diets (p>0.05). No significant (p>0.05) correlation has been found between ruminal fluid pH and dietary components.
Key words: Buffering capacity, buffering value index, ruminant, feedstuffs
INTRODUCTION
Buffers in ruminant rations are compounds that neutralize excess acid within the animal’s digestive system. The ruminant animal has a complex acid-base regulation system that differs from other animal species. The rumen pH has been directly related to rumen VFA concentration [7]. The prediction of ruminal pH has been a major concern of ruminant nutritionists for many years and HCO3−
is thought to be an important buffer of in the rumen pH [2] and is most used in most in vitro media for fermentation studies [4]. Buffering capacity (BC) refer to the number of moles of H+ that must be added to 1 L of solution to decrease the pH by 1 unit [11]. This value depends on the buffer system and on the pH. Weak acids and bases provide better buffering than strong acids and bases because of the establishment of equilibrium between the acid and the conjugate base.
In this regard, Buffer Value Index (BVI) is related directly to BC but inversely to H+ (acidity). Jasaitis et al. [5] evaluated the pH and BC of different feedstuffs. Feedstuffs influence the ruminal acid-base status through their pH, BC and stimulation of salivation [8]. Tucker et al. [12] reported that BVI could
be used to evaluate the pH and BC of either the diet or the ruminal fluid. If the total dietary BVI predict the ruminal fluid status, this index could be utilized as tools to predict when supplemental dietary buffers would be beneficial.
The objective of this study was firstly to find BC and BVI of some ruminant feedstuffs and evaluate the relationships between calculated and analyzed dietary BC and BVI of mixed rations and secondly, finding any relation among the total dietary BVI and ruminal fluid pH.
MATERIALS AND METHODS
matter dispensed into a 100-ml beaker and mixed with 30 mL of distilled, deionized water. The initial pH of feed was recorded after allowing 2 min for equilibrium. Buffering capacity was determined by titrating the 30-ml solution under continuous stirring from its initial pH to pH of 5 with 1 N HCl and by titrating a similar prepared solution of feedstuff from its initial pH to pH of 7 with 1 N NaOH. If the initial pH was higher than 7, only the volume of acid required to reduce the pH from 7 to 5 was recorded. The BC was converted to milliequivalents per liter as follows:
BC = ((milliliter of 1 N HCl)+(milliliter of 1 N NaOH))×103/30. The BVI was calculated according to the formula of Tucker et al. (1992) as follow:
BVI = ((((antilog10 (-STPH))-(antilog10 (-SAPH)))/(antilog10 (-STPH))+(SABC-STBC)/STBC)) ×10)+100, where STPH = a standard pH of 6
SAPH = the feed sample pH
SABC = the feed sample BC (milliequivalents per liter)
STBC = a standard BC of 50 meq L−1
Twelve totals mixed rations (TMR), six for dairy cattle and six others for sheep were formulated using the feedstuffs with known BC and BVI. The BVI and BC calculations for the TMR were determined from individual feedstuffs (assuming additived) and measured for each one of twelve rations separately (Table 1, 2).
Second experiment Five Lory-Bakhtiary male sheep, 12 months old and with live weights from 55 to 58 kg were used in this experiment. The animals were kept in metabolism boxes. Five total mixed rations (Table 7) were given to animals at maintenance level (1M). The animals were fed twice a day at 0700 h and 1800h and had free access to fresh water. Maintenance requirement of feed for each animal was calculated as:
Feed required (g/day) = W0.75×450/1000/ME
Where W is the live weight of the animal, 450, the maintenance ME requirement (kj/kg W0.75) [1] and ME is the ME (kj/kg) content of the diet.
Experimental period was 21 days and in the last day rumen fluid sample was collected after 21 days adaptation period with help of suction stomach tube and taken directly to the laboratory for measurement of pH with a glass electrode. Acid detergent fiber (ADF) and non-fiber carbohydrate (NFC) in the feed was determined by a method of Van Soest et al. [13]. The
Table 1: Composition of totals mixed rations (TMR) formulated for dairy cattle (DM basis)
Ration (%)
---
A B C D E F
Alfalfa hay 17 20 25 13.3 35.06 31.58 Corn silage 30 25 20 26.5 11.69 21.05 Barley grain 3 11 32 20.8 21.62 21.05 Corn grain 15.5 15.5 13.5
Beet pulp 15 1.5 2 11.69 10.53 Wheat bran 2 3 1 19 14.03 10.53 Fish meal 4 0.5 0.2
Cotton seed meal 0.5 20 2 18.5 5.84 5.26 Soybean meal 10.5 1 0.5
Urea 0.2 1.5
Salt 0.7 0.7 0.7 0.4 Limestone 0.5 0.5 0.5 1.1 0.07 Dicalcium phosphate 1.05 0.86 0.85
Sodium bicarbonate 0.25 0.25 0.25 0.4
pH 5.70 5.74 5.84 6.32 5.69 5.38
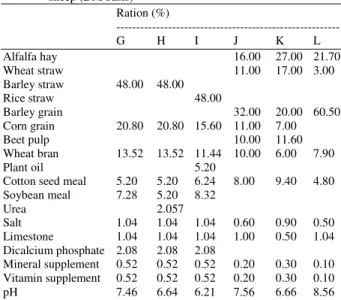
Table 2: Composition of totals mixed rations (TMR) formulated for sheep (DM basis)
Ration (%)
---
G H I J K L
Alfalfa hay 16.00 27.00 21.70 Wheat straw 11.00 17.00 3.00 Barley straw 48.00 48.00
Rice straw 48.00
Barley grain 32.00 20.00 60.50 Corn grain 20.80 20.80 15.60 11.00 7.00
Beet pulp 10.00 11.60
Wheat bran 13.52 13.52 11.44 10.00 6.00 7.90
Plant oil 5.20
Cotton seed meal 5.20 5.20 6.24 8.00 9.40 4.80 Soybean meal 7.28 5.20 8.32
Urea 2.057
Salt 1.04 1.04 1.04 0.60 0.90 0.50 Limestone 1.04 1.04 1.04 1.00 0.50 1.04 Dicalcium phosphate 2.08 2.08 2.08
Mineral supplement 0.52 0.52 0.52 0.20 0.30 0.10 Vitamin supplement 0.52 0.52 0.52 0.20 0.30 0.10 pH 7.46 6.64 6.21 7.56 6.66 8.56
BVI and BC calculations for all rations were determined for whole ration, separately
Correlation was calculated between rumen fluid pH and fiber or NFC content of the diets.
The paired t-test of SAS [10] was used for comparing calculated or analyzed BC and BVI. The correlation among parameters acids was determined and correlation coefficients were tested using a t-test [10].
RESULTS
First experiment
for pomegranate by-product silage). Three feedstuffs had very low pH values around 4 (corn silage, sugar beet pulp silage, pomegranate by-product silage).
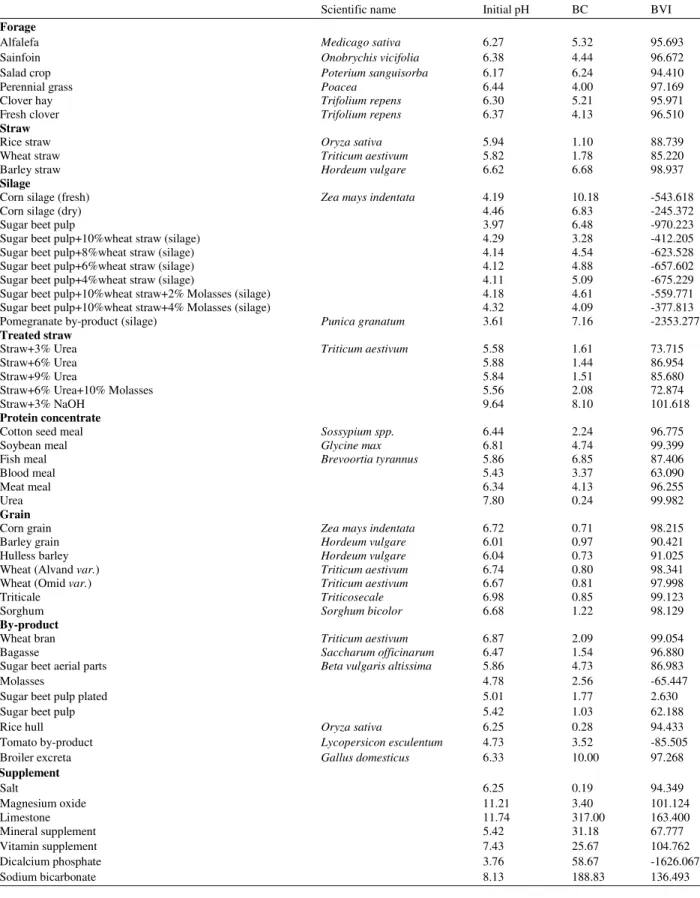
The buffering capacity of barley straw was about 3.7 times higher than for wheat straw, but not much difference could be seen between rice straw and wheat straw (Table 3). The fermented feedstuffs have negative BVI and the most negative BVI was found for pomegranate by-product silage (Table 3). High negative BVI was also found for the dicalcium phosphate (DCP), which is produced by reaction of phosphoric acid on phosphate rock. Generally, BC in forage and protein concentrate are 5.6 and 4.1 times higher than BC in grains, respectively (Table 3).
It can be seen that, two feed samples with similar BVI potentially could have very different pH or different BC, however, to preserve this similarity in BVI, a reduction in one variable (pH or BC) must be offset by an increase in the other. For example the BVI of barley straw is 98.94 and the BVI for wheat grain is more or less same (98.34), but the BC in barley straw is 8.35 times of wheat grain (Table 3). Within protein concentrate BC varied between 0.24 (urea) and 6.85 (fish meal) and for grain the BC varied between 0.71 (corn) and 1.22 (sorghum). Generally, BC was weak negative but not significantly (p = 0.135) correlated with initial pH (r = -0.22, n = 46). In this regard, BVI was positively correlated with initial pH (r = 0.68, p<0.0001).
Reaction of the fermented feedstuffs in relation to the sodium hydroxide addition
The second part of determination of buffering capacity was titration of a 30-ml aliquot from its original pH to pH 7 with 1N NaOH. In relation to the BC of the feedstuffs the pattern of the neutralizing curve was changed according the chemical composition. In this regard, beet pulp silage with or without wheat straw (plus molasses in some case) showed different pattern of neutralizing (Fig. 1). Based of data in Fig. 1 the consumption of 1N NaOH solution was reduced by increasing the wheat straw percentage. On the other hand, addition of molasses to the sugar beet pulp silage prior to the ensiling increased the amount of 1N NaOH solution needed for neutralizing of sample. For each percent of wheat straw addition to the sugar beet pulp silage, 10.625 µL less of 1N NaOH
solution was needed for neutralizing the samples. In this regard, the initial pH value for increasing of each percent of wheat straw was increased by 0.045.
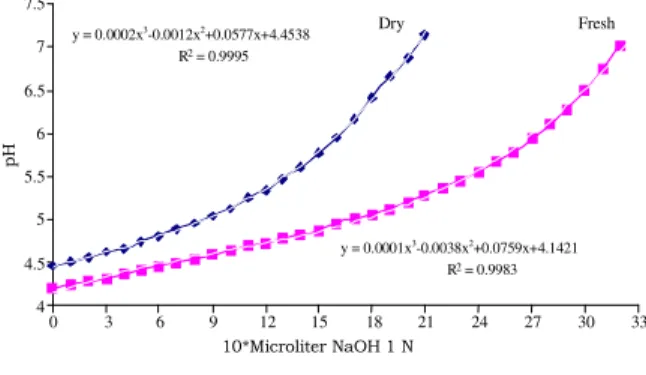
Additionally, the Volatile Fatty Acids (VFA), which were produced during ensiling of corn affects the consumption of 1N NaOH solution for neutralizing
samples. Figure 2 shows different alkaline solution consumption for fresh and oven dry corn silages. The fresh corn silage needed more 1N NaOH solution to neutralize to level of 7 pH. Part of this was related to the presence of VFA in the fresh corn silage compared to dry corn silage. Using regression equation for both curves in the Fig. 2, it is possible to calculate amount of 1N NaOH used mainly to neutralize the VFA content in the fresh corn silage. In these samples, by subtracting dry equation from fresh equation and solving reminder for x the value of 138.1 is found. This value means that for neutralizing the VFA content in each gram of fresh corn silage needed 276.2 µL.
Figure 3 shows the pH response to 1N NaOH titration for neutralization of two types of silage. The pattern of neutralizing corn silage is curvilinear but, the pattern of neutralizing pomegranate silage (fresh) is linear. The higher consumption of 1N NaOH solution in the pomegranate silage is probably due to higher acid production during ensiling.
3.5 4 4.5 5 5.5 6 6.5 7 7.5 8
0 3 6 9 12 15 18 21
BPS BPS+10%WS BPS+8%WS BPS+6%WS BPS+4%WS BPS+10%WS+4%M BPS+10%WS+2%M
Fig. 1: Titration curve of sugar beet silage (BPS) and mixed BPS with Wheat Straw (WS) and/or molasses (M)
y = 0.0002x3-0.0012x2+0.0577x+4.4538
R2 = 0.9995
y = 0.0001x3-0.0038x2+0.0759x+4.1421
R2 = 0.9983
4 4.5 5 5.5 6 6.5 7 7.5
0 3 6 9 12 15 18 21 24 27 30 33
Fresh Dry
Table 3: Buffering capacity (BC, meq L−1) and buffer value index (BVI) of selected feedstuffs
Scientific name Initial pH BC BVI
Forage
Alfalefa Medicago sativa 6.27 5.32 95.693
Sainfoin Onobrychis vicifolia 6.38 4.44 96.672
Salad crop Poterium sanguisorba 6.17 6.24 94.410
Perennial grass Poacea 6.44 4.00 97.169
Clover hay Trifolium repens 6.30 5.21 95.971
Fresh clover Trifolium repens 6.37 4.13 96.510
Straw
Rice straw Oryza sativa 5.94 1.10 88.739
Wheat straw Triticum aestivum 5.82 1.78 85.220
Barley straw Hordeum vulgare 6.62 6.68 98.937
Silage
Corn silage (fresh) Zea mays indentata 4.19 10.18 -543.618
Corn silage (dry) 4.46 6.83 -245.372
Sugar beet pulp 3.97 6.48 -970.223
Sugar beet pulp+10%wheat straw (silage) 4.29 3.28 -412.205
Sugar beet pulp+8%wheat straw (silage) 4.14 4.54 -623.528
Sugar beet pulp+6%wheat straw (silage) 4.12 4.88 -657.602
Sugar beet pulp+4%wheat straw (silage) 4.11 5.09 -675.229
Sugar beet pulp+10%wheat straw+2% Molasses (silage) 4.18 4.61 -559.771 Sugar beet pulp+10%wheat straw+4% Molasses (silage) 4.32 4.09 -377.813 Pomegranate by-product (silage) Punica granatum 3.61 7.16 -2353.277
Treated straw
Straw+3% Urea Triticum aestivum 5.58 1.61 73.715
Straw+6% Urea 5.88 1.44 86.954
Straw+9% Urea 5.84 1.51 85.680
Straw+6% Urea+10% Molasses 5.56 2.08 72.874
Straw+3% NaOH 9.64 8.10 101.618
Protein concentrate
Cotton seed meal Sossypium spp. 6.44 2.24 96.775
Soybean meal Glycine max 6.81 4.74 99.399
Fish meal Brevoortia tyrannus 5.86 6.85 87.406
Blood meal 5.43 3.37 63.090
Meat meal 6.34 4.13 96.255
Urea 7.80 0.24 99.982
Grain
Corn grain Zea mays indentata 6.72 0.71 98.215
Barley grain Hordeum vulgare 6.01 0.97 90.421
Hulless barley Hordeum vulgare 6.04 0.73 91.025
Wheat (Alvand var.) Triticum aestivum 6.74 0.80 98.341
Wheat (Omid var.) Triticum aestivum 6.67 0.81 97.998
Triticale Triticosecale 6.98 0.85 99.123
Sorghum Sorghum bicolor 6.68 1.22 98.129
By-product
Wheat bran Triticum aestivum 6.87 2.09 99.054
Bagasse Saccharum officinarum 6.47 1.54 96.880
Sugar beet aerial parts Beta vulgaris altissima 5.86 4.73 86.983
Molasses 4.78 2.56 -65.447
Sugar beet pulp plated 5.01 1.77 2.630
Sugar beet pulp 5.42 1.03 62.188
Rice hull Oryza sativa 6.25 0.28 94.433
Tomato by-product Lycopersicon esculentum 4.73 3.52 -85.505
Broiler excreta Gallus domesticus 6.33 10.00 97.268
Supplement
Salt 6.25 0.19 94.349
Magnesium oxide 11.21 3.40 101.124
Limestone 11.74 317.00 163.400
Mineral supplement 5.42 31.18 67.777
Vitamin supplement 7.43 25.67 104.762
Dicalcium phosphate 3.76 58.67 -1626.067
y = 0.0606x+3.518 R2 = 0.9968 y = 0.0001x -0.0038x3 2+0.0759x+4.1421
R2 = 0.9983
3.5 4.5 5.5 6.5 7.5
3 4 5 6 7 8
0 5 10 15 20 25 30 35 40 45 50 55 60
Pomegranate silage Corn silage
Fig. 3: The difference between fresh corn silage and fresh pomegranate pulp silage in reaction to sodium hydroxide
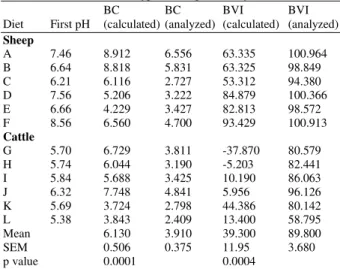
Evaluation of the cumulative effect for BC and BVI: The concept of mixing feeds of known buffering potential to create a diet with predictable BC assumes that the range of feed BC, both within and among feed types, is large enough to allow formulation of diets that vary in BC yet are similar in nutrient content. If this range did not exist, it would not be possible to make substitution of one feed for another. Result of the first experiment showed that analyzed dietary BVI and BC were markedly higher than BVI and BC values calculated from individual dietary components (Table 4). The titration of all 12 TMRs (cattle and sheep rations) indicated that the overall BC of feed mixtures were not similar to the one predicted by summing the weighted BC values for the individual feeds (weighed based on percentage of the feed in the diet). This means that the BVI and BC for individual dietary ingredient did not cumulative effect on TMR. However, the correlation between calculated BC and analyzed BC is high (r = 0.89) and significant (p<0.05, Table 5), but the coefficient of correlation between calculated BVI and analyzed BVI could not showed stronger relationship as seen for BC (Table 5). The regression equation for prediction of BC and BVI is shown in Table 6. For cattle diets around 85% of the variance of analyzed BC was explained by the calculated BC but, only 77% in BC for sheep diets. Nevertheless, low R2 and non significant probability (p>0.05) indicated that this simple model was insufficient to estimate accurately BVI in both types of mixed rations.
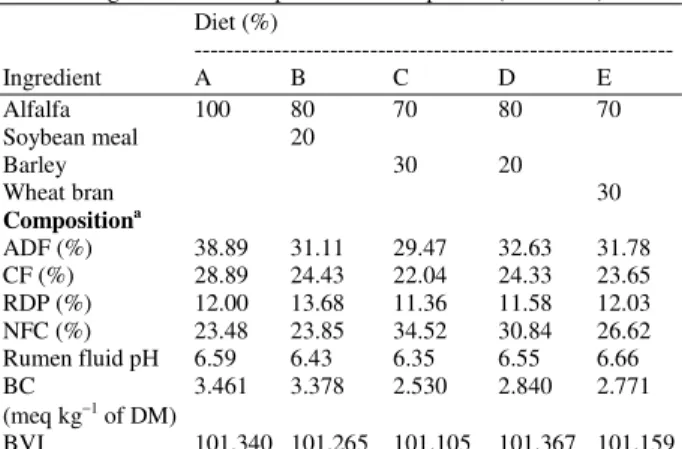
Second experiment: Diet compositions and values for dietary BVI, ADF, CF and RDP which were fed to the five sheep are presented in Table 7. Rumen pH ranged from 6.35 to 6.66 and declined in response to increased percentage of NFC in the rations but was not influenced by RDP%. Dietary treatments affected the rumen pH. Increasing the barley grain up to 20% (diet D v diet A) did not affect rumen pH significantly but, adding 10
percent more barley to the diet (diet C) significantly decreased rumen pH. In this regard, it seems that dietary ADF% and BVI had a better relationship with ruminal fluid pH compared to other components mentioned earlier (Table 8). A high dietary ADF or low NFC concentration increased ruminal fluid pH. However, no significant (p>0.05) correlation has been found between ruminal fluid pH and dietary components (Table 8).
Table 4: Buffering capacity (BC, meq L−1) and buffer value index
(BVI) of different type of sheep and dairy cow diets
BC BC BVI BVI
Diet First pH (calculated) (analyzed) (calculated) (analyzed)
Sheep
A 7.46 8.912 6.556 63.335 100.964 B 6.64 8.818 5.831 63.325 98.849 C 6.21 6.116 2.727 53.312 94.380 D 7.56 5.206 3.222 84.879 100.366 E 6.66 4.229 3.427 82.813 98.572 F 8.56 6.560 4.700 93.429 100.913
Cattle
G 5.70 6.729 3.811 -37.870 80.579 H 5.74 6.044 3.190 -5.203 82.441 I 5.84 5.688 3.425 10.190 86.063 J 6.32 7.748 4.841 5.956 96.126 K 5.69 3.724 2.798 44.386 80.142 L 5.38 3.843 2.409 13.400 58.795 Mean 6.130 3.910 39.300 89.800 SEM 0.506 0.375 11.95 3.680 p value 0.0001 0.0004
Table 5: Coefficient of correlation between calculated and analyzed buffering capacity (BC, meq L−1) and buffer value index
(BVI)
BC (analyzed) BVI (analyzed) References
BC 0.8892a Present study
(calculated) 0.0001b
BVI 0.6385 Present study
(calculated) 0.0254
BC 0.9584 Le Ruyet et al. (1992) (calculated) 0.0416
BVI 0.8160 Le Ruyet et al. (1992) (calculated) 0.1840
a: coefficient of correlation, b: probability level
Table 6: Regression equation for prediction of BC (meq L−1) and BVI
Diets Equation R2 p-value References
Cattle 0.5995 (calculated BC) 0.83 0.0066 Present study Cattle 80.9-0.0490 (calculated BVI) 0.01 0.8397 Present study Sheep 0.6674 (calculated BC) 0.77 0.0209 Present study Sheep 91.6+0.101 (calculated BVI) 0.41 0.1721 Present study Cattle 0.7741 (calculated BC) 0.81 0.0416 Le Ruyet et al.
(1992) Cattle 67.0+0.268 (calculated BVI) 0.67 0.1840 Le Ruyet et al.
(1992) Total 0.639 (calculated BC) 0.79 0.0001 Present study diets
Table 7: Ingredient and composition of sheep diets (DM basis) Diet (%)
---
Ingredient A B C D E
Alfalfa 100 80 70 80 70 Soybean meal 20
Barley 30 20
Wheat bran 30
Compositiona
ADF (%) 38.89 31.11 29.47 32.63 31.78 CF (%) 28.89 24.43 22.04 24.33 23.65 RDP (%) 12.00 13.68 11.36 11.58 12.03 NFC (%) 23.48 23.85 34.52 30.84 26.62 Rumen fluid pH 6.59 6.43 6.35 6.55 6.66 BC 3.461 3.378 2.530 2.840 2.771 (meq kg−1 of DM)
BVI 101.340 101.265 101.105 101.367 101.159
a ADF: acid detergent fiber, CF: crude fiber, RDP: rumen degradable
protein (calculated), NFC: non-fiber carbohydrate, BC: analyzed buffering capacity, BVI: analyzed buffering value index
Table 8: Coefficient of correlation between rumen fluid pH and other parameter related to sheep diets
BC
(meq L−1) BVI RDP% ADF% CF% NFC%
Rumen 0.2040a 0.5510 -0.1060 0.5530 0.4810 -0.4910
fluid pH
P value 0.7420 b 0.3360 0.8650 0.3340 0.4130 0.4010 a: Coefficient of correlation, b: Probability
DISCUSSION
The ruminants have three primary means of buffering either acid ingested or acid produced by rumen microorganisms. These include: 1) buffers naturally occurring in saliva, 2) buffering capacity of ingested feed and 3) added dietary buffers. It is important to consider the need for dietary buffer only as a method of overcoming shortfalls in saliva and natural feed buffering constituents.
Because rumen pH seldom exceeds the range of 5 to 7 in dairy cows fed diets containing 40 to 90% forage, buffering capacities measured within that range would be more appropriate than the ranges of 4 to 9 [5] or 4 to 6 [9]. This is logical in that buffering capacities measured over range of 4 to 9 may not be related at all to buffering capacity in the physiological pH range in the rumen of 5.5 to 7.0.
The ratio between the amounts of sample and distilled water was higher than that used by Jasaitis et al. [5], but of the same magnitude than that of Le Ruyet et al. [8]. Nevertheless, the initial pH values were close to those obtained by Jasaitis et al. [5] on feedstuffs. In agreement with the result of present study, the work of Jasaitis et al. [5] showed that cereal grains had relatively low buffering capacities but hays and protein sources had three to four fold higher total buffering capacities in the pH range of 4 to 9. Dry feeds
near pH 6 such as forages would allow for substantial buffering in high grain diets regardless of their physical effects on salivation.
Fermented feedstuffs had quit low initial pH values as already found by Playne and McDonald, [9] and by Le Ruyet et al. [8] and by Giger-Riverdin et al. [3]. The values obtained (mean value = 4.1) were acidic. These low pHs have to be related to the fact that such a pH is necessary to conserve these feedstuffs. In the present study a cubic model was used to describe the titration curves and the fit was quite good (Fig. 2 and 3). Cubic model seemed better than the exponential one proposed by Giger-Riverdin et al. [3]. This result is in agreement to Wohlt et al. [14] who has reported that the titration curve for acidic feedstuffs is better explained by cubic models.
The mixing with wheat straw before ensiling of sugar beet pulp to increase dry matter content of the silage and reduce run off soluble material due to compression of silage resulted acid formation during ensiling period. This reduction was not linear but a mean value of about 0.045 pH unit for each added percent of wheat straw. On the other hand, the titration curve for pomegranate by-product silage was linear. The reason for this curve type was partly due to the presence of some inorganic acid in this by-product but, needs more research about it. In respect to the measurement of alkaline (1N NaOH) consumption for neutralizing corn silage in a fresh and dry form it is possible to predict the mole of volatile acid, which disappeared during oven drying of corn silage. In addition to measuring alkaline consumption it is possible to subtract dry silage curve from fresh silage curve and solving the reminder for X. In the present study X was 276.2 micro liters 1 N NaOH for each gram of corn silage (dry matter basis). It presented the advantage of allowing the calculation of the volatile acid component and it can be used for practical feeding where the potential acid loads of the feeds in the rumen due to their consumption.
The pretreatment of feedstuffs with urea could not modify their properties since the alkaline buffering capacities were not changed compared to untreated wheat straw. In this regard the NaOH treated wheat straw showed higher BC because of a high initial pH.
before it was mixed with other ingredients, a broader pH range was used to calculate BC and the complete dietary BC was determined immediately after mixing. In agreement with these results, Le Ruyet et al. [8] found similar relationships between calculated and analyzed dietary BVI. However, their samples were frozen for 4 month’s before analysis. The analyses in present study were conducted after the samples were taken.
Variation in experimental procedures and method of collection rumen fluid for pH measurement make it difficult to compare the results of this study with other reports of rumen pH and feed main components. Kaufmann [6], using lactating dairy cows, predicted average rumen pH as a linear function of dietary crude fiber where a 1 percentage unit decline in dietary crude fiber resulted in a 0.066 pH unit decline in rumen pH (R2 = 0.81, p < 0.01). In the present study 1 percentage unit decline in dietary CP, ADF, NFC and BC (meq L−1
) changed rumen pH with -0.024, -0.020, 0.013 and -0.063, respectively but, because the R2 were low (0.31) and not significant (p > 0.05) result was not reported. Erdman [2], in his literature review paper’s reported a linear relationship between rumen pH and dietary ADF content where: rumen pH = 5.34+0.056 ADF (R2 = 0.30, p < 0.005). Considering the relationship between ADF and the predicted change in pH using this equation is higher than whatever find in present study. Additionally, respect to the R2 (0.30) in the above equation, this can be resulted that about 30% of change in rumen pH is related to the change in ADF percentage in the ration.
CONCLUSIONS
In summary, increases in feed efficiency in ruminants are associated with improvements in fiber digestion. A volume of literature is available, which suggest that better digestion of fiber needs a stable environment of the rumen. A challenge for future research will be the precise determination of buffer conditions in the rumen and to meet deficiencies in buffer capacity due to change in dietary acid consumption and rumen VFA production through change the feed ingredients or buffer supplementation only when dictated.
The present study showed that the BC and BVI of the twelve TMR’s differed from those predicted by summing the values for the individual feedstuffs. All analyzed BVI and BC were higher than calculated values. No significant correlation has been found between ruminal pH and dietary RDP or fiber.
REFERENCES
1. Chen, X.B., F.D.DeB. Hovell, E.R. Ørskov and D.S. Brown, 1990. Excretion of purine derivatives by ruminants: effects of exogenous nucleic acid supply on purine derivative excretion by sheep. British Journal of Nutrition., 63: 131-142.
2. Erdman, R.A., 1988. Dietary buffering requirements of the lactating dairy cow: a review. Journal of Dairy Science, 71: 3246-3266.
3. Giger-Reverdin, S., C. Duvaux-Ponter, D. Sauvant, O. Martin, I.N. Prado and R. Muller, 2001. Intrinsic buffering capacity of feedstuffs. Animal Feed Science and Technology, 96: 83-102.
4. Goering, H.K. and P.J. Van Soest, 1970. Forage fiber analyses (apparatus, reagents, procedures and some applications). Agric. Handbook No. 179. ARS, USDA, Washington, DC.
5. Jasaitis, D.K., J.E. Wohlt and J.l. Evans, 1987. Influence of fed ion content on buffering capacity of ruminant feedstuffs in vitro. Journal of Dairy Science, 70: 1391-1403.
6. Kaufmann, W., 1976. Influence of the composition of the ration and the feeding frequency on pH regulation in the rumen and on feed intake in ruminants. Livestock Production of Science., 3: 103-114.
7. Kohn, R.A. and T.F. Dunlap, 1998. Calculation of the buffering capacity of bicarbonate in the rumen
and in vitro. Journal of Animal Science, 76:
1702-1709.
8. Le Ruyet. P., W.B. Tucker, J.F. Hogue, M. Aslam and M. Lema, 1992. Influence of dietary fiber and buffer value index on the ruminal milieu of lactating dairy cows. Journal of Dairy Science, 75: 2394-2408.
9. Playne, M.J. and P. McDonald, 1966. The buffering constituents of herbage and of silage. Journal of Science and Food Agriculture, 17: 264-268.
10. SAS User’s Guide: Statistics, Version 6.03, 4th Edn. 1988. SAS Inst., Inc., Cary, NC.
11. Segel, I. H., 1976. Biochemical Calculation. 2nd Edn. John Wiley and Sons, New York.
12. Tucker, W.B., J.F. Hogue, M. Aslam, M. Lema, M. Martin, F.N. Owens, I.S. Shin, P. Le Ruyet and G.D. Adams. 1992. A buffer value index to evaluate effects of buffers on ruminal milieu in cows fed high or low concentrate, silage, or hay diets. Journal of Dairy Science., 75: 811-819. 13. Van Soest, P.J., J.B. Robertson and B.A. Lewis,
1991. Methods for dietary fiber, neutral detergent fiber and non-starch polysaccharides in relation to animal nutrition. Journal of Dairy Science, 74: 3583-3597.