Protective Effects of Ferulic Acid on High
Glucose-Induced Protein Glycation, Lipid
Peroxidation, and Membrane Ion Pump
Activity in Human Erythrocytes
Weerachat Sompong1,2, Henrique Cheng3, Sirichai Adisakwattana2,4*
1Program in Clinical Biochemistry and Molecular Medicine, Department of Clinical Chemistry, Faculty of Allied Health Sciences, Chulalongkorn University, Bangkok, Thailand,2Research Group of Herbal Medicine for Prevention and Therapeutic of Metabolic Diseases, Chulalongkorn University, Bangkok, Thailand, 3Department of Comparative Biomedical Sciences, School of Veterinary Medicine, Louisiana State University, Baton Rouge, Louisiana, United States of America,4Department of Nutrition and Dietetics, Faculty of Allied Health Sciences, Chulalongkorn University, Bangkok, Thailand
Abstract
Ferulic acid (FA) is the ubiquitous phytochemical phenolic derivative of cinnamic acid. Ex-perimental studies in diabetic models demonstrate that FA possesses multiple mechanisms of action associated with anti-hyperglycemic activity. The mechanism by which FA prevents diabetes-associated vascular damages remains unknown. The aim of study was to investi-gate the protective effects of FA on protein glycation, lipid peroxidation, membrane ion pump activity, and phosphatidylserine exposure in high glucose-exposed human erythro-cytes. Our results demonstrated that FA (10-100μM) significantly reduced the levels of
gly-cated hemoglobin (HbA1c) whereas 0.1-100μM concentrations inhibited lipid peroxidation
in erythrocytes exposed to 45 mM glucose. This was associated with increased glucose consumption. High glucose treatment also caused a significant reduction in Na+/K+-ATPase
activity in the erythrocyte plasma membrane which could be reversed by FA. Furthermore, we found that FA (0.1-100μM) prevented high glucose-induced phosphatidylserine
expo-sure. These findings provide insights into a novel mechanism of FA for the prevention of vascular dysfunction associated with diabetes.
Introduction
Chronic hyperglycemia is a major factor in the onset and progress of diabetic complications. Several mechanisms linking hyperglycemia to diabetic complications include the formation of advanced glycation end-products (AGEs), polyol activation, and increased reactive oxygen
spe-cies (ROS) [1]. Excessive production of ROS leads to oxidative damage and
structural/function-al structural/function-alternations to DNA, proteins, and membrane lipids. Human erythrocytes are important for oxygen transport and elimination of carbon dioxide. Likewise, they are highly susceptible a11111
OPEN ACCESS
Citation:Sompong W, Cheng H, Adisakwattana S (2015) Protective Effects of Ferulic Acid on High Glucose-Induced Protein Glycation, Lipid Peroxidation, and Membrane Ion Pump Activity in Human Erythrocytes. PLoS ONE 10(6): e0129495. doi:10.1371/journal.pone.0129495
Academic Editor:Ram Nagaraj, University of Colorado Denver School of Medicine, UNITED STATES
Received:February 13, 2015
Accepted:May 8, 2015
Published:June 8, 2015
Copyright:This is an open access article, free of all copyright, and may be freely reproduced, distributed, transmitted, modified, built upon, or otherwise used by anyone for any lawful purpose. The work is made available under theCreative Commons CC0public domain dedication.
Data Availability Statement:All relevant data are within the paper.
Funding:This work was supportedv by the Chula Dusadee Pipat project and The Asahi Glass Foundation. The funders had no role in study design, data collection and analysis, decision to publish, or preparation of the manuscript.
to protein and lipid oxidation that can alter the membrane structure and function (e.g.
fluidity, permeability, and enzyme activity) [2]. As an example, dysfunction of membrane ion
pumps such as Na+/K+-ATPase pump [3] and lipid peroxidation [4] are directly linked to
dia-betic vascular complications. Other studies suggest that phytochemical compounds can pre-vent high glucose-induced erythrocyte membrane damage due to their antioxidant activity [5,6].
Ferulic acid (4-hydroxy-3-methoxycinnamic acid), a cinnamic acid derivative, belongs to a large family of biologically active substances in vegetables [7], fruits [8], and medicinal herbs
[9]. Previous studies show that ferulic acid acts as a free radical scavenger such as hydroxyl and
peroxyl radicals [10] and an inhibitor of lipid peroxidation [11,12]. Improvement of
hypergly-cemia in diabetic rats was shown during ferulic acid treatment [13]. In addition, the compound
decreases oxidative stress and inflammation in diabetic nephropathy [14]. A number of studies
suggest that the anti-hyperglycemic effect of ferulic acid occurs by multiple mechanisms
[15,16]. One such mechanism involves inhibition ofα-glucosidase and stimulation of insulin
secretion [15,16]. Most strikingly, ferulic acid acts as a potent inhibitor of glucose-, fructose-, and ribose-induced protein glycation and oxidative damage in bovine serum albumin (BSA)
[17]. Despite the available information, there are no studies examining the effect of ferulic acid
on protein glycation in human erythrocytes. The objective of this study was to test whether fe-rulic acid can reduce protein glycation, lipid peroxidation, and phosphatidylserine exposure
and increase Na+/K+-ATPase activity in erythrocytes under high glucose condition. The
find-ings may provide insights into the mechanism by which ferulic acid prevents vascular and other diabetic related damages.
Materials and Methods
Chemicals and reagents
Ferulic acid, butylated hydroxytoluene (BHT), 2-thiobarbituric acid (TBA), malondialdehyde
tetrabutylammonium salt, adenosine 5'-triphosphate disodium salt hydrate (ATP-Na2),
am-monium molybdate, and ascorbic acid were purchased from Sigma-Aldrich Co. (St. Louis, USA). Dimethyl sulfoxide (DMSO) and Trichloroacetic acid (TCA) were obtained from Merck
(Darmstadt, Germany). Glucoese oxidase reagent and HbA1Cliquidirect reagent were
pur-chased from HUMAN (Wiesbaden, Germany). Rad protein assay was obtained from Bio-Rad (Hercules, USA). FITC annexin V/dead cell apoptosis kit was purchased from Molecular Probes (Eugene, USA). All other chemicals and solvents were of analytical grade.
Preparation of human erythrocytes
Whole blood samples were collected from 6 healthy volunteers ages 18–25 obese,
non-smoker, non-alcohol consumer, and free of any medicines, drugs, or nutritional supplements. Ethylenediaminetetraacetic acid (EDTA) was used as anti-coagulant and blood samples were centrifuged at 1,000 g at 4°C for 10 min. Then, the plasma and buffy coat layers were discarded. The erythrocyte layers were washed three times with cold 150 mM NaCl and centrifuged at 1,000 g at 4°C for 10 min. The supernatants were discarded after each centrifugation. The erythrocyte layers were re-suspended in phosphate-buffered saline (PBS, pH 7.4, containing 1
mM NaH2PO4, 16 mM Na2HPO4, and 140 mM NaCl). The Ethics Review Committee for
In vitro
treatment of erythrocytes with glucose
Erythrocytes were treated with glucose according to a previous method with minor
modifica-tions [18]. The reaction mixtures contained 10% hematocrit erythrocytes and 5 or 45 mM
glu-cose in PBS (pH 7.4) and were incubated at 37°C for 24 h in a shaking incubator. Ferulic acid
at 0.1, 1, 10, and 100μM in 0.1% DMSO were added into the reaction mixtures containing
glu-cose. The final concentration of 0.1% DMSO had no effect in the experiments.
After incubation, the percentages of hemolysis in the reaction mixtures were measured
ac-cording to a previous method with minor modifications [19]. Briefly, the reaction mixtures
were centrifuged at 1,000 g at 4°C for 10 min. The supernatants were measured at 540 nm. The percentage hemolysis was calculated by comparison to 100% hemolysis control (prepared by the incubation of 10% hematocrit erythrocytes with deionized water instead of PBS) using the
equation below. The percentages of hemolysis were<2% in each reaction mixture.
%Hemolysis¼ Abs540nmin the reaction mixtures
Abs540nmin100%hemolysis control x100
Before biochemical analysis, the reaction mixtures were washed three times with cold 150 mM NaCl and centrifuged at 1,000 g at 4°C for 10 min to remove the remaining glucose and ferulic acid. The supernatants were discarded after each centrifugation. Then, the erythro-cyte layers were re-suspended in PBS (pH 7.4). During this process, there is some erythroerythro-cyte loss in the samples. To normalize the amount of erythrocytes, the levels of hemoglobin (Hb)
was determined with Drabkin’s reagent according to a previous method with minor
modifica-tions [20]. The erythrocyte samples were adjusted to the same amount of Hb before biochemical
analysis.
Measurement of protein glycation (glycated hemoglobin or HbA
1c)
The levels of glycated hemoglobin or HbA1c, an Amadori product of protein glycation in
he-moglobin was used as a marker and determined with HbA1cliquidirect reagent according to
manufacturer’s protocol. The erythrocyte samples were lysed with hemolysis reagent and
incu-bated with latex reagent at 37°C for 5 min. The absorbance was measured at 610 nm. The levels
of HbA1cwere calculated from a standard curve using HbA1cand expressed as %HbA1c.
Measurement of glucose utilization
The levels of glucose utilization were measured according to a previous method with minor
modifications [21]. The concentrations of glucose were measured before and after the 24 h
in-cubation period by glucose oxidase reagent according to manufacturer’s protocol. The
absor-bance was measured at 505 nm. The levels of glucose utilization were calculated by subtracting glucose levels at 24 h from glucose levels at 0 h using the equation below. The result was ex-pressed as mmol/L.
Glucose utilizationðmmol=LÞ ¼ Glucose levels at0h Glucose levels at24h
Measurement of lipid peroxidation
The levels of malondialdehyde (MDA) were used as a marker for lipid peroxidation using thio-barbituric acid reactive substances (TBARS) according to a previous method with minor
modi-fications [18]. The erythrocyte samples were mixed with PBS (pH 7.4) and BHT (0.88% w/v in
and centrifuged at 2,000 g at 4°C for 15 min. The supernatants were incubated with TBA (1% w/v in 0.05 mM NaOH) and heated in a boiling water for 15 min. After cooling, the levels of TBARS were measured at 532 nm and calculated from a standard curve using malondialdehyde tetrabutylammonium salt. The results were expressed as nmol/mg Hb.
Measurement of Na
+/K
+-ATPase activity
The erythrocyte membranes were prepared according to a previous method with minor
modi-fication [22]. Erythrocyte samples were lysed with Tris-HCl (15 mM, pH 7.4) and centrifuged
at 12,000 g at 4°C for 30 min. The supernatants were discarded after the centrifugation. The erythrocyte membranes were washed with Tris-HCl (15 mM, pH 7.4) until the color of the membrane pellet was pale. Thereafter, deionized water was added to re-suspend the mem-branes. The concentration of protein was measured by Bio-Rad protein assay according to
manufacturer’s protocol.
The Na+/K+-ATPase activity was done according to a previous method with minor
modifi-cations [23]. The erythrocyte membranes were incubated with reaction buffer A containing 4
mM MgCl2, 3 mM ATP-Na2, and 50 mM Tris-HCl, pH 7.4, and buffer B containing 120 mM
NaCl, 20 mM KCl, 4 mM MgCl2, 3 mM ATP-Na2, and 50 mM Tris-HCl, pH 7.4 at 37°C for 1
h. After the incubation, the levels of phosphate (Pi) released from ATP-Na2were measured
ac-cording to a previous method with minor modifications [24]. The reaction mixture was
incu-bated with ammonium molybdate (2.5% w/v) at room temperature for 10 min. Then, ascorbic acid (2% w/v) was added and kept at room temperature for 20 min for color development. The absorbance was measured at 725 nm. The levels of Pi release were calculated from a standard
curve using KH2PO4. Na+/K+-ATPase activity was calculated using the equation below. The
re-sults were expressed as nmole Pi/mg protein/hour.
Naþ=Kþ ATPase activity ¼P
iin the reaction buffer B Piin the reaction buffer A
Measurement of phosphatidylserine exposure
The percentages of phosphatidylserine exposure on the erythrocyte membranes were measured
by FITC annexin V/dead cell apoptosis kit according to manufacturer’s protocol. The
erythro-cyte samples were suspended in annexin-binding buffer and incubated with FITC annexin V at room temperature for 15 min. After incubation, annexin-binding buffer was added and ana-lyzed by flow cytometer at an excitation wavelength of 494 nm and emission wavelength of 518 nm. Annexin V-positive cells were identified as apoptotic cells. The results were expressed as % phosphatidylserine exposure.
Statistical analysis
The results were expressed as mean±standard error of mean (SEM) (n= 6). The statistical
sig-nificance was evaluated using one-way ANOVA. Tukey’s HSD test was used to determine
sig-nificant differences between means.P<0.05 was considered to be statistically significant.
Results
Effects of ferulic acid on protein glycation (glycated hemoglobin or
HbA1c)
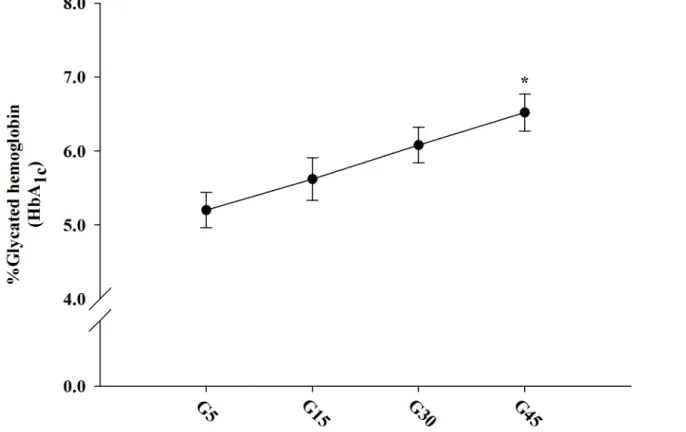
The concentration-dependent effects of glucose on Amadori product formation in erythrocytes
ranging from 5.62–6.52%. Erythrocytes treated with high glucose (45 mM) significantly
in-creased the levels of HbA1ccompared to 5 mM glucose. Therefore, we selected the 45 mM
con-centration for further experiments.
The effects of ferulic acid on Amadori product in erythrocytes treated with high glucose are
shown inFig 2. The results demonstrated that the levels of HbA1csignificantly increased about
1.26-fold with 45 mM glucose compared to erythrocytes treated with 5 mM glucose. This
in-crease was significantly inhibited by addition of ferulic acid (10 and 100μM) about 14.84% and
15.14%, respectively. There were no differences in the levels of HbA1cfrom erythrocytes treated
with 45 mM glucose and ferulic acid at concentrations of 0.1 and 1μM.
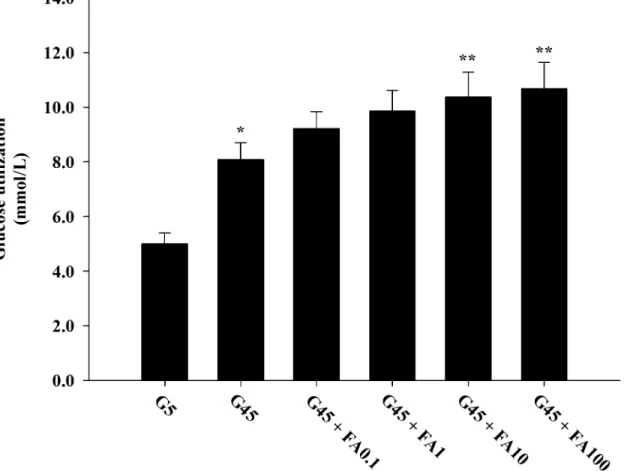
Effects of ferulic acid on glucose utilization
InFig 3, the effects of ferulic acid on glucose utilization in erythrocytes treated with glucose during 24 h are shown. A significant enhancement in glucose utilization was observed with 45
mM glucose compared to 5 mM glucose. Ferulic acid (0.1–100μM) with 45 mM glucose caused
a gradual increase in glucose utilization by 16.25%, 25.06%, 32.02%, and 36.47%, respectively.
It was very interesting that ferulic acid at 10 and 100μM concentrations significantly increased
glucose utilization.
Effects of ferulic acid on lipid peroxidation
The effects of ferulic acid on lipid peroxidation in erythrocytes treated with glucose are shown inFig 4. The levels of lipid peroxidation with 45 mM glucose were 1.45-fold higher than with 5
mM glucose. The addition of ferulic acid (0.1–100μM) with 45 mM glucose significantly
Fig 1. The concentration-dependent effects of 5–45 mM glucose on protein glycation (glycated hemoglobin or HbA1c) in erythrocytes at 37°C for
24 h.The results were expressed as mean±SEM (n= 6).*p<0.05 when compared to 5 mM glucose (G5) treatment.
decreased lipid peroxidation (11.51%-23.50%) compared to erythrocytes treated with 45 mM glucose alone.
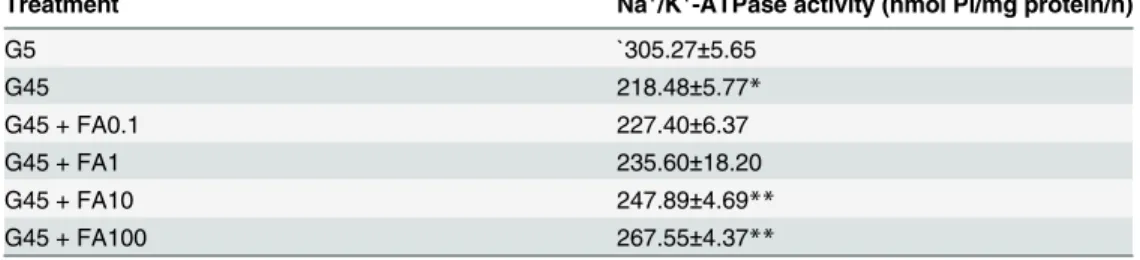
Effects of ferulic acid on Na
+/K
+-ATPase activity
The effects of ferulic acid on Na+/K+-ATPase activity in erythrocyte treated with glucose are
shown inTable 1. A significant reduction in Na+/K+-ATPase activity was observed with 45 mM
glucose (28.33%) compared to 5 mM glucose. The addition of 10 and 100μM ferulic acid
re-versed some of the inhibitory effect of high glucose on Na+/K+-ATPase activity (14.13% and
22.81%, respectively).
Effects of ferulic acid on phosphatidylserine exposure
The effects of ferulic acid on phosphatidylserine exposure in erythrocytes treated with glucose
are shown in Fig5Aand5B. A significant increase in the percentages of phosphatidylserine
ex-posure was observed with 45 mM glucose (3.87-fold) compared to 5 mM glucose. Ferulic acid
(0.1, 1, 10, and 100μM) in erythrocytes treated with 45 mM glucose decreased
phosphatidyl-serine exposure by 68.62%, 70.77%, 74.92%, and 80.91%, respectively, compared to 45 mM glucose alone.
Fig 2. The effects of ferulic acid (0.1–100μM) on protein glycation (glycated hemoglobin or HbA1c) in erythrocytes treated with 45 mM glucose.The
results are expressed as mean±SEM (n= 6).*p<0.05 compared to 5 mM glucose (G5) and**p<0.05 compared to 45 mM glucose (G45) treatments.
Discussion
The long-term effect of chronic hyperglycemia contributes to the development of pathogenesis associated with diabetes. In erythrocytes, exposure to high glucose results in increased ROS
from auto-oxidation leading to protein glycation [18]. Normally, erythrocytes uptake glucose
from the extracellular fluid through glucose transporter-1 (GLUT-1), which undergoes
glycoly-sis to produce ATP and pyruvate [25]. In the absence of mitochondria and oxidative
metabo-lism, pyruvate is reduced to lactic acidviaanaerobic glycolysis [26]. It is known that glucose
utilization by erythrocytes can be increased during hyperglycemia [18]. Elevated extracellular
glucose induces glucose toxicity and oxidative stress through auto-oxidation and formation of protein glycation [5,18]. It also increases glucose utilization and HbA1Clevels [18]. In the
pres-ent study, high glucose concpres-entration was used to demonstrate its ability to induce protein gly-cation in a short time period, similar to otherin vitrostudies [18,21]. Interestingly, ferulic acid
increased glucose utilization, thereby decreasing intracellular glucose and inhibiting HbA1c
for-mation under high glucose condition. The precise mechanism by which ferulic acid increases
glucose utilization remains unknown. Changet al. reported that cinnamic acid derivatives
might play an important role in the stimulation of glucose uptake to improve its utilization in
C2C12 cells [27]. The current findings suggest that the increased glucose utilization by ferulic
acid might be involved in the activation of glucose uptake in human erythrocytes. In the same
Fig 3. The effects of ferulic acid (0.1–100μM) on glucose utilization in erythrocytes treated with 45 mM glucose.The results are expressed as mean
±SEM (n= 6).*p<0.05 compared to 5 mM glucose (G5) and**p<0.05 compared to 45 mM glucose (G45) treatments.
cell type, reactive oxygen species (ROS) are produced during high glucose exposure through
auto-oxidation and protein glycation [28,29]. ROS causes oxidative degradation of biological
molecules especially lipid membrane resulting in cell damage [21]. Lipid peroxidation is widely
used as a marker for membrane oxidative damage in other cells [5,18,28,29]. Similar findings
are observed in erythrocytes treated with high glucose [5,18,28,29]. An increase in erythrocyte
Fig 4. The effects of ferulic acid (0.1–100μM) on lipid peroxidation in erythrocytes treated with 45 mM glucose.The results are expressed as mean ±SEM (n= 6).*p<0.05 compared to 5 mM glucose (G5) and**p<0.05 compared to 45 mM glucose (G45) treatments.).
doi:10.1371/journal.pone.0129495.g004
Table 1. The effects of ferulic acid (0.1–100μM) on Na+/K+-ATPase activity in erythrocytes treated
with 45 mM glucose.
Treatment Na+/K+-ATPase activity (nmol Pi/mg protein/h)
G5 `305.27±5.65
G45 218.48±5.77*
G45 + FA0.1 227.40±6.37
G45 + FA1 235.60±18.20
G45 + FA10 247.89±4.69**
G45 + FA100 267.55±4.37**
The results are expressed as mean±SEM (n= 6).*p<0.05 compared to 5 mM glucose (G5) and**p<0.05 compared to 45 mM glucose (G45) treatments.
membrane lipid peroxidation is observed in diabetic patients [30]. Considerable interest has been given to antioxidants due to their ability to prevent protein glycation and membrane lipid peroxidation and based on our findings, ferulic acid has similar properties.
Na+/K+-ATPase pump is an integral membrane protein that plays a major role in the
regu-lation of Na+and K+gradients between extracellular and intracellular space by promoting Na+
efflux and K+influx [31]. Therefore, inhibition of Na+/K+-ATPase pump can affect a number
of cellular processes and function [32]. There is evidence indicating that fructose- and
methyl-glyoxal-induced glycation causes the impairment of Na+/K+-ATPase activity [33].
Down-regu-lation of Na+/K+-ATPase pump is observed in streptozotocin-induced diabetic rats [34–37].
Type 1 and 2 diabetic patients often have reduced Na+/K+-ATPase activity [38,39]. This
condi-tion is also seen in diabetic neuropathy [40]. Our findings that erythrocytes treated with high
glucose have reduced Na+/K+-ATPase activity is consistent with previous studies [5,18,28]. Phosphatidylserine is one of four major phospholipids located in the plasma membranes of
mammalian cells. It comprises 8–15% of the total phospholipid content [41]. Normally,
phos-phatidylserine is present in the inner layer of the plasma membrane and facilitates protein
binding at the endofacial surface [40]. In addition, it forms an important cofactor for Na+/K+
-ATPase pump [40]. Hyperglycemia-induced oxidative stress, cell damage, and apoptosis cause
the exposure of phosphatidylserine into the outer layer of the erythrocyte membrane [41].
Fur-thermore, erythrocytes from diabetic patients have membrane phospholipid asymmetry with
increased surface exposure of phosphatidylserine [42]. This is suggested to facilitate
erythro-cyte adhesion to the vascular wall [43] and further contributing to thrombosis and
Fig 5. The effects of ferulic acid (0.1–100μM) on phosphatidylserine exposure (A) and their percentages (B) in erythrocytes treated with 45 mM
glucose.The results are expressed as mean±SEM (n= 6).*p<0.05 compared to 5 mM glucose (G5) and**p<0.05 compared to 45 mM glucose
(G45) treatments.
microcirculation impairment [44–46]. In our study, erythrocytes treated with high glucose
ex-hibited phosphatidylserine exposure that was consistent with previous findings [47,48]. These
results indicate that ferulic acid improves hyperglycemia-induced impairment of Na+/K+
-ATPase activity and decreases the levels of phosphatidylserine exposure in erythrocytes. In conclusion, we demonstrated that ferulic acid is capable of improving the effects of hy-perglycemia on protein glycation and lipid oxidation in erythrocytes. Ferulic acid also
in-creased glucose consumption and Na+/K+-ATPase activity while reducing phosphatidylserine
exposure. These results provide a better understanding of the mechanism by which ferulic acid may help prevent cellular dysfunction and vascular complications associated to diabetes.
Acknowledgments
We would like to thank Chulalongkorn University for a Ph.D. Scholarship (Weerachat Som-pong) under the Chula Dusadee Pipat project. This research was supported by The Asahi Glass Foundation.
Author Contributions
Conceived and designed the experiments: WS SA. Performed the experiments: WS. Analyzed the data: WS SA. Contributed reagents/materials/analysis tools: SA. Wrote the paper: WS SA HC.
References
1. Giacco F, Brownlee M. Oxidative stress and diabetic complications. Circ Res. 2010; 107: 1058–1070. doi:10.1161/CIRCRESAHA.110.223545PMID:21030723
2. Hunt JV, Dean RT, Wolff SP. Hydroxyl radical production and autoxidative glycosylation. Glucose au-toxidation as the cause of protein damage in the experimental glycation model of diabetes mellitus and ageing. Biochem J. 1988; 256: 205–212. PMID:2851978
3. Vague P, Coste TC, Jannot MF, Raccah D, Tsimaratos M. C-peptide, Na+,K+-ATPase, and diabetes. Exp Diabesity Res. 2004; 5: 37–50. PMID:15198370
4. Ihm SH, Yoo HJ, Park SW, Ihm J. Effect of aminoguanidine on lipid peroxidation in streptozotocin-induced diabetic rats. Metabolism. 1999; 48: 1141–1145. PMID:10484054
5. Jain SK, Lim G. Lipoic acid decreases lipid peroxidation and protein glycosylation and increases (Na++ K+)- and Ca++-ATPase activities in high glucose-treated human erythrocytes. Free Radic Biol Med. 2000; 29: 1122–1128. PMID:11121719
6. Martínez V, Ugartondo V, Vinardell MP, Torres JL, Mitjans M. Grape epicatechin conjugates prevent erythrocyte membrane protein oxidation. J Agric Food Chem. 2012; 60: 4090–4095. doi:10.1021/ jf2051784PMID:22480260
7. Mattila P, Hellström J. Phenolic acids in potatoes, vegetables, and some of their products. J Food Comp Anal. 2007; 20: 152–160.
8. Mattila P, Hellström J, Törrönen R. Phenolic acids in berries, fruits, and beverages. J Agric Food Chem. 2006; 54: 7193–7199. PMID:16968082
9. Sakai S, Kawamata H, Kogure T, Mantani N, Terasawa K, Umatake M, et al. Inhibitory effect of ferulic acid and isoferulic acid on the production of macrophage inflammatory protein-2 in response to respira-tory syncytial virus infection in RAW264.7 cells. Mediators Inflamm. 1999; 8: 173–175. PMID: 10704056
10. Kanski J, Aksenova M, Stoyanova A, Butterfield DA. Ferulic acid antioxidant protection against hydrox-yl and peroxhydrox-yl radical oxidation in synaptosomal and neuronal cell culture systems in vitro: structure-activity studies. J Nutr Biochem. 2002; 13: 273–281. PMID:12015157
11. Balasubashini MS, Rukkumani R, Viswanathan P, Menon VP. Ferulic acid alleviates lipid peroxidation in diabetic rats. Phytother Res. 2004; 18: 310–314. PMID:15162367
13. Balasubashini MS, Rukkumani R, Menon VP. Protective effects of ferulic acid on hyperlipidemic diabet-ic rats. Acta Diabetol. 2003; 40: 118–122. PMID:14605967
14. Choi R, Kim BH, Naowaboot J, Lee MY, Hyun MR, Cho EJ, et al. Effects of ferulic acid on diabetic ne-phropathy in a rat model of type 2 diabetes. Exp Mol Med. 2011; 43: 676–683. doi:10.3858/emm.2011. 43.12.078PMID:21975281
15. Adisakwattana S, Chantarasinlapin P, Thammarat H, Yibchok-Anun S. A series of cinnamic acid deriv-atives and their inhibitory activity on intestinalα-glucosidase. J Enzyme Inhib Med Chem. 2009; 24: 1194–1200. doi:10.1080/14756360902779326PMID:19772492
16. Adisakwattana S, Moonsan P, Yibchok-Anun S. Insulin-releasing properties of a series of cinnamic acid derivatives in vitro and in vivo. J Agric Food Chem. 2008; 56: 7838–7844. doi:10.1021/jf801208t PMID:18651742
17. Sompong W, Meeprom A, Cheng H, Adisakwattana S. A comparative study of ferulic acid on different monosaccharide-mediated protein glycation and oxidative damage in bovine serum albumin. Mole-cules. 2013; 18: 13886–13903. doi:10.3390/molecules181113886PMID:24284487
18. Nandhini TA, Anuradha CV. Inhibition of lipid peroxidation, protein glycation and elevation of membrane ion pump activity by taurine in RBC exposed to high glucose. Clin Chim Acta. 2003; 336: 129–135. PMID:14500045
19. Baumann E, Stoya G, Völkner A, Richter W, Lemke C, Linss W. Hemolysis of human erythrocytes with saponin affects the membrane structure. Acta Histochem. 2000; 102: 21–35. PMID:10726162 20. Walters MI. An evaluation of hemoglobin concentrations obtained with frozen altered Drabkin’s
re-agents. Clin Chem. 1968; 14: 682–691. PMID:5663464
21. Jain SK, McVie R, Duett J, Herbst JJ. Erythrocyte membrane lipid peroxidation and glycosylated hemo-globin in diabetes. Diabetes. 1989; 38: 1539–1543. PMID:2583378
22. Malfatti CR, Burgos LT, Rieger A, Rüdger CL, Túrmina JA, Pereira RA, et al. Decreased erythrocyte NA+,K+-ATPase activity and increased plasma TBARS in prehypertensive patients. Scientific World Journal. 2012 Aug 1. doi:10.1100/2012/348246
23. Vlachos DG, Schulpis KH, Antsaklis A, Mesogitis S, Biliatis I, Tsakiris S. Erythrocyte membrane AChE, Na+, K+-ATPase and Mg2+ATPase activities in mothers and their premature neonates in relation to the mode of delivery. Scand J Clin Lab Invest. 2010; 70: 568–574. doi:10.3109/00365513.2010.527365 PMID:20964587
24. Fiske CH, Subbarow Y. The colorimetric determination of phosphorus. J Biol Chem. 1925; 66: 375–400. 25. Kurlbaum M, Mülek M, Högger P. Facilitated uptake of a bioactive metabolite of maritime pine bark
ex-tract (Pycnogenol) into human erythrocytes. PloS One. 2013 Apr 30. doi:10.1371/journal.pone. 0063197
26. van Wijk R, van Solinge WW. The energy-less red blood cell is lost: erythrocyte enzyme abnormalities of glycolysis. Blood. 2005; 106: 4034–4042. PMID:16051738
27. Chang HK, Hsu FL, Liu IM, Cheng JT. Stimulatory effect of cinnamic acid analogues onα 1A-adrenocep-tors in-vitro. J Pharm Pharmacol. 2003; 55: 833–837. PMID:12841945
28. Jain SK, Lim G. Pyridoxine and pyridoxamine inhibits superoxide radicals and prevents lipid peroxida-tion, protein glycosylaperoxida-tion, and (Na++ K+)-ATPase activity reduction in high glucose-treated human erythrocytes. Free Radic Biol Med. 2001; 30: 232–237. PMID:11165869
29. Jain SK, Rains J, Jones K. Effect of curcumin on protein glycosylation, lipid peroxidation, and oxygen radical generation in human red blood cells exposed to high glucose levels. Free Radic Biol Med. 2006; 41: 92–96. PMID:16781457
30. Kesavulu MM, Giri R, Kameswara Rao B, Apparao C. Lipid peroxidation and antioxidant enzyme levels in type 2 diabetics with microvascular complications. Diabetes Metab. 2000; 26: 387–392. PMID: 11119018
31. Horvat A, MomićT, Banjac A, PetrovićS, NikezićG, Demajo M. Selective inhibition of brain Na,K-ATPase by drugs. Physiol Res. 2006; 55: 325–338. PMID:16083303
32. Rajeswari P, Natarajan R, Nadler JL, Kumar D, Kalra VK. Glucose induces lipid peroxidation and inacti-vation of membrane-associated ion-transport enzymes in human erythrocytes in vivo and in vitro. J Cell Physiol. 1991; 149: 100–109. PMID:1658008
33. Derham BK, Ellory JC, Bron AJ, Harding JJ. The molecular chaperone alpha-crystallin incorporated into red cell ghosts protects membrane Na/K-ATPase against glycation and oxidative stress. Eur J Bio-chem. 2003; 270: 2605–2611. PMID:12787026
35. Di Leo MA, Santini SA, Cercone S, Lepore D, Gentiloni Silveri N, Caputo S, et al. Chronic taurine sup-plementation ameliorates oxidative stress and Na+K+ATPase impairment in the retina of diabetic rats. Amino Acids. 2002; 23: 401–406. PMID:12436207
36. Lambourne JE, Brown AM, Calcutt N, Tomlinson DR, Willars GB. Adenosine triphosphatase in nerves and ganglia of rats with streptozotocin-induced diabetes or galactosaemia; effects of aldose reductase inhibition. Diabetologia. 1988; 31: 379–384. PMID:2970984
37. Naka K, Sasaki H, Kishi Y, Furuta M, Sanke T, Nanjo K, et al. Effects of cilostazol on development of ex-perimental diabetic neuropathy: functional and structural studies, and Na+-K+-ATPase acidity in periph-eral nerve in rats with streptozotocin-induced diabetes. Diabetes Res Clin Pract. 1995; 30: 153–162. PMID:8861454
38. Iwalokun BA, Iwalokun SO. Association between erythrocyte Na+K+-ATPase activity and some blood lipids in type 1 diabetic patients from Lagos, Nigeria. BMC Endocr Disord. 2007 Oct 1. PMID:17953765 39. Mishra N, Rizvi SI. Quercetin modulates Na+/K+ATPase and sodium hydrogen exchanger in type 2
dia-betic erythrocytes. Cell Mol Biol (Noisy-le-grand). 2012; 58: 148–152. PMID:23273205
40. Koc B, Erten V, Yilmaz MI, Sonmez A, Kocar IH. The relationship between red blood cell Na/K-ATPase activities and diabetic complications in patients with type 2 diabetes mellitus. Endocrine. 2003; 21: 273–278. PMID:14515013
41. Zwaal RF, Comfurius P, Bevers EM. Surface exposure of phosphatidylserine in pathological cells. Cell Mol Life Sci. 2005; 62: 971–988. PMID:15761668
42. Lupu F, Calb M, Fixman A. Alterations of phospholipid asymmetry in the membrane of spontaneously aggregated platelets in diabetes. Thromb Res. 1988; 50: 605–616. PMID:3413722
43. Closse C, Dachary-Prigent J, Boisseau MR. Phosphatidylserine-related adhesion of human erythro-cytes to vascular endothelium. Br J Haematol. 1999; 107: 300–302. PMID:10583215
44. Sprague RS, Stephenson AH, Dimmitt RA, Weintraub NL, Branch CA, McMurdo L, et al. Effect of L-NAME on pressure-flow relationships in isolated rabbit lungs: role of red blood cells. Am J Physiol. 1995; 269: H1941–H1948. PMID:8594902
45. Sprague RS, Ellsworth ML, Stephenson AH, Lonigro AJ. ATP: the red blood cell link to NO and local control of the pulmonary circulation. Am J Physiol. 1996; 271: H2717–H2722. PMID:8997335 46. Pawloski JR, Hess DT, Stamler JS. Export by red blood cells of nitric oxide bioactivity. Nature. 2001;
409: 622–626. PMID:11214321
47. Quan GB, Liu MX, Ren SP, Zhang JG, Han Y. Changes of phosphatidylserine distribution in human red blood cells during the process of loading sugars. Cryobiology. 2006; 53: 107–118. PMID:16762335 48. Quan GB, Han Y, Yang C, Hu WB, Liu A, Wang JX, et al. Inhibition of high glucose-induced erythrocyte