Powerful CEOs and their Impact on Corporate Performance
*Renée B. Adams** Federal Reserve Bank of New York
Heitor Almeida New York University
Daniel Ferreira University of Chicago
This Version: May 12, 2002
*Corresponding author: Heitor Almeida, 40 West 4th Street room 9-190, New York NY 10012.
E-mail: [email protected]. We wish to thank Murillo Campello, Charlie Hadlock, Laurie Hodrick,
Frances Milliken, Raghu Rajan, Raaj K. Sah, Antoinette Schoar and seminar participants at Michigan State
University, NYU, UFRGS and at the NBER Corporate Finance Meetings of November 16th, 2001 for many useful comments. We also thank Chitra Krishnamurthi, Adrienne Rumble and Nelson Wong for excellent
research assistance.
** The opinions expressed in this paper are my own and not those of the Federal Reserve Bank of New
Abstract
We argue in this paper that executives can only impact firm outcomes if they have influence over crucial decisions. Based on this idea we develop and test a hypothesis about how CEOs’
power to influence decisions will affect firm performance: since managers’ opinions may differ, firms whose CEOs have more decision-making power should experience more variability in firm performance. Thus performance depends on the interaction between executive characteristics and
organizational variables. By focusing on this interaction we are able to usefirm-level characteristics to test predictions that are related to unobservable managerial characteristics. Using such fi rm-level characteristics of the Executive Office we develop a proxy for the CEO’s power to influence decisions and provide evidence consistent with our hypothesis. Firm performance (measured by
1
Introduction
...the VP said of the decision process: “The decision was a Don Rogers edict - not a
vote”. The CEO agreed: “I made the decision myself, despite the objections of everyone.
I said ‘the hell with it, let’s go with the PC interface.”’
(quoted by Eisenhardt and Bourgeois, 1988)
In somefirms the CEO makes all the major decisions. In otherfirms decisions are more clearly the product of consensus among the top executives. In this paper we examine whether the power
of the CEO to influence decisions affects performance.
More power to influence decisions in the hands of the CEO is not necessarily bad. For example, if the CEO in the quote above had the right intuition about the PC interface, then the fact that he
had the power to implement his choice against the objections of the other executives was in the best
interests of thefirm. On the other hand, the CEO could have been wrong. As this simple example illustrates, power in the hands of the CEO may have an ambiguous effect on average performance.
However, with more decision-making power the CEO will not need to rely as much on the opinions
of other executives. Therefore, firms whose CEOs have more power to impact decisions may have more variable performances because the CEO is making decisions by himself rather than with a
group.
We develop a simple hypothesis about how the CEO’s ability to influence decisions will affect firm performance. In an organization in which only the CEO makes the most relevant decisions, the risk arising from judgement errors is not well diversified. That is, the likelihood of either very good or very bad decisions is higher in an organization in which the CEO’s power to influence decisions is greater than in an organization in which many executives are involved in
decision-making, because the CEO will have to compromise with them when they disagree with him. Thus,
our main prediction is that as the degree of CEO influence increases variability infirm performance increases because decisions with extreme consequences are more likely to be taken.1
1 In section 2 we construct our hypothesis using the theoretical framework in Sah and Stiglitz (1986, 1988). Sah
Frictions in decision-making by top management have been the focus of a large number of
papers in the corporate finance literature. Most of this work is based on agency theory, which emphasizes the possibility that the incentives of top managers and shareholders are not perfectly
aligned, creating the potential for value-decreasing distortions in the corporate decision process
(see for example the survey of corporate governance by Shleifer and Vishny, 1997). However, the
hypothesized relationship between the ability to influence decisions and variability in performance we study here does not depend on the existence of an agency problem. Real world decisions will
also be constrained by the decision-making ability of top managers. Even when they have the right
incentives, managers may make good or bad decisions due to human fallibility (Sah, 1991; Sah and
Stiglitz, 1991; Bhidé, 2001) or because they are overconfident (Heaton, 1998; Goel and Thakor, 2000) or have different “visions” (Rotemberg and Saloner, 2000; Van den Steen, 2001; Hart and
Holmstrom, 2002). We focus primarily on these latter ideas to develop our empirical tests, although
we also examine to what degree the evidence we present is consistent with agency problems.
In order to test our hypothesis we develop a measure of the CEO’s power to influence decisions which we call the index of influence power. Our index uses the number of job titles of the CEO,
the CEO succession process, the overlap of the Executive Office with the Board and the retention
of the CEO title by a firm’s founder to proxy for the number of people participating in decision-making. For example, we argue that if the Chairman of the Board is not the CEO, the CEO has
less influence power because the Chairman will also participate in decision-making. Similarly, if the current CEO is an original founder of the firm, he is more likely to have the power to make decisions on his own.
Because our hypothesis concerns differences in variability, we apply three different
heteroscedas-ticity tests to our data. The Goldfeld-Quandt test consists of comparing the variance of the
per-formance variable (or the part of it not explained by an appropriate empirical model) between
We apply these tests to a sample of 336 firms from the 1998 Fortune 500 over the time period 1992-1999. Data are from Execucomp, CRSP, Compustat, Moody’s Industrial Manuals,
Interna-tional Directories of Business Histories, Hoover’s Company Profile Database, the U.S. News source and archived Forbes and Fortune stories on Lexis-Nexis, proxy statements, annual reports and the
internet. Our final sample consists of 2,633 firm-years of data and 34,158 monthly stock returns for 336 firms during the 1992-1999 time period. Using three different measures of performance, Tobin’sQ, ROAand stock returns, wefind that performance is more variable infirms with greater values of our influence power index.
The empirical evidence that CEO influence power is positively correlated with the variability of performance is consistent with the hypothesis we examine. However, one might argue that this
correlation could be explained by alternative arguments. For example, Amihud and Lev (1981),
Agrawal and Mandelker (1987) and Saunders, Strock and Travlos (1990) have argued that if
man-agerial interests are not well aligned with those of shareholders, then managers might engage in
self-interested risk-reduction activities such as conglomerate acquisitions. The authors thus predict
a positive relationship between managerial ownership and risk (which they measure using
variabil-ity in accounting measures of performance or stock returns). If managerial ownership is positively
correlated with CEO influence power, then our result could be explained by this agency argument. However, even though the correlation between ownership and performance variability is positive
in our data, the relationship between the influence power index and performance variability is positive even after we control for CEO ownership. Similarly, one might argue that the influence power index is simply capturing other variables which could affect performance variability such as
diversification, firm size, or firm age. Although these variables affect variability in performance in the expected ways in our data, we show that our index has an independent effect even after
controlling for these other determinants of variability. Furthermore, the effect of influence power on the variability of performance is also economically significant, compared to the effect of these other variables. For example, one less title for the CEO has an effect on performance variability
which is equivalent to an increase of 20 years of firm age or to 3 additional segments.
Our empirical investigation is motivated by the idea that the more latitude in decision-making
we present is consistent with this view. However, CEO influence power may be endogenously determined. In particular, variance in performance may lead to changes in CEO influence power. For example, an increase in uncertainty may increase the scope for moral hazard (e.g. Demsetz,
1983; Demsetz and Lehn, 1985). Therefore, agency theory would predict that when uncertainty
increases, principals would try to put more constraints on agents’ behavior.2 If reducing a CEO’s
influence power is a way to prevent his misbehavior, then increases in the variability of performance should result in a decrease in the CEO’s influence power. For example, if the scope for agency problems increases it might be desirable to separate the positions of Chairman of the Board and
CEO (e.g. Core, Holthausen and Larcker, 1999). Similarly, it might be desirable to have a CEO
position occupied by someone other than a founder of thefirm. Separating these positions decreases our measure of CEO influence power. Thus, the positive correlation between our proxy for CEO influence power and variability cannot be driven by this agency argument. In fact, if this argument is true it would be more difficult for us tofind a positive correlation between performance variability and influence power.3
The other possibility is that both the worst and also the best past performers tend to give
more power to the CEO. The worst performers may need to implement quick changes in decisions
and direction, while the best performing firms may give more power to the CEO because good performance signals high decision-making ability of the CEO. This theory could explain ourfinding, since the best and the worst performers tend to be in the sample of volatile firms. However, the direction of the causality is from past performance to CEO power, and not the other way around.
We explore the explicit temporal dimension of this argument to assess its relevance in our data.
We find that past extreme performances, if anything, reduce the likelihood of future increases in influence power. This finding casts doubt on theories that try to explain the positive correlation between influence power and performance variability by postulating causation from variability to influence power. On the other hand, the results are consistent with the idea that CEOs become
2For example, Demsetz and Lehn (1985) use this insight to explain their
finding of a positive correlation between inside ownership and volatility of performance.
3 There is also a substantial management literature which predicts a similar negative relationship between the
more constrained as uncertainty increases. We also find that past increases in influence power increase the likelihood of future extreme performances, which is consistent with the hypothesis
that influence power affects performance variability.
To try to isolate the effect of influence power on performance variability from other sources of variation, we use instrumental variables methods. We use founders’ current age, whether founders
are alive or dead during our sample period and the number of founders as instruments for influence power. The results suggest the existence of an independent effect of influence power on performance variability, one that remains even after we control for the possible endogeneity of CEO influence power. The IV estimates of the effect of influence power on performance variability are always greater than the OLS estimates, which also suggests that performance variability may have a
negative effect on CEO influence power, consistent with the agency story we describe above. We conclude that the positive correlation between CEO influence power and performance variability is not only robust, but is also consistent with causation running from influence power to performance. Our paper adds to a large literature which tries to assess the impact of managers on firm outcomes. In the management literature there is some controversy over whether top executives
matter. A classic reference on the view that managers do not matter is Lieberson and O’Connor
(1972). In contrast, Hambrick and Mason (1984) argue that they do matter, and are supported by
numerous large-sample studies evaluating the importance of executives for outcomes, e.g. Weiner
and Mahoney (1981) (see Finkelstein and Hambrick, 1996, for an extensive list of references). In
economics and finance many papers analyze related questions. Hermalin and Weisbach (1988) and Agrawal and Knoeber (2001) find evidence consistent with firms optimally choosing directors for their characteristics. Denis and Denis (1995), Weisbach (1995), Parrino (1997), Huson,
Malat-esta and Parrino (2001) and Clayton, Rosenberg and Hartzell (2000) all show evidence that CEO
turnover is related tofirm outcomes. Malmendier and Tate (2001) and Bertrand and Schoar (2001) provide evidence that top executives’ characteristics are related tofirm outcomes.
Our point in this paper is that executives can only impactfirm outcomes if they have influence over crucial decisions. By focusing on influence we highlight the idea that performance depends on the interaction between executive characteristics and organizational variables. Our focus on this
unob-servable managerial characteristics. The main characteristics we are concerned with in this paper
are the CEO’s opinions, which are not easily observable. Therefore, we use our influence power index, which is a firm-level variable, to assess the impact of CEOs’ opinions on performance.4 In
addition, it is difficult to predict how executive characteristics should affect outcomes. Our
ap-proach allows us to identify a precise testable implication: if CEOs opinions differ, concentration of
decision-making power in the hands of the CEO should lead to more variability infirm performance. We develop our theoretical hypothesis in section 2. In section 3, we describe our measure of CEO
influence power. In section 4 we describe our sample in detail. We test our empirical hypothesis in section 5. After establishing our result, we discuss possible implications in section 6.
2
In
fl
uence Power and Performance: Theoretical Arguments
Our hypothesis is that firms in which the CEO has less power to influence decisions will have less extreme performances. With less power, CEOs will implement fewer projects, either good or bad,
because the CEO will have to compromise with other members of the top management team when
they disagree with him. We illustrate this argument with a simple model based on Sah and Stiglitz
(1986, 1988).
Sah and Stiglitz (1986, 1988) compare outcomes under different structures of
group-decision-making when individuals’ judgements entail errors. We re-interpret their set-up in terms of CEO
influence power.
The CEO and other top managers face the decision of whether or not to implement a given
project. With probability π the project has a positiveNP V of Gand with probability1−π the
project has a negativeN P V of−B. For simplicity, we compare two cases: either the CEO decides alone or he has to share the responsibility over the decision with one other person. In the latter
case, the CEO has less influence power than when he makes the decision alone.
Each manager has his own opinion about whether the project is good or bad. More specifically, let pG be the probability that a manager thinks the project is good (i.e., of positive N P V) given
4 This approach is similar to the one adopted by many researchers who are concerned with the effects of
that project is G. Even when the project is G, there is a possibility that a manager thinks that
the project is B. Therefore, pG ≤ 1. Similarly, pB is the probability that a manager thinks the project is good given that project is B. Even when the project is B, there is a possibility that a
manager thinks that the project isG. Therefore, pB ≥0. The crucial assumption in the model is that managers might end up having different opinions; i.e., the probability that a given manager
thinks that the project is good is independent of what other managers think. For simplicity, we
also assume thatpG andpB are the same for all managers. In short, opinions are random variables
that are independently and identically distributed across managers.
When the CEO makes all the decisions himself (i.e., when he has more influence power), the probability that he accepts the project (regardless of whether the project is good (G) or bad
(B)) is πpG+ (1−π)pB. On the other hand, if the CEO shares decision power with some other
executive, they both have to believe that the project is good in order to implement it. Therefore,
the probability that they accept the project is πp2
G+ (1−π)p
2
B. Our main result follows immediately:
Proposition 1 The probability of extreme performances (i.e., an outcome of either G or −B) increases with the CEO’s influence power.
The intuition for this result is as follows. When the CEO’s influence on decisions increases, more projects of either type will be accepted because the number of managers who need to agree
with the CEO for a project to be accepted decreases. Therefore, more positiveN P V projects are accepted, but more negativeN P V projects are accepted as well.
The effect of CEOs’ influence power on expected performance is ambiguous. Expected perfor-mance depends on the relative costs of rejecting good projects versus accepting bad ones.
Sah and Stiglitz (1986, 1988) justify their assumption that managers have different opinions
about whether the project is good using the ideas that communication is costly, or that people
differ in their abilities to process information. Another justification for this lack of agreement could be that people have different priors. For our purposes, it makes little difference which of these
explanations apply.5 As long as people disagree, the results derived above hold.
5
A set of recent papers also emphasizes differences in opinions. The common theme underlying
these papers is that the CEO’s judgement is biased. This bias has been called overconfidence, optimism or vision (Heaton, 1998; Rotemberg and Saloner, 2000; Goel and Thakor, 2000; Van
den Steen, 2001; Hart and Holmstrom, 2002). It is easy to reinterpret the model above to allow
for a CEO with a strong vision (or an overconfident CEO). Suppose now that when the CEO is confronted with a project of typel, l∈{G, B},the probability that the CEO believes the project is good ispCEO
l .For the other manager, this probability is stillpl.In this set up, a meaningful way to characterize an overconfident CEO is to assume that pCEO
l > pl for all l. This means that an overconfident CEO is more likely to think that the project is good than the other manager. In this case, the probability of extreme performances (i.e., an outcome of either G or −B) also increases with the CEO’s degree of overconfidence.6 By adding an overconfident CEO to the model, we also
obtain the implication that the degree of overconfidence magnifies the effect of influence power on the variability of performance.7 However, since the sign of the relationship between CEO influence
power and extreme performances does not depend on the specific value of pCEO
l , our hypothesis does not depend on whether the CEO is overconfident or not.
3
Measuring CEO In
fl
uence Power
Our main hypothesis is thatfirms in which the CEO has greater power to influence decisions will have more variable performance. In order to perform our empirical tests, we need to measure how
much decision-making power is concentrated in the hands of the CEO. We do this by trying to
identify whether other individuals at the top of the managerial hierarchy (the “Executive Office”)
are participating in making with the CEO. The higher the number of relevant
decision-makers, the less powerful the CEO is likely to be.
For example, if the CEO is not the Chairman of the Board, we expect him to have less influence over decisions, since the Chairman often has an important role in strategic decision-making. The
6 This result is analogous to the one Van den Steen (2001) derives, that
firms with visionary CEOs have more extreme performances.
7 This is because the effect of overcon
Chairman is frequently an ex-CEO, who retains the title of Chairman during a probationary
‘train-ing’ period for the new CEO. During this period the old CEO passes on relevant information to
the new CEO. Brickley, Coles and Jarrell (1997) also point out that giving an ex-CEO the
Chair-man title eases his transition from active duty to retirement.8 This suggests that upon becoming Chairman, the former CEO still participates in decision-making.9
The CEO succession process of a firm also influences the degree of joint decision-making in the firm to the extent that the successor of the CEO is involved in CEO decision-making prior to becoming CEO. The two most familiar types of CEO succession processes (e.g. Vancil 1987,
Brickley, Coles and Jarrell 1997, Naveen 2000) are horse races, in which the firm conducts a tournament among eligible candidates for the position of CEO, and passing the baton, in which
the firm chooses a designated successor for the CEO.10 In the latter case, a new CEO often also
has the title of President. Once he plans his succession, he hands the title of president to the heir
apparent. If the CEO has an heir apparent then there is a gain to grooming him by involving him
in CEO level decision-making.11 Thus, if the CEO does not also hold the President title, we expect him to have less power to influence decisions.
On the other hand, it is plausible that the candidates for the CEO position will participate
8The management literature also argues that a CEO who is also the Chairman of the board has more discretion
than a CEO who does not hold both posts. For example, Finkelstein and D’Aveni (1994) argue that consolidation of the CEO and the Chairman positions establishes a “unity of command” at the top of thefirm. See Finkelstein and Hambrick (1996) for a survey of the relevant management literature.
9
An example of how an ex-CEO who retains the title of chairman can still have substantial influence over the
firm’s management is documented in Lehn and Treml (2000). The founder of JLG industries, John L. Grove, was replaced in 1991 by L. David Black as the CEO of the company, but retained his position as Chairman. The board determined in 1992 that Grove should withdraw from day-to-day activities and concentrate on board activities, but he continued to have disagreements with the management team and openly expressed his concerns about the state of affairs in thefirm. The leadership conflict culminated with the removal of Grove as chairman in 1993. Even when the Chairman is not an ex-CEO, he may have an important role in decision-making. For example, the Financial Times (November 29th, 2001) reports that the CEO of Ford was obliged to meet regularly with the non-executive Chairman in order to discuss strategy.
1 0
These are probably also the most common types of succession plans. Naveen (2000) finds in a sample of 691 successions of thefirms in the 1991 Forbes compensation survey during 1987-1997 that the CEO was the former President 58% of the time. Canella and Lubatkin (1993)find that over two thirds of the CEOs in their sample were President of theirfirm at the time of their appointment.
1 1
less in CEO decision-making in a horse race than when the CEO passes the baton. If the firm conducts a tournament for the CEO, then it may be difficult to involve all candidates fairly in
CEO decision-making. In addition, involving the candidates in CEO decision-making may have
drawbacks since the losers of the tournament generally leave the firm.12 Thus, we consider CEOs infirms which are passing the baton to be less influential than in firms which conduct horse races for the CEO position.
We also expect the overlap of the Executive Office with the board and the frequent retention
of the CEO title by one of the company’s founders to affect CEOs’ influence in decision-making. Since the board is legally responsible for the management of the corporation, we expect that if an
inside13 manager (other than the CEO) sits on the board, he is more likely to participate in top decision-making.14 Thus, we consider CEOs in firms with more than one inside manager on the
board to have less influence power.15 Moreover, we consider CEOs who are also founders of their firms to have more influence power.
The CEO succession process, the overlap of the Executive Office with the Board and the
reten-tion of the CEO title by a firm’s founder are all interconnected. The heir apparent to the CEO is usually also appointed to the board.16 When the CEO is also one of the founders, the firm is less
1 2 The case of General Electric illustrates both points (Hill, 2000). First, Jack Welch does not describe his own
competition for the CEO position of GE as a very participatory experience: “I had to come to work for three years, and sit with seven other candidates in a dining room and stare at each other.” Second, the two candidates who lost the horse race for Jack Welch’s position in 2001 were expected to leave the firm. Even while the tournament was being conducted Jack Welch was depicted as the primary decision-maker in the media.
1 3 As opposed to managers who are “outsiders”, i.e. they do not work for the firm.
1 4 For example, Finkelstein (1988) asked 444 top managers to rate their in
fluence and the influence of the other managers on strategic decisions within their (102) firms. The average rating for board members was higher than the rating for non-members, even when CEOs were excluded from the analysis. The differences were statistically significant, consistent with the notion that there is a gap between the power of inside board members and other executives.
1 5 One might argue that insiders just rubberstamp CEO decisions, and thus that this measure does not capture an
increase in the number of decision-makers. We do not believe this to be true. In the business literature, there are also many examples offirms in which the President voices his opinion on strategy, often contradicting the CEO’s opinion. See for example the Wall Street Journal on October 26th 2000, for a story involving AT&T’s President John Zeglis and CEO C. Michael Armstrong’s cable strategy. In any case, the presence of rubberstamping will make it harder for us tofind our results.
1 6 The number of candidates in a horse race may be too large to accommodate on the board. For example, the
likely to have a formal CEO succession process. Furthermore, in order to be able to apply some
of our heteroscedasticity tests, we need to rank observations according to one single measure of
CEO influence power. Therefore, we construct a measure which summarizes these aspects of the Executive Office into a single measure of CEO influence power which we call the influence power index (or IP index for short).
We define our influence power index IP as the sum of 5 indicator variables ichair, ipresident,
inocoopres, inoiob,and if ounder. ichair is equal to 1 if the CEO is also the chairman,ipresident is equal
to 1 if the CEO is also the president, inocoopres is equal to 1 if the firm has no president and no COO,inoiobis equal to 1 if there is no other insider on the board other than the CEO andif ounder
is equal to 1 if the CEO is a founder of the company.17
The variable inocoopres is a proxy for the type of succession process in the firm.18 If a firm’s succession process typically consists of a horse race, then the candidates for the CEO position
are more likely to be of equal rank and thus have titles such as Vice President or Executive Vice
President (Naveen, 2000) or, as in the case of Jack Welch’s succession (Hill, 2000), the candidates may have titles associated with different divisions. In this case thefirm will be less likely to have a President or COO, thus the absence of a President or COO is a sign that the CEO may have more
influence power.
Our index essentially consists of three different components that we also analyze separately
later. Thefirst component is related to the CEO succession process, and is the sum of the variables
ichair, ipresident andinocoopres.19 The second and third components are the “no insider on the board” dummy and the founder dummy. These components give additional information about CEO power
that is not directly related to the CEO succession process.
1 7 We do not use a separate indicator variable to designate whether the CEO is also the COO, although in principle
the succession process may occur through the COO instead of through the President, because the CEO is never the COO in our sample.
1 8 This is similar to the argument in Naveen (2000) who classi
fies firms which have a President or COO distinct from the CEO as those with succession plans.
4
Data Description
Our sample consists of data on publicly traded firms in the 1998 Fortune 500 during 1992-1999. We restrict our sample to exclude financial firms and utilities because, as Saunders, Strock and Travlos (1990) point out, the presence of a regulator may affect decision-making in regulatedfirms (in their paper specifically: risk-taking in banks). We further restrict our sample to the set of firms for which data is available on Execucomp (2000). From Standard and Poor’s Execucomp (2000) we obtain information on all executives mentioned in the firms’ executive compensation table as well as financial information. We obtain monthly stock returns for the sample firms as well as value-weighted market returns from CRSP. We gather the remainingfinancial information from Compustat and the date of thefirm’s incorporation from Moody’s Industrial Manuals (1999), proxy statements and annual reports for fiscal 1998. Our final sample consists of 2,633 firm-years of data and 34,158 monthly stock returns for 336firms during the 1992-1999 time period.
The data we gather on executives from Execucomp (2000) consists of 16,022 executive-years of
data for our 336 sample firms during the 1992-1999 time period. This data contains information on whether the named executive sits on the board and the title of each executive. If the named
executive is the CEO, we also obtain the year in which he became CEO and his ownership in
the firm.20 We use the data on executives to construct a data set of firm-years containing CEO
ownership, CEO tenure as CEO and the first 4 indicator variables necessary to construct our
IP index, inoiob, inocoopres, ipresident, ichair. We define inoiob in a given year to be equal to 1 if no executive mentioned in thefirm’s executive compensation table except the CEO sits on the board in that year. Similarly we defineinocoopres to be equal to 1 in a given year if thefirm has neither a President nor a COO amongst the executives mentioned in the compensation table for that year.
According to Regulation S-K of the Securities Act of 1933, the executives described in a firm’s compensation table must include the 4 highest paid executives in the firm other than the CEO.
2 0 In Execucomp the data item containing the proportional ownership of the CEO is often missing if ownership
While it is feasible that other insiders sit on the board or that the President (COO) is not amongst
the top 4 executives in terms of salary, we consider it unlikely. We use the title of the CEO in a
given year to set ipresident (ichair) equal to 1 if the CEO is also the President (Chairman) in that
year.
Since ExecuComp (2000) does not contain information on whether the CEO is also a founder,
we define if ounder in a given year to be 0 if the firm was incorporated at least 64 years prior to the current year or if the current CEO joined the company at least 4 years after the date of the
firm’s incorporation.21 For the remainingfirm-years we checked whether the current CEO was one of thefirm’s founders in a variety of sources consisting of proxy statements, annual reports and the internet.22 We set if ounder in a given year equal to 1 if any source explicitly named the current CEO as a founder or the main executive at the time the company began (including when it was
spun-off).
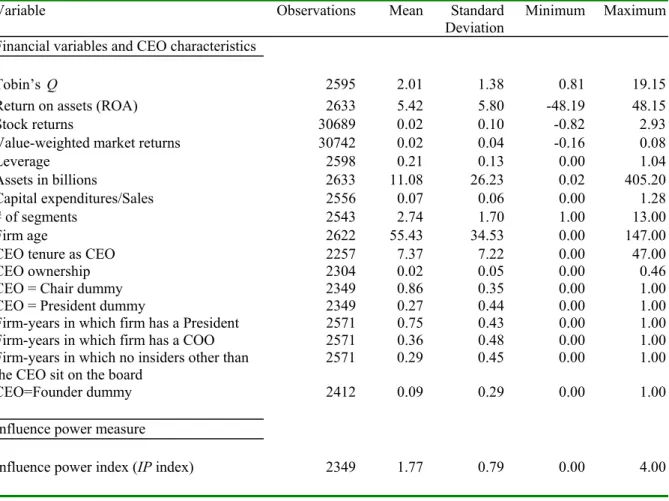
We use three performance measures for our sample firms, Tobin’s Q (Q), return on assets (ROA), and stock returns. Our measure of Tobin’s Q is the ratio of the firm’s market value to its book value. The firm’s market value is calculated as the book value of assets minus the book value of equity plus the market value of equity. We define ROA as the ratio of net income before extraordinary items and discontinued operations to its book value of assets. Stock returns are
monthly stock returns including dividends from CRSP.
In Table 1 we present summary statistics concerning select financial variables, CEO character-istics and our measure of CEO power, theIP index. In mostfirm-years another insider other than the CEO sits on the board (71%). In 23% of thefirm-years there is no President nor COO. CEOs are more likely to accumulate the title of Chair (86%) than the title of President (27%). In 9%
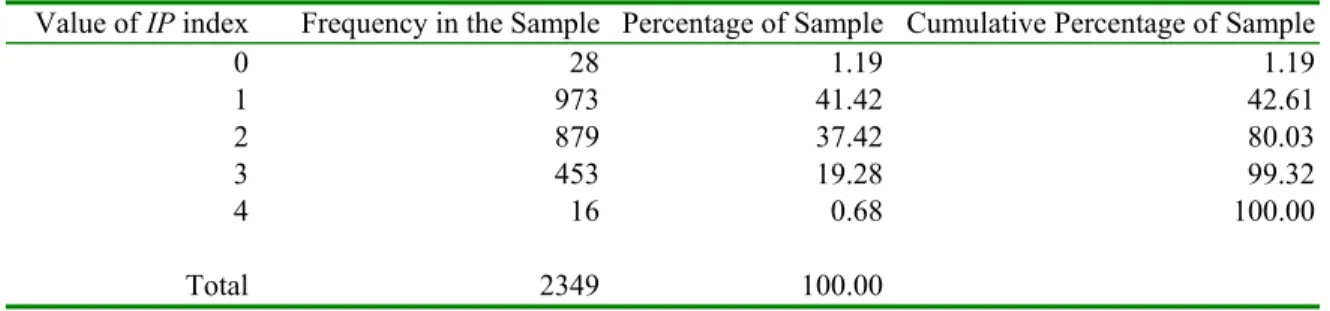
of firm-years the CEO is also one of the founders. Panel A of Table 2 shows that our compilation of this information into theIP index is distributed between 0 and 4, with most values between 1
2 1 The longest period of time a CEO has been working for hisfirm in our sample is 59 years. We use 64 years as a
cutoffto account for missing data on CEOfirm tenure. Since mostfirms are founded several years prior to the date of incorporation this procedure ensures that we check more CEOs than are likely to be founders.
2 2 When we could
and 3, resulting in a mean of 1.77 for the entire sample. Panel B shows the correlations between
the three main components of our index. The correlations are relatively low, indicating that the
components capture different aspects of CEO influence power.
5
Empirical Tests
In this section we test whether our index of CEO influence power (IP index) is positively related to the variability of performance measures. In order to do this we apply several heteroscedasticity
tests to our data, using three different measures of performance (Q, stock returns and ROA). Our hypothesis has implications both for the variability of performance across firms, because firms in which more power is concentrated in the CEO’s hands should have more extreme perfor-mances, and for within-firm variability of performance, because afirm in which the CEO has more influence over decisions should have higher variability in performance over time. Thus we perform our tests using a panel of firms, in which both effects should be present, but we also try to isolate the between-firm and the within-firm effects. We do the former by replicating the same tests we perform for the panel using the averages of all variables from 1992 to 1999. We do the latter (in
section 5.2.3) by regressing the standard deviation of the performance measures over 1992-1999 on
the influence power index and controls.
In what follows, we are primarily concerned with providing evidence of a correlation between
CEO influence power and the variability of performance measures. We postpone the discussion of possible endogeneity problems and causality issues to section 5.3.
5.1
In
fl
uence Power and Performance Levels
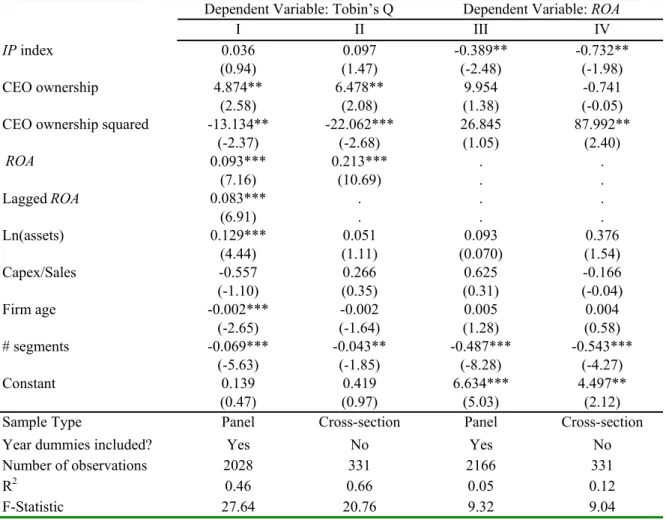
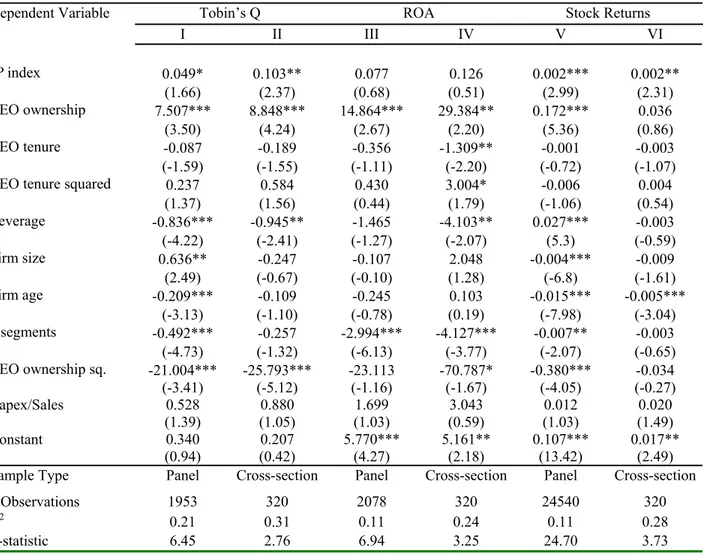
Our heteroscedasticity tests require us to specify a model for Tobin’s Q, ROAand stock returns.
For Tobin’s Q, we estimate a similar model as in Morck, Shleifer and Vishny (1988), Yermack (1996), and Himmelberg, Hubbard and Palia (1999). The main difference is that we include theIP
index among the explanatory variables because influence power may affect average performance, even though we have no prior for the direction of this relationship (see section 2).
growth),firm age (measured by the number of years since the date of incorporation), the number of 2-digit SIC segments (a proxy for diversification) and year dummies (in our panel regressions):
Q = b0+b1IP index+b2CEO ownership+b3(CEO ownership) 2
+b5ROA+b6ROA−1
+b7ln(assets)+b8
Capex
Sales +b9Firm age+b10number of segments+u
Table 3 (columns I and II) shows the output of two different regressions. Column I shows the
results of a panel regression in which everyfirm-year is counted as one observation. Column II shows the results of a cross-sectional regression with the variables averaged over the 1992-99 period. The
coefficients on all variables are broadly consistent with the ones estimated in the previous literature.
The coefficients on theIP index are positive in both regressions but not significantly different from zero at conventional significance levels.
We estimate a similar model forROA, except that we excludeROAas an explanatory variable:
ROA = b0+b1IP index+b2CEO ownership+b3(CEO ownership) 2
+b4ln(assets)
+b5
Capex
Sales +b6Firm age+b7number of segments+u
Table 3 (columns III and IV) displays the results. IP has a significantly negative effect onROA
in both regressions.
Our conclusion from Table 3 is that CEO influence power has an ambiguous effect on per-formance. The effect on Q is positive but not significant. The effect on ROA is negative and significant, suggesting that our measure of influence power may have some detrimental effects on performance. This suggests that the influence power index might be capturing some agency effects. However, when we decompose the index into its three component parts (the succession variable,
thefounder dummy and the no-insider-on-board dummy) and use them as regressors, wefind that what is driving the negative effect of IP on ROA is the variable that indicates that there is no
insider on the board other than the CEO.23 However, based on agency considerations, we would expect this variable to have a positive effect onROA, because it indicates that there are few
in-siders (and therefore possibly more outin-siders) on the board. In sum, the effects of IP on average
performance are not robust across specifications and are not consistent with agency interpretations of influence power.
We refrain from using a multi-factor model for stock returns that would include IP. We use a
simple market model instead, with the market return (value-weighted market return from CRSP)
as the single factor. We use monthly stock returns to estimate our betas and residuals for the
period 1992-1999.
5.2
In
fl
uence Power and Performance Variability
Our finding that influence power has an ambiguous effect on performance is not surprising. The theories we refer to above do not predict a monotonic relationship between CEO influence power and average performance. On the other hand, as we argued in section 2, an increase in the importance
of the CEO in decision-making should lead to extreme performances. Figure 1 presents some
descriptive evidence which is consistent with this hypothesis. We plot the Tobin’sQresiduals from the cross-sectional regressions for the firms with the highest 20% and the lowest 20% values of the influence power index. The cross-sectional variability of performance is clearly higher in the sample in which influence power is high. We now turn to formal tests of our hypothesis using some standard heteroscedasticity tests.
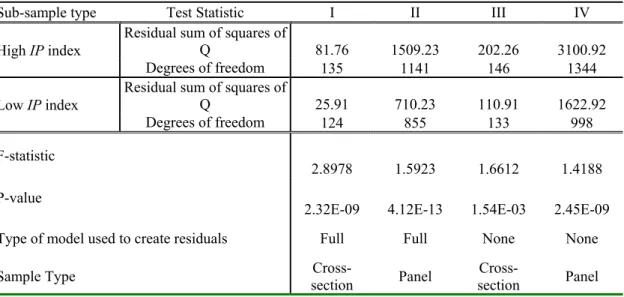
5.2.1 Goldfeld-Quandt Heteroscedasticity Tests
In this section, we apply the Goldfeld-Quandt (1965) heteroscedasticity test to our data.24 This requires us to divide our sample into two groups offirms: one in which there is a high concentration of power in CEOs’ hands (highIP) and one in which there is low concentration of power in CEOs’ hands (low IP). We then apply our empirical models forQ, ROAand stock returns to each
sub-sample separately. The tests are based on the residuals of these “first stage” regressions. We focus first on the models that we have specified in the previous section, but we also perform the tests using the raw variables. The reason for this is to check that the results are not too dependent on our
specification of the models for the performance variables. In the latter case, the Goldfeld-Quandt test collapses into a standard test of comparing variances between two different samples.
Since the median of the IP index is 2, we define the low-IP sub-sample in our panel sample as the one containing observations withIP indices of 0 and 1 and the high-IP sub-sample as the one withIP indices ranging from 2 to 4. In our cross-sectional sample, IP indices are averages over 8
years and thus not necessarily integer valued. In that case, we use the medianIP value of 1.75 as the cut-offpoint.25
Using the residuals from the two separate regressions for each performance measure, we compute
the sum of the squares of the residuals (RSS) for each group. Under the assumption of normality of
these residuals, the ratio of theRSSof thefirst group to theRSSof the second group should follow anF−distribution withn1−kandn2−kdegrees of freedom of the numerator and the denominator,
respectively, where ni is the number of observations in group i, i = 1,2, and k is the number of regressors. Therefore, to test the null hypothesis of homoscedasticity against the alternative that
firms with more concentration of power in CEOs’ hands have greater variance in their performance measures than ones in which CEOs have limited discretion, we create an F−statistic by dividing
(RSS/n1−k) for the first group by the (RSS/n2−k) of the second group and compare it with
critical values fromF-tables with the appropriate degrees of freedom. AnF−statistic greater than
1 is evidence against the null and in favor of the hypothesis of greater variance when CEOs are
more powerful.
The results (reported in Table 4, panels A, B and C) are consistent with this hypothesis. In
both the cross-section and the panel samples, and for all the three performance measures, the
F−statistics are greater than one and almost always highly significant, with virtually zerop-values. The only exception occurs in column I in panel B, where the F-statistic, although greater than
one, is not significant at conventional confidence levels.
The results appear to be robust not only across different measures offirm performance, but also across different specifications (raw variables vs. residuals from regressions; cross-section vs. panel samples). The difference in variances also appears to be economically significant. For example, if we look at panel A, the implied ratio of variances goes from 1.42 to 2.90.26 This implies that the
2 5 In this case, we omit a range of intermediate values (all observations for which the I P index lies on an open
interval of length0.5centered on our cutoffpoint of1.75), as is standard in Goldfeld-Quandt tests.
2 6
standard deviation of Tobin’s Q is higher in the sample of firms with more powerful CEOs by a factor varying from 20% to 70%.
5.2.2 Tests Based on Regressions
One of the weaknesses of the tests in the previous subsection is that observations can only be
ranked by one variable at a time. Therefore, we cannot test whether CEO influence power affects performance variability after controlling for other variables that might also affect the variance of
performance.
For example, Amihud and Lev (1981) explain differences in the variability of performance by
appealing to an agency argument. They argue that firms with disperse ownership (firms with more severe agency problems) engage in more conglomerate acquisitions in order to reduce risk,
even when this is not optimal for shareholders. If the CEO has higher ownership, he will have less
incentives to reduce risk (see also Agrawal and Mandelker, 1987, and Saunders, Strock and Travlos,
1990). This could induce a positive correlation between managerial ownership and variability in
performance. To ensure that our measure of influence power is not capturing this agency effect, we need to be able to control for CEO ownership.
Another possibility is that our index simply reflects the degree of diversification. Firms with more segments may need more people making decisions, and thus appear to have more dispersion
in decision-making power. Suchfirms may also have less variability because of the direct effects of diversification. Thus, diversification could generate a spurious positive correlation between influence power and variability.
In order to control for these and other possible determinants of performance variability, we apply
Glejser’s heteroscedasticity test to our sample.27 To conduct the Glejser test, we regress the absolute value of the residuals ubi from our empirical models for each of the three performance measures on
the CEOs’ influence power index IPi and on a vector of controls zi which we hypothesize should be associated with the variability infirm performance:
|ubi|=α+βIPi+θzi+ei (1)
An F-test of the hypothesis that all slopes equal zero is a test of the null hypothesis of
ho-moscedasticity against the alternative that the variance offirm performance is a function of(IPi,zi). To test whether influence power alone positively affects the variance of firm performance, we use a t-test for the null that the coefficient β ≤0 against the alternative β > 0. High t-statistics are evidence that influence power is positively related to the variance offirm performance.
Our benchmark vector of controlszincludes CEO ownership (to control for the agency argument
described in Amihud and Lev, 1981) and its square, the degree of diversification (the number of different two-digit SIC segment codes), firm size (natural log of assets),firm age (number of years since date of incorporation), leverage (book value of long term debt divided by book assets), CEO
tenure (the number of years since the CEO was appointed CEO) and its square, capital expenditures
over sales and two-digit-SIC industry dummies:
|ub| = a0+a1IP index+a2CEO ownership+a3(CEO ownership) 2
+a4CEO tenure (2)
+a5(CEO tenure) 2
+a6leverage+a7ln(assets)+a8Firm age
+a9number of segments+a10capex/sales+industry dummies+e
We expect bigger and olderfirms to exhibit less variability in performance. We include leverage because of the evidence that leverage is negatively correlated with variability (see Harris and Raviv,
1991). We include the tenure variables to control for life-cycle learning or signalling effects (see
May, 1995 and Prendergast and Stole, 1996), and the industry dummies to control for the fact
that some industries might be inherently more volatile than others. We also include any additional
variables that we used in the first-stage regression to construct the residuals, because variables which affect average performance could also affect the variance of performance.
In Table 5 we report the results of regression (2) for the three performance measures and for
each type of sample, the panel and the cross-section. The panel regressions include year dummies.
We do not use firm fixed-effects in our panel specification, because our influence index does not vary much over time for a given firm (the change in the index for the same firm from one year to the next one is zero approximately 80% of the time).28 In addition, we expect differences in
2 8
variability to be more systematically related to industry, which we control for. We always use
heteroscedasticity-corrected standard errors when calculating ourt-statistics, since the residuals of these regressions are heteroscedastic by construction.29
The null of homoscedasticity is always easily rejected against the alternative that the variance of
firm performance is a function of(IPi,zi), as evidenced by the largeF-statistics (the corresponding
p-values, which we do not report, are virtually zero). More importantly, in all six cases reported in Table 5 the coefficient on IP is positive, indicating that more influence power is associated with greater variance in firm performance.
Columns I and II display the results for Q. IP enters positively and is significant at 10% and 5% in the panel and cross-sectional samples, respectively. Columns III and IV display the results
forROA. AlthoughIP enters positively, as expected, it is not significant at any conventional levels. To perform the Glejser test using stock returns we use the residual returns from the market
model with the market return (value-weighted market return from CRSP) as the single factor.30 We
use monthly stock returns to estimate our betas and residuals for the period 1992-1999. As in the
tests with Qand ROA,we use both a cross-sectional and a panel sample of residuals. To perform
the panel tests we construct the residuals for eachfirm-month as the difference between the stock return for the firm in that month, and the market return multiplied by thefirm’s beta. Thus, the firm’s residual return is the component of performance which cannot be explained by the market model (abnormal performance). Our hypothesis is that the variability in abnormal performance
increases with influence power. Since we use monthly data for stock returns and annual data for the controls, we adjust the t-statistics for non-independence within firm-year. To perform the cross-sectional tests we calculate the residual as the difference between thefirm’s average stock return in the time period, and the average market return multiplied by the firm’s beta.
fixed effects in regressions which relate ownership tofirm performance. However, Zhou (2001) points out that if the explanatory variable changes slowly over time (as do ownership and influence power), firmfixed-effect regressions may fail to detect relationships in the data even when they exist.
2 9 The residuals(e
i) of these regression have the following three features: (1) they have non-zero expected value, (2) they are autocorrelated and (3) they are heteroscedastic. Amemiya (1977) shows that, asymptotically, thefirst two problems vanish (see also Amemiya, 1985). To correct for heteroscedasticity, Greene (1993) suggests using the asymptotically corrected covariance matrix of White.
Columns V and VI display the results for stock returns. IP enters positively and is significant at 1% and 5% in the panel and cross-sectional samples, respectively.
In general, the results of these tests corroborate our previous findings that IP is positively related to the variance of firm performance, both cross-sectionally and in the panel sample. In addition, the tests performed in this section allow us to control for other possible determinants
of variance in firm performance. For example, even after controlling for CEO ownership, CEO influence power is still related to the variability infirm performance. This implies that the influence power index is not simply capturing the particular agency problem emphasized in Amihud and
Lev (1981), Agrawal and Mandelker (1987), and Saunders, Strock and Travlos (1990). Similarly,
the correlation between the IP index and performance variability does not seem to be driven by diversification and otherfirm characteristics such as age and size.
The economic significance of the coefficient on influence power also appears to be large, as compared to the coefficients on these other variables. Consider, for example, the results for stock
returns. In column V, the coefficient on the influence power index indicates that one less title for the CEO is equivalent to an increase of 20 years offirm age or to 3 additional segments. Given that firm age and diversification are plausible determinants of volatility, it is striking that our measure of CEO influence over decisions seems to have effects that are as large as the ones resulting from large changes in firm age and in the number of business segments.31
Finally, an additional benefit of using a regression-based heteroscedasticity test is that we can estimate the individual impact of each component of our influence power index on the variance of performance. This was not possible in the Goldfeld-Quandt approach, because it requires the
observations to be ranked according to one single measure. One of the main reasons why we decided
to construct an influence power index was that we wanted to apply the Goldfeld-Quandt test, which is a very powerful and widely used heteroscedasticity test. The regression-based approach of this
section has a less general alternative hypothesis than the Goldfeld-Quandt test, but it allows the
pattern of heteroscedasticity to depend on multiple variables.
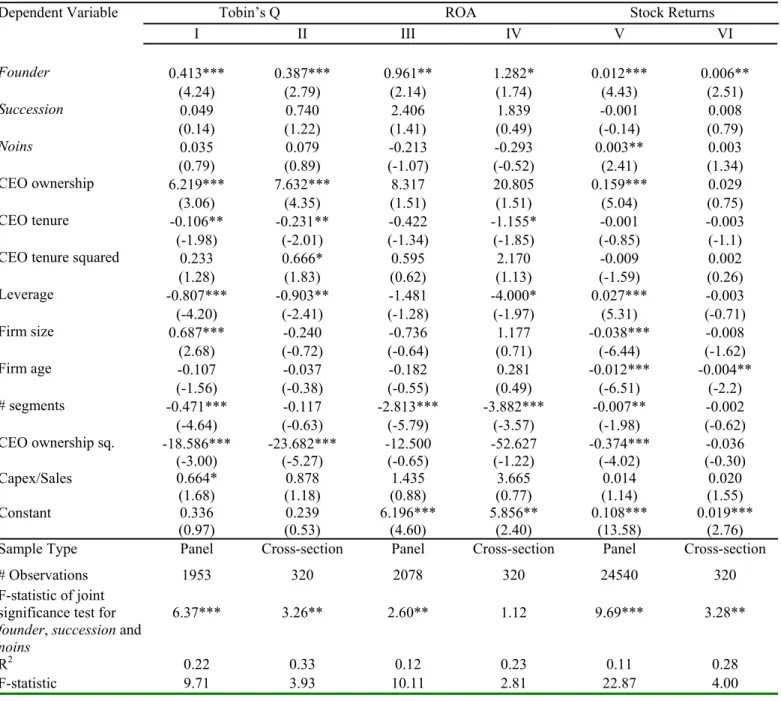
In Table 6 we replicate the previous tests using the three individual components of influence
3 1 The large economic signi
power (the founder indicator, the succession variable and the no-insider-on-the-board indicator
(noins)) instead of theIP index. First, we note that the three variables are always jointly significant at 5%, except in the cross-sectional test using ROA, as evidenced by the F-tests reported in that
table. Columns I and II display the results for Q. All three variables consistently enter positively in the regressions explaining the variance of Q, but only founder is significant. Columns III and IV display the results for ROA. As before, the results are less compelling for the ROA variable. The only significant variable is again founder, but only in the panel sample. Succession enters positively in both cases, while noins enters negatively in columns III and IV, but they are never
significantly different from zero. Columns V and VI display the results for stock returns. Founder enters positively and significantly in both cases. Noins is significantly positive in column V and still positive but not significant in column VI. Succession is not significant in either case.
We conclude that, at least for the tests in this section, the retention of the CEO title by one
of the founders is the most significant variable affecting the variability of performance, followed by the absence of insiders other than the CEO on the board. The succession variable alone does not
play a significant role.
5.2.3 Influence Power and Variability Over Time
In this section, we estimate the effect of influence power on within-firm variability of performance. We compute the sample standard deviation ofQ,ROAand stock returns for eachfirm using their yearly values from 1992 to 1999. We also use the standard deviation of the firm-specific stock returns (the residuals from the market model) as a dependent variable, as in Saunders, Strock
and Travlos (1990). Then, we regress the standard deviations on the possible determinants of
variability.32 We use the same set of controls as in equation 2. The data for the regressors are
averages over the whole period (1992-1999).
Table 7 shows the results. In the regression for Q (column I), IP enters positively, but is not
significantly different from zero at conventional levels. The coefficient on the influence power index in the regressions for ROAand stock returns, however, are positive and significant at 1%. This is consistent with the idea that stock returns andROAare more volatile over time than Q, and that
this volatility is positively affected by a CEO’s control over key decisions. The other coefficients
also have the expected signs. Larger, older and more diversified firms tend to have lower variability in performance. Furthermore, higher CEO ownership is positively correlated with variability.
Table 7 allows us to easily evaluate the economic significance of the effect of influence power on within-firm variability in performance. For example, one additional title for the CEO (an increase of one in our index, which is a little more than a one-standard-deviation-change according to Table
1) increases the standard deviation of residual stock returns by approximately 0.006. This has an
effect equivalent to 30 fewer years offirm age.33
In Table 8 we investigate the individual effects of each of the three components of our influence power index. Thefounder variable is the only one of the three that significantly affects within-firm variability in Tobin’s Q. In the ROAregression, however, all three variables enter positively and
significantly. In both regressions for stock returns, all three variables enter positively, but again only founder seems to be consistently significant.
We conclude that the retention of the CEO title by the one of the founders seems again to be
the most significant variable affecting the within-firm variability of performance, but the results of this subsection suggest a much more balanced role of founder, noins and succession in explaining
within-firm over-time variability in performance.
5.3
Endogeneity and Causality Issues
There appears to be a robust positive correlation between the degree to which a CEO is influential in hisfirm’s key decisions, as measured by our influence power index, and the variability in measures offirm performance. Our empirical investigation was motivated by the idea that the more latitude in decision-making a CEO has, the greater the impact of his own views on corporate performance.
The evidence we have presented is consistent with this view. However, it could also be consistent
with alternative stories that emphasize the reverse causation: more variability in performance may
lead to increases in CEO influence power.
3 3 Similar results hold when we use ROA instead, or Tobin’s Q (even though the effect on the latter is not
It is possible that causation runs in both ways. However, our goal in this paper is to emphasize
one specific direction: more influence power leading to more variability in performance. In this section, we address the potential endogeneity problem in two different but complementary ways.
First, we try to assess how much past variability in performance helps predict future changes in
influence power in subsection 5.3.1. We also estimate how much changes in past influence power help predict future variability in performance. Prediction does not imply causality, but in many
cases (and under additional assumptions) causality implies prediction. Therefore, failure to detect
predictive power of a variable x with respect to y can be interpreted as a weakness of the causal link fromx toy. Second, even if we accept that there might be a causal link from x toy, it could
still be possible to empirically isolate the effect of y on x. In subsection 5.3.2, we use instrumental variables methods to try to isolate the effects of influence power on performance variability from other sources of variation.
Even though it may not be possible to establish causation with certainty, we believe that the
evidence presented in this section is consistent with a causation relation from influence power to performance variability.
5.3.1 Does Performance Predict Influence Power?
Most reverse causality stories that have been suggested to us are very similar and can be summarized
as follows. On the one hand, iffirms have performed extremely well in the past, it might be easier for CEOs to force changes that increase their influence power. This assumes that CEOs value independence and enjoy being influential. Also, it assumes either that governance mechanisms become weak when firms perform well or that extremely good performances are signals of high CEO talent, justifying increases in CEO influence power. On the other hand, following poor performance,firms may want to purposefully concentrate decision-making power in the hands of a few managers in order to make fast and radical decisions. This argument could explain ourfinding, since the best and the worst performers tend to be in the sample of volatilefirms.
We explore the explicit temporal dimension of these stories to assess their empirical relevance.
We focus on stock returns in this section, for a very simple reason: past returns are poor predictors
of past performance on current changes in influence power from the contemporaneous correlation between these two variables.
We create a dummy variable calledextreme that equals 1 for either very high or very low values
of stock returns and is zero otherwise. More specifically, we define high performance as a value for the stock return that ranks among the highest 15% returns for all observations in our sample.
Similarly, low performance occurs when the value for the stock return ranks among the lowest 15%.
Our dummy variable equals zero for all other intermediate values (70% of the sample).
We want to check whether past extreme performance predicts changes in our influence power index. If either very high or very low performances lead to more concentration of power in the
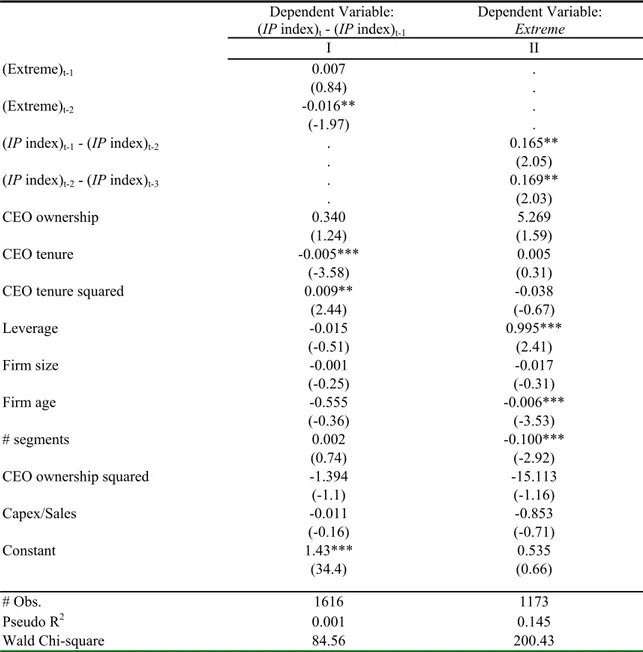
CEO’s hands, laggedextreme should be positively correlated with current changes in theIP index. Since changes in the IP variable are count data, we run a Poisson regression of changes in the
IP index on thefirst and second lags ofextreme and the same controls we have used in the previous tests.34 Column I in Table 9 displays the results. The coefficient on the variableextreme
−1 is not
significant. Extreme−2 enters significantly but negatively, which suggests that, if anything, past
extreme performances, either good or bad, tend toreduce CEO influence power over decisions. We also do the reverse experiment: Do changes in influence power help predict either very high or very low performances? We run a Probit regression to estimate how past changes in influence power affect the probability of having extremely good or bad performances. Notice that we focus
on changes and not levels of IP. The levels of IP within firms are highly autocorrelated and we already know from previous tests that current IP levels are correlated with current performance variability. Therefore, this test is substantially different from the ones in the previous sections,
because we are controlling for afirm-specific effect on influence power.
Column II in table 9 displays the results for this Probit. Both first and second lags of changes in influence power enter the regression positively and significantly at 5%. Past positive changes in influence power appear to increase the probability of either very good or very bad performances.
The conclusions from these tests are clear. Past increases in influence power increase the likelihood of future extreme performances, which is consistent with the hypothesis that influence
3 4 The Poisson regression assumes that the dependent variable is a nonnegative integer. Since changes inI P may
power affects performance variability. Past extreme performances, if anything, reduce the likelihood
of future increases in influence power. This finding casts doubt on theories that try to explain the positive correlation between influence power and performance variability by postulating causation from variability to influence power.
5.3.2 Instrumental Variables
In this section we use instrumental variables methods to try to isolate the effects of influence power on performance variability from other sources of variation. Because instrumental variable techniques
are most directly applicable to them, we focus here on the cross-sectional regressions of performance
variability on measures of CEO influence power in section 5.2.3. Since the influence power index is a combination of different components, it is difficult tofind good instruments for it. An arguably good instrument for one component may not seem to be a good instrument for a different one.
Therefore, we focused on finding instruments for the (empirically) most important component of the IP index, the founder variable. In the appendix we discuss in detail how we construct our instruments. Here we focus first on discussing the validity of three different variables that we use as instruments: founder age, dead founders and number of founders and then on describing the
results of our IV regressions.
Founder Age The first variable we use as an instrument is the current age of the founder (if there are multiple founders, we use the average age among them). Older founders are more likely
to be close to retirement and therefore less likely to still work as the CEO of theirfirms. Therefore, this variable should meet the first criterion for a valid instrument, that it is correlated with the founder variable (a dummy variable that equals1 if the current CEO is one of the founders).
However, to be a good instrument founder age must also be uncorrelated with performance
volatility except through explanatory variables contained in the second stage regression. We find it unlikely that current founder age is caused by performance volatility. Its main determinants are
we are dealing with in this paper could be easily forecasted before the firm is founded. Future founders may know that some industries are riskier than others which may affect their perceptions
of the risks involved in founding a new firm. However, this type of predictable industry-specific risk should be captured by our industry dummies.
In addition, founder age is unlikely to have a direct effect on performance variability. It is
true that young founders are usually found in young firms, which are more likely to have volatile performances. However, this is an effect of the age of the firm and not of the age of the founder which we control for by includingfirm age in all of our tests. The quality of our instrument could also be affected if founder age is correlated with risk preferences. However, wefind it unlikely that differences in risk aversion between young and old CEOs can explain most of their differences in
defining their corporate strategies. Managers that have more of their human capital tied to the firm may be more conservative, but this effect is better captured by their tenure in thefirm, which we control for in addition to its square, than by their age. Finally, most CEOs in our sample are
over 50 years old. Purely behavioral differences in risk attitudes between people of 50 or 60 years
of age are not likely to be large.
Dead Founders The second variable we use as an instrument is a dummy variable that takes the value of1 if the founder died before the start of our sample period and zero otherwise (if there
are multiple founders, we take the average of this variable among all founders). The motivation
for this instrument is the same as for the age of the founder: dead founders cannot be CEOs. The
main reason why we use this variable instead of using founder age is because it is less likely to
be correlated with founder risk preferences than founder age. Living founders can be young or
old, therefore this variable should not be correlated with risk aversion. The death of a founder
should be a fairly exogenous event which will affect the likelihood that the current CEO is one of
the founders but does not have a plausible direct effect on performance volatility, except when the
founder happens to be the CEO.
valid instrument. First, the probability that the current CEO is one of the founders is mechanically
increasing in the number of founders, although since one founder often plays a more dominant
role than the others we expect this correlation to be weaker than in the case of the other two
instruments.35 Second, it should be fairly exogenous in our set-up. In particular, the number of founders is unlikely to have any direct effect on the variability offirm performance years after the founding event.
Results of IV Regressions Using one instrument at a time, we attempt to control for endogene-ity in the regressions in section 5.2.3, except that we use the founder variable as our sole measure
of CEO influence power. The dependent variables are the sample standard deviations of Q,ROA, stock returns and residual stock returns for eachfirm using their yearly values from 1992 to 1999. The data for the regressors are averages over the whole period (1992-1999).
Table 10 shows the outcomes of the first-stage regressions. The dependent variable is founder in all three columns. In Column I, the first regressor is the founder age as of 1994.36 In Column II, thefirst regressor is an indicator function that takes the value of1when the founder is dead as of 1992.37 In Column III, thefirst regressor is the number of founders for eachfirm.
From Table 10 we see that the proposed instruments appear to be reasonably strongly correlated
withfounder. Furthermore, the correlations are all significant at greater than the 5% level and have the expected signs.
In Table 11 we show the outcomes of the second-stage regressions using the three different
3 5 The case of Arrow Electronics illustrates how the number of founders may in
fluence whether or not the current CEO is a founder (see Hoovers 2002, Fortune, January 12, 1981, p. 19 and The New York Times, December 6, 1980, p. 26). In 1968 three friends led a group of investors in acquiring a then obscure company called Arrow Electronics Corporation. After merging it with another company, they used it to found what is now one of the largest distributors of electronic components in the country. One of the partners, Duke Glenn, Jr., was the Chairman and CEO. The other two were Executive Vice-Presidents. In 1980 a hotel fire killed 13 members of Arrow’s senior management including the founder/CEO and another founder. The remaining founder, John Waddell, was immediately named acting CEO and remained CEO with only brief interruptions until 1986. Although Waddell’s primary responsibilities were in corporate administration and communications before thefire, the crisis led the board to choose him as acting CEO because he was one of the original founders.
3 6 When there are multiple founders, the value used is the average age among them. When founders are dead as
of 1994, we arbitrarily assign the age of 95 years to them. See the appendix for more details.
3 7 If there are multiple founders, we take the average of this variable among all founders. Thus this measures the