Sustainability for a real innovative world
The impact of innovation on the relationship between corporate social
responsibility and financial performance: A temporal contingency perspective.
Paul Richter (22625)
A Project carried out on the Master in Management Program, under the supervision of: Miguel Alves Martins
“Sanpo-yoshiis an old Japanese merchant’s principlewhich translates as “good for three
parties,” here meaning the seller, the buyer, and society. Broken down, sanpo refers to the urite
First of all, I would like to thank both my supervisors at Maastricht University and Nova School
of Business and Economics. In Maastricht, Drs. Bas van Diepen who provided me with helpful
guidance throughout the development of this thesis steering me in the right direction whenever I
needed it. Assistant Professor Miguel Alves Martins who provided me with valuable insights on
the topic of value creation and sustainable companies despite the long-distance to Lisbon.
I also must express my gratitude to my parents who supported me unfailingly throughout the
rocky years of my study. I would like to acknowledge my grandparents who made it possible for
me to attend Maastricht University and Nova SBE. Nonetheless, I want to thank Cathe for her
continuous encouragement in the many periods of doubt and despair. Thank you.
Finally, big props must be given to the several YouTubers who helped me to master SPSS and
Despite the vast research on the link between corporate social responsibility (CSR) and financial
performance (CFP), little is known about long-term implications. The overall research consensus
points toward a positive relationship taking a short-term perspective. However, this study argues
that CSR activities require time until the company can reap benefits from their social and
environmental involvement. Moreover, this work sheds light on this link by including innovation
activities as a mediator. It argues that companies can utilize the full potential of CSR by
complementary investments in both CSR and innovation. A CSR score for the period from 2006
to 2011 with data provided by KLD was calculated. Additionally, data from Compustat was used
to create short-term (2012) and long-term (2013-2015) financial performance indicator, as well
as, an innovation activity indicator. The sample consists of 297 U.S. publicly traded firms. The
results provide evidence that CSR takes effect in the long-term but not in the short-term. On the
other hand, innovation improves financial performance in the short- and long-term. Another
outcome from the study shows that there exists a sequential relationship between CSR,
innovation and CFP. It implies that CSR should be considered an integral part of strategy
development since it pays off financially in the long-run. Innovation may be an important driver
in the development of specific skills and capabilities which helps to translate positive social and
environmental performance into superior financial performance. In the future, companies are
advised to invest in mutual value creation with stakeholders, stressing the importance of its
stakeholders and society at large. By creating mutual value, companies are allowed to satisfy
societal needs while exploiting business opportunities.
Keywords: Corporate social responsibility, corporate financial performance, innovation,
1. Introduction ... 1
2. The business case of corporate social responsibility ... 9
2.1 Corporate social responsibility and instrumental stakeholder theory ... 9
2.2 Corporate social responsibility and corporate financial performance ... 11
2.3 Innovation and corporate financial performance ... 15
2.4 The interaction of innovation with CSR and its effect on CFP ... 16
2.5 Complete Research Model ... 18
3. Research methods and design ... 19
3.1 Sampling data and sources ... 19
3.2 Dependent variable ... 20
3.3 Independent variable ... 21
3.4 Mediating variable ... 22
3.5 Control variables ... 22
3.6 Overview of variables per Hypothesis ... 23
3.7 Analysis Plan ... 24
3.8 Wrap-up ... 24
4. Analysis and Results ... 25
4.1 Descriptive Statistics ... 25
4.1.1 The sample ... 25
4.2 Assumptions of regression analysis ... 26
4.2.1 Assumption of normality: Univariate analysis ... 26
4.2.2 Assumption of homogeneity ... 28
4.3 The correlation analysis: Bivariate Analysis ... 29
4.4 Regression analyses: Testing the hypotheses ... 30
4.5 Comparing short-term CFP and long-term CFP results ... 36
4.6 Post-hoc tests: Reassessing the assumptions ... 36
4.7 Wrap-Up ... 37
5. Discussion of the Findings ... 38
5.1 Implications ... 40
5.2 Limitations ... 46
5.3 Conclusion ... 47
6. References ... 49
7. Appendix ... 55
7.1 Appendix A: KLD dimensions ... 55
7.2 Appendix B: Distribution of variables ... 56
7.3 Appendix C: Spearman’s Rho ... 58
1 1. Introduction
In the history of human development, resource exploitation has been recognised as the
fundamental element for societal improvement. Today’s world is characterized by a growing global population that seeks for improved living conditions while exploiting the earth’s finite
resources. Last year the Global Footprint Network (2016) reported that, if the world’s population
continues to consume natural resources at the current rate, 1.6 planets are required to meet the
global annual natural resource demands. In many cases, environmental problems are intertwined
with social challenges. More specifically, by damaging the environment through increased
pollution and deforestation, as well as, natural resources exploitation from underdeveloped or
developing regions of the world, consequences such as illness poverty and hunger have been
identified, leading to overall reduced living opportunities for many worldwide populations.
(WWF, 2016). In 1987, the World Commission on Environment and Development (WCED)
recognized these societal and environmental consequences providing a necessary normative
definition of sustainability. The commission defined sustainability as “development that meets
the needs of the present generation without compromising the ability of future generations to meet their needs” (United Nations General Assembly, 1987).Accordingly, in the resulting report
Our Common Future (1987), proposed the concept of sustainable development relating economic
aspects of sustainability to social and ecological consequences necessary due to growing global
economy. In other words, sustainability describes the long-term objective while sustainable
development comprises of the means to achieve this goal. The latter issue has received increased
considerable critical attention, over the years. Hence, the question arises, how can businesses play
an active role in contributing to sustainable development balancing their going concern while
2
world’s gross domestic product (UNCTAD, 2000). Ergo, they hold a responsibility towards
society and assume a key role in contributing to their stakeholders. Considering their
technological advantages, resources and global reach transnationally operating firms are well
equipped to play at the forefront of sustainable development (Hart, 2010).
The integration of social and environmental aspects into corporate activities aimed at
sustainability, referred to as corporate social responsibility (CSR), has become increasingly more
important within business organizations. Recent evidence suggests that, within many business
organizations, sustainability activities are no longer mere compliance matter and a “nice-to-have”
add-on. Nowadays, companies become more proactive in responding to societal demands of
sustainability (Hatch and Mirvis, 2010). Organizations have recognized the inherent long-term
strategic dimension of sustainability and pursue business models of value creation and win-win
scenarios of shared value – for the company, for its stakeholders and society at large (Porter and
Kramer, 2011).
A considerable amount of management literature has been published on the matter. These studies
have noticed that 75% of CEOs agree that responding and satisfying a wide scope of stakeholder
needs, together with preserving the needs of future generations, is important (PwC, 2014).
According to the McKinsey’s Global Sustainability Survey (2011), a few firms strongly focus on
sustainability and derive substantial value by taking a long-term strategic stance and by viewing
sustainability elements as a starting point. Successful companies integrate sustainability in crucial
value creation activities, adapting their processes accordingly. The study (McKinsey, 2011),
discovered that companies can reap benefits from integrating social and environmental
sustainability aspects in their business model by focusing on three main areas: return on capital
3
step further, are Benefit-Corporations or firms focusing on circular economy, which
institutionalized sustainability and consider environmental and social responsible activities as the
driver of their profitability and growth.
Moving on to a business case perspective which applies to the arguments that support the
rationale why businesses should foster activities around CSR (Carroll & Shabana, 2010). There
are several ways to describe the concept of sustainability as well as the fundamental related term
of corporate social responsibility (CSR). The most suitable definition in the analysis of the
company has been put forward by Carroll (1991). The author contributes by specifying the
economic responsibility of the firm in the sustainability and CSR framework: “The social
responsibility of business encompasses the economic, legal, ethical and philanthropic
expectations that society has of organizations at a given point in time” (Carroll, 1991; p.560). By
providing goods and services, businesses not only follow their profit-generating mission but also
share wealth with society, including the voluntary recognition of stakeholder concerns both internal and external to the firm’s operations. Following an instrumental stakeholder approach,
stakeholder-regarded behaviour must create outcomes that are valuable for them in order to
enhance firm performance (Jones, 1995). On an institutional level, predictors of CSR are
examined within two broad dimensions: stakeholder pressure and regulations and standards.
Stakeholder pressure aims to convince the firm to engage in CSR through stakeholder actions.
Different roles are apparent, such as, customers who exert influence through their evaluations,
product purchases, monitoring and sanctions. Firms are pressured by stakeholders facing impacts
of potential revenues and detrimental effects of corporate reputation. Additionally, regulation
present standards and certifications are further incentives for firms to adopt CSR strategies.
4
since firms attempt to merely meet the minimum given sustainability requirements (Aguinis &
Glavas, 2012).
Turning to an organizational level of analysis, firms engage in CSR for two reasons. The first motive stems from normative reasoning anchoring elements of CSR in the company’s values and
vision. Some companies feel the responsibility towards society following a sense of stewardship.
Secondly, purely instrumental reasons are present aiming at improved financial outcomes
(Aguinis & Glavas, 2012). Nevertheless, the latter, has been found in an on-going debate on
whether CSR activities pay off financially for the firm (Vance, 1975; Griffin & Mahon, 1997;
Roman et al., 1999; Margolis & Walsh, 2003; Orlitzky et al., 2003). Up to now, Vance (1975),
has investigated the relationship between CSR and corporate financial performance (CFP), based on the assumption that CSR activities deviate from the firm’s core responsibility of generating
profits for its shareholders, discovering a negative relationship. On the contrary, Margolis and
Walsh (2003) conducted a meta-analysis reviewing 127 empirical studies identifying a link
between CSR and CFP. The authors concluded that the findings suggest the existence of a
positive association between the two variables while the evidence for a negative correlation is
little. Further evidence is provided by Orlitzky et al. (2003). The authors’ meta-analysis assessed
52 empirical studies and reported that social, as well as, environmental responsibility pay off
financially. Concluding, most studies provide evidence for the existence of a positive relationship
between corporate social responsibility (CSR) and firm performance. It remains vague whether
CSR positively influences the financial performance of the firm. These ambiguous results can be
attributed to methodological differences and misspecifications (McWilliams and Siegel, 2000).
Next to financial benefits, CSR activities have external and internal positive effects which are
5
Research has shown several external effects for the firm that impact the relationship between
CSR and CFP. A positive corporate reputation fosters the relationship to external stakeholders,
such as customers, communities, investors and society at large. This is important since it
determines whether the constituents either grant or withhold support (Gray and Balmer, 1998).
More specifically, customers derive higher satisfaction from a product or service that is sourced
and produced socially and environmentally sustainable because of their membership to society
and their consequent responsibility to it (Luo & Bhattacharya, 2006). Subsequently, CSR
activities can lead to increased revenues because of their positive and improved reputation from
satisfied customers (Weber, 2008). Moreover, CSR is beneficial for lower capital constraints. As
a matter of fact, Cheng et al. (2014) found that improved stakeholder engagement and
transparency with regard to CSR performance are important drivers to lower the access barrier to
finance. This is due to the reduced agency costs and informational asymmetry. By being able to
convince the public eye that the company aims to improve social and environmental standards,
less monitoring and more flexible regulations may follow (Kramer & Pfitzer, 2016).
On the other hand, speaking of the internal effects, companies that are perceived to be socially
and environmentally responsible is able to attract larger volumes of job applicants. This allows
companies to select among the most qualified workforce and fruit from their knowledge and
innovative input (Greening and Turban, 2000). Additionally, a workforce that identifies with the
values of the company increases the likelihood that the employees identify opportunities that
contribute to the value creation of the company (Korshun, Bhattacharya and Swain, 2014). Thus,
aligning company culture with employee attitudes can be a source of a competitive advantage
since it enhances organizational learning (Orlitzky et al., 2003) and fosters employee motivation
6
an impact on the firm’s processes. Efficiency gains, improved productivity, less compliance costs
and new products and services are possible due to inclusion of ideas of pollution prevention that
are based on continuous improvement activities (Hart, 1995). Furthermore, stakeholders play an
essential part in the framework of corporate social responsibility. Interaction with stakeholders
not only fosters mutual understanding and bases for cooperation (Eccles, Ioannou and Serafeim,
2014), it also allows gaining access to insights, skills and resources which impact the innovation
process (Gould, 2012). Thus, establishing mutual trust and cooperation among stakeholders and
having a long-term rather than short-term orientation may facilitate revenue-generating potentials
for the firm (Chen et al., 2014).
Even though, innovation has been mentioned to be concerned by CSR, the impact of innovation
on the relationship between CSR and CFP remains understudied. Innovation refers to “the effort
to create purposeful, focused change in an enterprise’s economic or social potential” (Drucker,
2002, p.6). Hence, innovation activities are important to create or endow resources to establish
wealth creation potential representing an important driver of firm performance in the CSR-CFP
link. Hull & Rothenberg (2008) carried out influential research on how innovation influences this
relationship. The authors asserted that CSR positively influences CFP, being moderated by both
innovation and the level of differentiation. Concretely, low-innovation firms are able to improve
their financial performance by differentiating themselves from competitor through increased
investment in CSR. On the other hand, highly differentiated environments, where high levels of
innovation are demanded, CSR has a less strong effect on financial performance. In other words,
investments in CSR are sufficient to increase innovativeness of the company.
Despite this, Hull & Rothenberg’s (2008) approach was based on innovation as a moderator
7
including innovation and sustainable development (Hall & Vredenburg, 2003). Thus, it can be
affirmed that complementary investments in social and environmental sustainability and
innovation, lead to high levels of differentiation (Reinhardt, 1998). For example, Hart (2010)
argues that institutionalized CSR facilitates innovation of the firm. At the same time, Fowler and
Hope (2007) found empirical evidence for this claim concluding that corporate vision focused on
sustainable development is found to drive innovation. The purpose of this thesis is to contribute
to the already existing literature by examining the sequential relationship between CSR,
innovation and CFP. It is argued that CSP might be a driver of innovation shedding light on the
mis-specified analyses of the relationship between CSR and CFP (McWilliams & Siegel, 2000).
Furthermore, the present study is relevant inasmuch it adds a contingency perspective by
differentiating between short-term and long-term firm performance allowing observation on the
influence of CSR on CFP. Drawing upon this relationship, it attempts to examine whether the
impact is immediate or requires longer time-frame.
The objective of this master thesis is to revisit the relationship between CSR and CFP on the
bases of the underlying logic that CSR is founded on stakeholder management creating bridges of
communication and cooperation between society and firms. The theoretical approach for this
study is founded on the Using the resource-based view. Following, a CSR vision and strategy is
argued as the foundation for the firm to facilitate the creation of a competitive advantage through
innovation opportunities and participation in sustainable development. In order to do so, the
following research question attempts to be answered:
What is the effect of corporate social responsibility on corporate financial performance among
US publicly traded companies listed on the S&P500, in order to contribute to long-term strategic
8
For this purpose, the following sub-questions need to be identified:
1) From a temporal perspective, does the impact of CSR on CFP vary between the
short-term and long-short-term?
2) What is the impact of innovation on short-term and long-term CFP?
3) Do complementary investments in CSR and innovation improve CFP?
My thesis is composed of four themed chapters. Firstly, the thesis will elaborate on the definition
of corporate social responsibility drawing from stakeholder theory followed by the hypotheses
development. The subsequent chapter contains the statistical analysis including univariate,
bivariate and multivariate analyses. The final chapter discusses the results and provides
implications for scholars and managers.
The present study aims at filling the gap in previous literature by conducting a multivariate
hierarchical regression analysis to the test, not only on the relationship between CSR and CFP,
but also on the mediation effect of innovation.
This investigation makes use of the KLD Research & Analytics, Inc. (KLD) database to construct
a weighted average score of corporate social responsibility for years 2006 through 2011. This
dataset is extended with financial data from the Compustat database. After matching the both
databases the final sample of companies comprised of 297 U.S. publicly traded firms.
Understanding the link between CSR and CFP mediated by the role of innovation will help to fill
the gap in the literature by conducting a multivariate hierarchical regression analysis.
This thesis is solely based on secondary data lacking managerial perceptions on the issue of CSR
and innovation suggesting for further research to collect primary data. Furthermore, the KLD
9
based R&D expenditures and sales. In future, more varieties of innovation should be included to
verify the results of this study.
My interest in this area developed while I was enrolled in the Sustainable Development course at
Maastricht University that allowed me to reflect on my one-year long volunteering service in
Bethlehem, Palestine. Reflecting upon the difficult situation of poverty in this region made me
think about how multinational corporations may be able to improve the situation.
2. The business case of corporate social responsibility
2.1 Corporate social responsibility and instrumental stakeholder theory
Over the past decades, several different definitions of CSR have been proposed. However employing Carroll’s (1979) definition of CSR is the most suitable in the analysis of company
activities. The author explains CSR along four dimensions that describe the firms’
responsibilities: “The social responsibility of business encompasses the economic, legal, ethical
and philanthropic expectations that society has of organizations at a given point in time”
(Carroll, 1979, p. 500). This definition is useful because it specifies the economic responsibility
within the definition. By providing goods and services, businesses not only follow their mission
of profitability but also share wealth with society. Additionally, it allows for a more precise
examination of different firm actions (Carroll and Shabana, 2010). This expansion includes the
notion that economic and legal responsibilities are implied while ethical responsibilities are
expected and philanthropic expectations are desirable. Adding the latter two dimension stress the
broader and social contract between business and society. In other words, CSR has to be regarded
beyond the necessary requirement of economic and legal responsibility in order to emphasize the
ethical and philanthropic obligations of the firm (Carrol and Shabana, 2010). Responsibility in
10
definition is the voluntary recognition of stakeholder concerns both internal and external to the
operations of business. Thus, recognizing the stakeholder aspect is important because it “personalizes social […] responsibilities by delineating the specific groups or persons business
should consider in its CSR orientation” (Carroll, 1991, p.43). Already a few years earlier,
Freeman (1984) shed light on the importance of stakeholder groups within the strategic
management literature, later referred to the stakeholder theory.
The central theme of his work highlights that firms have the responsibility not only to shareholders but to several constituents. The firms’ obligations are extended to any party that is
impacted by the companies’ actions meaning that managers can be held accountable in case of
detrimental actions (Greenwood and van Buren, 2010). In his line of reason, the firm serves as a nexus of stakeholders who represent “any group or individual who can affect or is affected by the
achievement of the organization” (Michell et al., 1997, p.854). It implies that the interaction
between the business and stakeholder is two-directional and crucial to operationalize corporate
social responsibility.
Beyond that, stakeholder theory can be further broken down in three distinct approaches in order
to understand to better understand the relationship to CSR (Jones, 1995). The first approach
focuses on the descriptive formulations of the theory and elaborates on how the firm engages
with different stakeholders. The normative approach purports to examine stakeholders’ interests
and provide guidance on how the firm should engage based on moral grounds. Finally, the
instrumental approach is concerned with stakeholders needs. However, it includes the
organizational performance aspect and analyses the results from embracing stakeholder interests.
The important distinction concerning the instrumental formulations of stakeholder theory is the
11
(Freeman, 1999). In order to enhance firm performance, stakeholder-regarded behavior must
create outcomes that are valuable for stakeholders (Jones, 1995).
These reciprocal relationships to various groups of constituents hold strategic benefits for the
company. Porter and Kramer (2011) posit the shared value creation approach which allows
companies to innovate and grow by simultaneously creating societal, as well as, economic value.
In order to be successful, collaboration will play an essential part in the process because external
insights, skills and resources are valuable in order to create joint company and stakeholder
wealth. Overall, stakeholder management allows companies to gain insights about their
stakeholders and adapt strategies to their needs in order to create win-win situations. However,
the integration of stakeholders can also cause challenges for the organization since several
stakeholders have diverse demands towards the organization. Thus, effective stakeholder
management is crucial in order to balance the different expectations of organizational
stakeholders (Eccles and Serafeim, 2013).
2.2 Corporate social responsibility and corporate financial performance
In the literature on corporate social responsibility, the resource-based view (RBV) takes a
prominent role to explain the advantages of following a sustainability strategy and deriving a
competitive advantage (e.g. Hart, 1995; Russo and Fouts, 1997; Hillman & Keim, 2001; Bansal,
2005; Porter and Kramer, 2011). Essentially, the resource-based view describes the application and exploitation of a firm’s valuable tangible and/or intangible resources builds the foundation of
a company’s competitive advantage (Wernerfelt, 1984). In order to determine the competitive
potential of resources, they have to fulfill four criteria. First, the resource must be valuable and
provide the company with a value creating strategy that enables the firm to outperform its
12
valuable and rare resource may create a competitive advantage. However, to sustain this
competitive advantage the resource must be in-imitable in order to avoid that competitors are able
to duplicate the resource perfectly. Finally, if the resource fulfills the previously mentioned three
criteria, non-substitutability is equally important. When competitors are able to substitute the
resource, the power of the resource could be countered and destroys the potential sustainable
competitive advantage (McDowell et al., 2009). Increasing the strength of in-imitability can be
achieved in three ways (Barney, 1999; Bowman and Ambrosini, 2003):
• Path dependency (highly specialized resources that have been developed throughout the
company’s history),
• Causal ambiguity (the creation of the resource is not fully understood) and
• Social complexity (resources, such as corporate culture, are difficult to imitate in the short
term)
Additionally, Makadok (2001) stresses the distinction of the encompassing construct of resources
into resources and capabilities since tangible or intangible resources are not able to create value
by itself. The author emphasizes that resources are tradable and non-firm-specific while
capabilities are firm-specific and represent the organization’s ability to exploit those resources. In
other words, capabilities represent activities that use resources facilitated by the firm in order to
create value and achieve its objectives. Therefore, capabilities can be seen as the result of
organizational learning established by the individual members of the organization. Capabilities
must ensure the integration and facilitation the learning of its members (Mathews, 2003), thus
represent organizational processes that are steadfast over time despite member turnover (Wright
13
Overall, the resource-based view has two advantages to exemplify the link between corporate
social responsibility and corporate financial performance. First, it recognizes path dependent
intangible resources, such as corporate culture or reputation, which are essential when analyzing
the impact on corporate social responsibility policies on the company performance (Russo and
Fouts, 1997). Additionally, the final outcome of the RBV is the competitive advantage which
represents a value-creating strategy that is currently more superior that the one of the firm’s
competitors. Combining CSR with the resource-based view makes sense because it not only
impacts the financial performance and demands investments in new resources, but it also enables
the firm to create resource-based creations (Bansal, 2005).
However, it is important to consider the specific timeframe when analyzing the relationship
between CSR and CFP. Companies that have decided to introduce more environmentally friendly
products and services are often exposed to higher costs of production which is, in turn, reflected
in higher costs for the consumer (Marcus and Fremeth, 2009). Most of consumers are not willing
to pay premium prices and buy less environmentally friendly products which are sold at cheaper
prices (Marcus, 2005). It does not only take time to develop markets for socially and
environmentally sustainable products and services but also reaching a level of production costs
that translate into prices for consumer they are willing to pay. Hence, investing in resources that
are concerned with product and service development may be negatively correlated to short-term
corporate financial performance. Furthermore, relationships to different stakeholders play an
important role in optimizing the production and processes since they also need to adapt to the
changes which requires patience. Over time, competencies are developed within the company
aiming that aim to bundle several stakeholder capabilities which become more complex. This
14
source for a competitive advantage (Marcus and Fremeth, 2009). Overall, corporate social
responsibility is a long-term oriented strategic management aspect which cannot be obtained
easily in the short-term. The following hypothesize is derived:
H1a: Corporate social responsibility (CSR) negatively impacts short-term corporate financial
performance (CFP).
When looking at the long-term effects of CSR on firm performance, Brammer & Millington (2008) found that the relationship between a firm’s social performance and long-term financial
performance is positive. This observation is supported by the notion that a proactive
implementation of an environmentally friendly strategy helps to create valuable organizational
capabilities which in turn may serve as a source of sustained differentiation (Hart, 1995). This is
congruent with Porter’s (1985) arguments of competitive advantage that proposes that superior
financial performance can be reap from high levels of differentiation. Hence, strategic CSR is a
way for the firm to differentiate it from competitors. In addition to strategic implications,
excellent stakeholder relations positively influence financial returns. For example, improved
work place quality may boost the morale of employees. Satisfied employees are more willing to “go the extra mile” and make greater efforts for the firm resulting in higher productivity.
Furthermore, positive community relationships may generate perks in form of tax breaks,
municipal investments in the education system, or deregulation. Overall, these incentives allow
firms to reduce costs and increase profits (McWilliams & Siegel, 2000). Most importantly,
reciprocal dialogue with stakeholders helps firms to gather insights about stakeholder demands
and allows developing capabilities that are able to efficiently exploit existing resources and
establish an unique value-creating strategy that may lead to higher sales. Additionally, an overall
15
value high quality products that have been sourced sustainably may be more inclined to purchase
socially and environmentally friendly products and create customer loyalty. Positive customer
perceptions may lead to increased sales and decreased stakeholder management costs. However,
investing in CSR may take time since strategy has to be developed and implemented, stakeholder
relations be developed and reputation be earned. Hence, this thesis hypothesizes the following:
H1b: Corporate social responsibility positively impacts long-term corporate financial
performance (CFP).
2.3 Innovation and corporate financial performance
Since Schumpeter’s (1934) influential work on “creative destruction”, innovation has been
recognized as an important component of a successful competitive strategy. It is argued that
innovation not only creates a competitive advantage but also aids to sustain the competitive edge
(Tidd, 2001). Hence, research and development (R&D) investments are crucial to foster the
generation and improvement of resources based on knowledge and know-how advancements.
Eventually, innovation can be achieved by establishing, utilizing or reconfigure resources and
capabilities (Drucker, 2002) improving products, services and processes or, in general, create
value. Hence, effectiveness and efficiencies gains are created resulting in greater market shares
and higher sales (McWilliams and Siegel, 2000). In other words, successful innovation has the
power to generate enhanced financial performance if it also delivers additional value to the
customer and rare, difficult to be imitated and there is no substitution (Barney, 1991). Porter
(1991) proposes that tight environmental legal requirements foster innovation and the efficient
use of resource, since companies will try to reduce costs and risk by not abiding to environmental
and social demands. Hence, firms develop competitive strategies that may lead to a competitive
16
as a crucial ingredient for financial performance and was discussed by many authors (Cooper &
Kleinschmidt, 1987; Damanpour & Evan, 1984; Yiu & Lau, 2008; Hull and Rothenberg, 2008).
Innovation allows creating more commercially performing products (Cooper and Kleinschmidt,
1987) and the superior competency helps to reconfigure existing resources (Yiu & Lau, 2008).
Since this study aims to add a temporal perspective, the influence of innovation on short-term and
long-term CFP was to be regarded. Thus, innovative companies can be successful in the short run
due to first-mover advantages, major market share gains and establishing a loyal customer base.
In the long-term, innovative firms are able to establish favorable relations to legislators lobbying
for favorable legislations, increase brand equity and superior customer relationships and recruit a
quality and innovative workforce. Subsequently, innovation will positively influence the short-,
as well as, the long-term corporate financial performance:
H2a: Innovation positively affects short-term corporate financial performance (CFP)
H2b: Innovation positively affects long-term corporate financial performance (CFP)
2.4 The interaction of innovation with CSR and its effect on CFP
CSR can be driver of innovation since it demands the rethinking of products, processes and
organizational values which enables the firm to find solutions to existing environmental and social problems. For example, General Electrics (GE) launched the “Ecomagination” sustainable
growth strategy in 2005 (GE, 2016). The strategy is based on the premises to reduce energy
consumption and tackle environmental problems. The goal of the strategy is to integrate an
environmental responsible mind-set in product development activities and overall processes to
create cleaner technologies for their customers. By including an environmental conscious aspect
17
changing societal and customer needs. After one decade of Ecomagination, GE spent more than
$17 billion on R&D while generating revenues of $232 billion reducing their greenhouse gas
emissions by 12% and freshwater use by 17% (GE, 2016).
Without the involvement of stakeholders in the innovation process, however, the success of GE’s
sustainability program would not have been possible. The company brings together industry
leaders, communities, entrepreneurs and academia to steer the innovation process. Engaging
stakeholders facilitates the knowledge exchange and generates important insights for the
company. Additionally, open-innovation plays an important part in the strategy since the firm
actively invites the global innovation community to solve certain environmental challenges and a
co-creating process. Finally, GE supplies funds to venture that are environmentally sustainable in
the energy sector.
Moreover, CSR not only foster value creation by having an effect on external stakeholders but
also nourishes from internal stakeholder engagement. A company following a CSR strategy
attracts a specific workforce that is able to exploit organizational capabilities (Turban and
Greening, 1997) and, hence, influences the innovation performance of the company.
Additionally, potential employees self-select themselves based on overlapping beliefs and values
(Kirchhoff, 2000) leading to a more dedicated workforce that is intrinsically motivated to create
sustainable wealth.
Overall, companies that that want reap superior financial performance from CSR must develop a “strategy that integrates the goals of innovation and sustainable development” (Hall and
Vredenburg, 2003, p.63), utilizing fruitful stakeholder relationships. Hence, firms have to
simultaneously invest in both CSR and innovation to enable the firm to differentiate itself from
18
innovation as sequential. The author argues that social responsibility is the foundation for
companies in the future to create successful innovations. Fowler & Hope (2007) supported his
claim by providing empirical evidence by analyzing Patagonia’s strategic CSR strategy. The
authors concluded that the commitment to sustainable development guided the organizational and
technology innovations. Thus, institutionalizing principles of sustainability may dictate
innovation direction within organizations with implications for technology, administration and
strategy. Consequently, innovation has the potential to clarify the relationship between corporate
social responsibility and corporate financial performance:
H3a: The negative effect of corporate social responsibility (CSR) on short-term corporate
financial performance (CFP) is mediated by innovation
H3b: The positive effect of corporate social responsibility (CSR) on long-term corporate
financial performance (CFP) is mediated by innovation
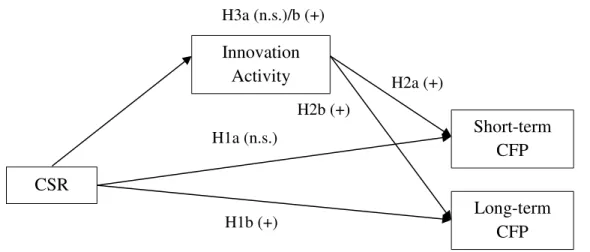
2.5 Complete Research Model
The previous chapter provided a synthesis of the literature concerning the investigated variables.
Several relationships are proposed and six hypotheses were derived. To recap, the objective of
this thesis is to investigate whether corporate social responsibility influences corporate financial
performance and whether the time frame is an important factor to consider. Furthermore, it
explores whether innovation mediates the link between CSR and CFP. Figure 1 shows an
overview of the hypothesized relationships.
The following chapter will elaborate on the research methodology including a description of the
sampling data and sources. In addition, the measures are described in detail and the analysis plan
19 3. Research methods and design
3.1 Sampling data and sources
In order to construct a measurement for CSR, data was extracted from the MSCI ESG KLD
STATS (KLD) provided by MSCI KLD Research Inc. The KLD database was adopted in many
studies in the field of corporate social responsibility (Waddock and Graves, 1997; Russo and
Fouts, 1997; Hull and Rothenberg, 2008) and provides annual assessments on CSR since 1991.
The database provides several advantages for CSR-oriented research. One advantage is the fact
that an independent rating agency solely focuses on the provision of CSR assessment data and
covers all publicly traded companies of the S&P500. Additionally, the data has been shown to be
providing robust construct validity (Shiu and Yang, 2016). The companies are assessed on seven
qualitative issues areas related to CSR covering approximately 80 indicators: community,
corporate governance, diversity, employee relations, environment, human rights, and product.
Additionally, the data provides information for the engagement in controversial business issues:
alcohol, gambling, tobacco, firearms, military, and nuclear power. Each dimension is annually
assessed on strengths and concerns. For example, the qualitative issues area diversity consists of
nine strength indicators (e.g. board of directors – gender, work-life benefits) and five concern
indicators (e.g. workforce diversity, non-representation). Each indicator is rated on a simple H1a
H1b
H2b
H2a
Long-term CFP Short-term
CFP Innovation
Activity
CSR
20
(1) binary model. If a company meets the assessment criteria established for an indicator, then this is signified with a “1”, otherwise “0”. The financial and non-CSR data was extracted from the
Compustat database to establish a single database. The database began its service in 1962 and
provides financial, statistical and market information on global companies.
3.2 Dependent variable
Corporate financial performance (CFP) constitutes the dependent variable of this research and measured by using Tobin’s q. The dynamic firm performance indicator reflects expectations of
the stock market regarding the firm’s profitability and growth potential. Additionally, it factors in
internal efficiency metrics like equity and assets (Kor & Mahoney, 2005). Since this study aims to examine the impact of CSR and innovation on the firm’s short- and long-term economic
performance Tobin’s q is the appropriate measure (Wernerfeldt & Montgomery, 1988). When
comparing to accounting-based measures, such as return on assets (ROA), it is unclear whether
returns of investments in CSR-related resources and innovation are depicted in the balance sheet and the company’s market value. Both parameters are important in order to reflect economic
value creation (King & Lenox, 2002). The Tobin’s q was calculated by the following equation (1)
(Chung & Pruit, 1994):
𝑇𝑜𝑏𝑖𝑛′𝑠 𝑞
𝑡 = 𝐸𝑞𝑢𝑖𝑡𝑦 (𝑚𝑎𝑟𝑘𝑒𝑡 𝑣𝑎𝑙𝑢𝑒)𝑡+𝐵𝑜𝑜𝑘 𝑣𝑎𝑙𝑢𝑒 𝑜𝑓 𝑙𝑜𝑛𝑔𝑡𝑒𝑟𝑚 𝑑𝑒𝑏𝑡𝑇𝑜𝑡𝑎𝑙 𝑎𝑠𝑠𝑒𝑡𝑠𝑡 𝑡+𝑁𝑒𝑡 𝑐𝑢𝑟𝑟𝑒𝑛𝑡 𝑙𝑖𝑎𝑏𝑖𝑙𝑖𝑡𝑒𝑠𝑡
The research question and hypotheses are formulated to investigate temporal effects, therefore a
short- and long-term measure of financial performance was calculated. The CSR and innovation
variables are measured for the years 2006-2011. Hence, the short-term CFP dependent variable
was operationalized the first year after this period (2012). Following the conceptualization of
long-21
term return on equity over five years, the long-term measure of CFP is measured by taking the weighted average of the Tobin’s q for the period (2013-2015). This period begins in the second
year after investments in CSR and innovation (2006-2011).
3.3 Independent variable
The operationalization of the independent variable CSR was adapted from Servaes and Tamayo’s
(2013) broad measure of CSR. As outlined above, the KLD database comprises of 13 categories
regarding CSR activities. However, controversial business issues and corporate governance
dimensions are excluded. Basically, the indicators around the corporate governance dimensions
assess the mechanisms that allow shareholders to reward and exert control on the managers. As
previously mentioned, CSR deals with social goals and a wider stakeholder understanding than
just shareholders, therefore, the corporate governance dimension is removed from the measure.
For dimension and year KLD provides a number of strengths and concerns. For example, in year
2006, the category environment contained six strengths and seven concerns. However, over the
years the number of strength and concern indicators fluctuates. Therefore, it does not allow
comparing results across years. Since this thesis is interested in cross-sectional and time-series
implications for CSR, a scaled measurement for each year of strengths and concerns was applied.
This resulted in strength and concern indices for each dimension and year ranging from 0 to 1.
This is done by dividing the number of concerns (strengths) for each firm each year within each
CSR dimension by the possible number concerns (strengths) in each dimension year. Then, a net
CSR index is calculated by subtracting the concern index from the strengths index. The net CSR
index ranges from -1 to +1 in each year. Finally, the category indices community, diversity,
22
(2) measure ranging from -6 to +6. In order to construct an overall CSR measure for the period from
2006 to 2011 the weighted average of the yearly overall CSR score was used.
For example, in 2006, United Technologies Corporation had strengths in four areas of
environment dimension out of a maximum of six, resulting in a strengths score of 0.5 (3/6). In the
same year, United Technologies Inc. had concerns in two out of seven indicators of the
environment category, resulting in a concerns score of 0.29 (2/7). Hence, United Technology’s
net CSR score in 2006 in the environment category is 0.21 (0.5-0.29). An overview of the
different categories and their number of strengths and concerns can be found in Appendix A.
3.4 Mediating variable
The second independent variable and mediating variable innovation is based on the study of
McWilliams and Siegel (2000). Furthermore, the variable will also be treated as a control
variable when testing the direct relationship between CSR and CFP. The measure was
operationalized by the following formula (2):
𝐼𝑛𝑛𝑜𝑣𝑎𝑡𝑖𝑜𝑛𝑡 =𝑅&𝐷 𝑒𝑥𝑝𝑒𝑛𝑑𝑖𝑡𝑢𝑟𝑒𝑆𝑎𝑙𝑒𝑠 𝑡 𝑡
Additionally, the weighted average for the period 2006 to 2011 was calculated to average out for
annual fluctuations in innovation investments.
3.5 Control variables
As Hull & Rothenberg (2008) suggested the following control variables are important because
they both affect CSR and company performance. First, firm size is important because large
companies are able to make higher investments in CSR and they are more observable by
23
calculating the weighted average of its total assets. The second control variable is the firm’s risk
measured by the ratio of debt to asset. The authors argued that a relatively higher debt to asset
ratio indicates that firms have fewer resources to spend on innovation and on CSR activities. The
last control variable is the firm’s industry based on standard industrial classification (SIC) code in
the year 2006. It is argued that not only profitability of the firm’s industry is likely to affect CSR
and performance but also visibility is an important factor to take into account. The two former
control variables are operationalized as the weighted average of the period 2006 to 2011.
3.6 Overview of variables per Hypothesis
The following table provides an overview of the conceptualizations of the variables combined
with the hypothesis (Table 1). From left to right, the table presents the hypotheses, dependent
variable, independent variable, mediator variable and control variables.
Table 1. Overview of hypotheses and variables
Hypothesis Dependent
Variable Independent Variable Mediator Variable Control Variables H1a: There exists a negative relationship between
CSR and short-term CFP.
Short-term CFP
CSR - Size
Risk Industry Innovation H1b: There exists a positive relationship between
CSR and long-term CFP.
Long-term CFP
CSR - Size
Risk Industry Innovation H2a: The relationship between innovation and
short-term CFP is positive
Short-term CFP
Innovation - Size Risk Industry H2b: The relationship between innovation and
long-term CFP is positive
Long-term CFP
Innovation - Size Risk Industry H3a: The negative relationship between CSR and
short-term CFP is mediated by innovation
Short-term CFP
CSR Innovation -
H3b: The positive relationship between CSR and long-term CFP is mediated by innovation
Long-term CFP
24
3.7 Analysis Plan
The statistical investigation in the following chapter starts with the descriptive sample statistics.
In order to confirm whether the data does not violate the conditions of regression analyses which
could impact the interpretation of the results, the assumptions for regression analyses are tested.
Third, the empirical relationships between the variables are determined with the bivariate analysis
in form of a correlation matrix. Fifth, the hierarchical multivariate regression analysis statistically
investigates the proposed hypotheses resulting in seven total regression models. Model 1
(short-term CFP) and Model 6 (long-(short-term CFP) test hypotheses H1a and H1b, respectively. In other
words, the models investigate the direct relationship between CSR (IV) and the short-term CFP
and long-term CFP (DVs), respectively. Model 2 and 7 test the impact of innovation on the firm’s
financial performance testing hypotheses H2a and H2b. In order to examine the mediation effects of H3a and H3b further models have to be specified in order to follow Baron and Kenny’s (1986)
steps for mediation. Model 3 and Model 8 test the direct relationship between CSR and CFP
without controlling for other variables. Model 4 comprises of the regression analysis between
innovation as a dependent variable and CSR as an independent variable. Furthermore, in Model 5
and 9 CFP is regressed against both innovation and CSR.
3.8 Wrap-up
The previous chapter provided information on the study design, data sampling and sources, and
the operationalization of the variables. Consequently, the variables that are necessary to test the
hypotheses were explained and the implementation of the analyses was outlined. Hence, the
25 4. Analysis and Results
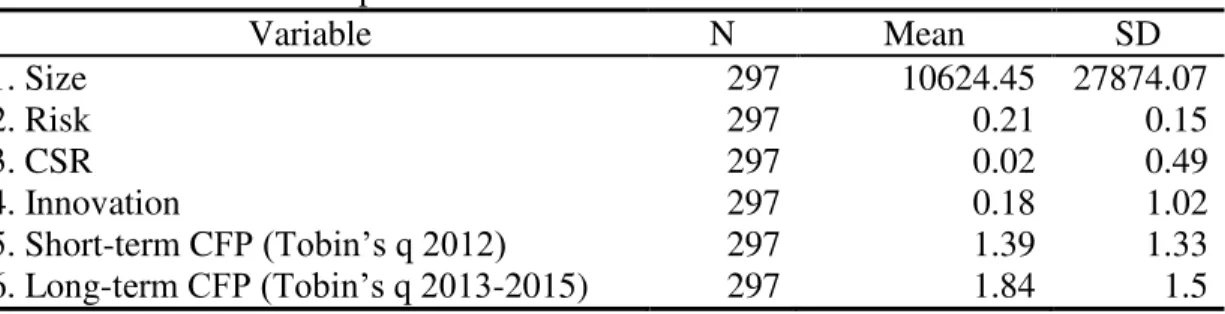
4.1 Descriptive Statistics
4.1.1 The sample
The sample consists of 297 (N=297) U.S corporations that are traded on the S&P500. The sample
consists of 260 manufacturing firms, 20 service firms, five transportation firms, four mining
firms, three wholesale firms, two finance firms, two retail firms and one agricultural firm. The
average CSR performance is 0.02 with Exxon Mobil (XOM) receiving the worst rating of -1.6.
On the other end, Intel (INTC) was rated the highest in the period from 2006 until 2011 with a
score of 1.89. Furthermore the mean of the innovation variable is 0.18. The average of the short-
and long-term Tobin’s q is 1.39 and 1.84, respectively. Table 2 provides descriptive statistics for
all variables used on the study. In the following the sample will be analyzed to determine whether
the data is suitable for this parametric test. To be able to make inference about the data the
conditions are checked on the following order: (1) Normal Population Assumption and (2) Equal
Variance Assumption (Sharpe et al., 2010). The assumption of independence is likely to hold,
since the data is cross-sectional (Tabachnick & Fidell, 2013).
Table 2. Variable descriptives
Variable N Mean SD
1. Size 297 10624.45 27874.07
2. Risk 297 0.21 0.15
3. CSR 297 0.02 0.49
4. Innovation 297 0.18 1.02
5. Short-term CFP (Tobin’s q 2012) 297 1.39 1.33
26
4.2 Assumptions of regression analysis
4.2.1 Assumption of normality: Univariate analysis
Skewness and Kurtosis
Skewness and kurtosis provide information about the distributional symmetry and peakness of
the variables, respectively. Therefore both measurements are a first indicator to assess normality
(Sharpe et al., 2010). In order to provide evidence that the sample is normally distributed the
coefficients of skewness and kurtosis must range between -2 and +2. However, the results in
Table 3 show a very high positive skewness of the innovation, short-term CFP and long-term
CFP variables. Only CSR falls into the threshold range. The same variables also display high
levels of kurtosis called leptokurtic. This time CSR also deviates from the threshold and deviates
slightly above +2 violating the kurtosis requirement. In order to improve the analysis of
relationships the variables innovation, short-term CFP and long-term CFP are transformed by the
natural logarithm function to improve the symmetry of the variable distributions. The skewness
and kurtosis coefficients after the transformation are shown in Table 4. The results show that the
logarithmic transformation improved the symmetry of the variable distributions and decreased the
level of kurtosis. However, LNInnovation kurtosis coefficient is still slightly higher than +2.
Table 3. Descriptives (Skewness and Kurtosis)
Variable Skewness Kurtosis
Statistic SE Statistic SE
CSR 1.035 0.141 2.307 0.282
Innovation 8.518 0.141 75.066 0.282
Short-term CFP 6.684 0.141 69.245 0.282
Long-term CFP 5.079 0.141 42.539 0.282
Table 4. Logarithmic Transformation Descriptives (Skewness and Kurtosis)
Variable Skewness Kurtosis
Statistic SE Statistic SE
LNInnovation 0.622 0.141 2.057 0.282
LNShort-term CFP 0.108 0.141 1.443 0.282
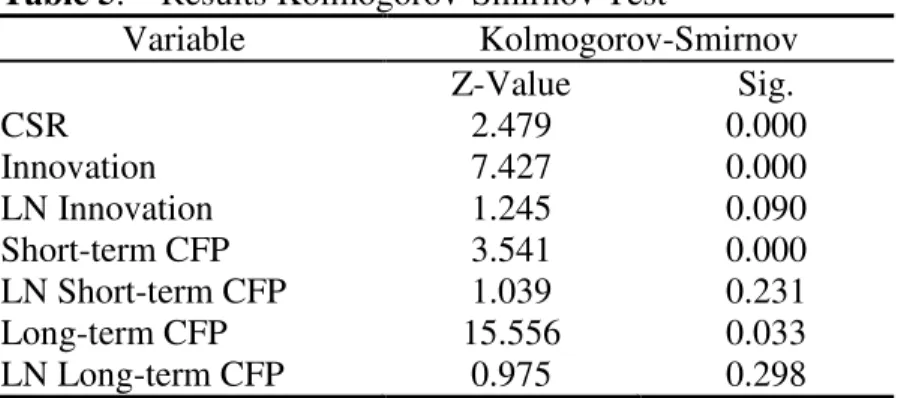
27 Kolmogorov-Smirnov Test (non-parametric)
The Kolmogorov-Smirnov Test (K-S) test compares the scores of a sample to a normal
distribution with the same mean and standard deviation. A test outcome resulting on a Z-score
smaller than 1.65 (Z < 1.65, p < 0.05) would provide evidence for the null hypothesis stating that
the observed distribution is normally distribution. In other words, a low Z-value would indicate
that the sample is normally distributed (Reference). Table 5 provides the outcomes of the K-S
test. The untransformed variables display a high Z-Value which is greater than the threshold of
1.65 indicating that these variables are non-normal. However, the outcomes for transformed
variables all result in a Z-Value below 1.65 finding evidence for the null hypothesis that the
observed distribution is normally distributed. Congruent with the kurtosis coefficient, the
independent variable CSR is non-normally distributed, however, is rather usual for business
research (Blumberg et al., 2008). Additionally, in large samples statistically significant kurtosis
does not differ enough from normality to conclude a difference in the analysis (Tabachnick &
Fidell, 2013). Consequently, the normality assumption is fulfilled.
Table 5. Results Kolmogorov-Smirnov Test
Variable Kolmogorov-Smirnov
Z-Value Sig.
CSR 2.479 0.000
Innovation 7.427 0.000
LN Innovation 1.245 0.090
Short-term CFP 3.541 0.000
LN Short-term CFP 1.039 0.231
Long-term CFP 15.556 0.033
28
4.2.2 Assumption of homogeneity
The second assumption depicts the requirement that the variances between groups of the sample
have to be equal. First, parametric test in form of the one-way ANOVA are used, followed by the
non-parametric Kruskal-Wallis test with regard to the different industries the firms of the sample
operate in. The transformed variables were used to performance the one-way ANOVA and the
Kruskal-Wallis test.
One-way ANOVA (Parametric)
The assumption of equal variances is holds when a difference of variances among the industry
groups is significantly absent. Since there are eight different industry groups, the one-way
ANOVA is the appropriate parametric test which compares the means of the groups. The null
hypothesis states that the variances are equal. Hence, the existence of non-significant results (p > 0.05) of the Levene’s outcome would imply that the homogeneity is present with regard to the
industry groups. The results of the One-way ANOVA are presented in Table 6. The results
display that all variables have insignificant results providing evidence for assumption the
variances are equal among the groups.
Table 6. Parametric test for Homogeneity of Variances (industry)
Variable Levene’s Test
Statistic Sig.
CSR 0.848 0.534
Innovation 1.030 0.406
Short-term CFP 0.719 0.634
Long-term CFP 1.474 0.187
Kruskal-Wallis one-way analysis of variance (Non-Parametric)
The Kruskal-Wallis test is the non-parametric equivalent to the one-way ANOVA and compares
at least two independent samples of equal or different sample size. The null hypothesis states that
29
would indicate that there exist differences amongst the groups. Table 7 shows the results of the
Kruskal-Wallis test. Surprisingly, the results display completely different results than the
One-way ANOVA. All of the tested variables are significant indicating that there exists a significant
difference between the groups. Since the variables are normally distributed, Levene’s test
provides evidence that the variables are equally distributed.
Table 7. Non-parametric test for Homogeneity of Variances (industry)
Variable Kruskal-Wallis Test
Chi-square Sig.
CSR 16.946 0.018
Innovation 22.556 0.002
Short-term CFP 14.092 0.050
Long-term CFP 15.556 0.033
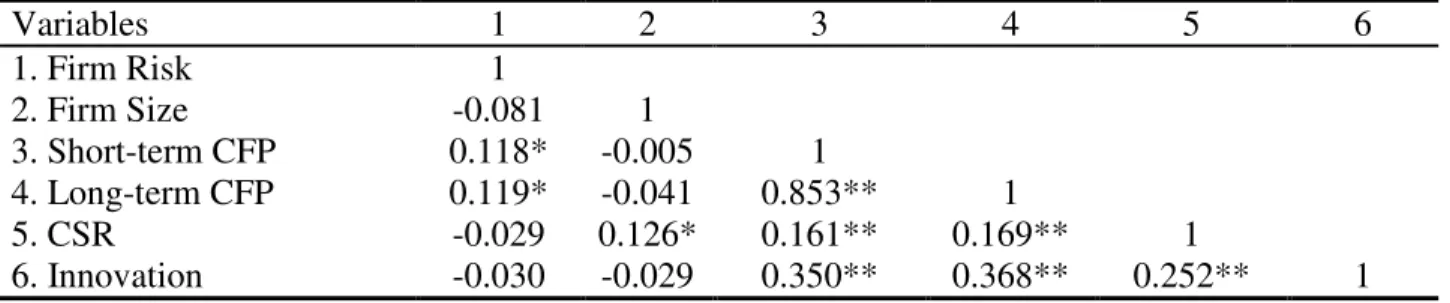
4.3 The correlation analysis: Bivariate Analysis
Correlation analysis provides information about linearity because it investigates the strength and
direction of relationships between different variables. The correlation value can range from -1 to
+1, where -1 is total negative linear correlation, 0 indicates no linear correlation and +1 a positive
linear correlation. Since the data is interval and ratio data, the Pearson correlation measurement is
useful (Sharpe et al., 2010).
Table 8. Correlation matrix of research variables
Variables 1 2 3 4 5 6
1. Firm Risk 1
2. Firm Size -0.081 1
3. Short-term CFP 0.118* -0.005 1
4. Long-term CFP 0.119* -0.041 0.853** 1
5. CSR -0.029 0.126* 0.161** 0.169** 1
6. Innovation -0.030 -0.029 0.350** 0.368** 0.252** 1
30
The values from the table indicate the absence from multicollinearity since all correlation
coefficients are smaller than 0.9 (Sharpe et al., 2010). The outcome displays (Table 8) that all
variables are significantly positively related. In particular the correlations between independent
variables and dependent variables are interesting. CSR is positively correlated to long-term
financial performance (r = 0.169, p < 0.001). In addition, the corporate social responsibility
variable also positively related to short-term CFP (r = 0.161, p < 0.001) providing encouragement
for the proposed investigation. Furthermore, the innovation variable is positively correlated to
both long-term (r = 0.368, p < 0.001) and short-term CFP (r = 0.350, p < 0.001). Additionally the Spearman’s test was performed (Appendix B) adjusting for potential outliers, also indicates that
multicollinearity is absent.
4.4 Regression analyses: Testing the hypotheses
Despite the evidence for relationships between the independent and dependent variables through
correlations, the relationships have to be analyzed further by using multiple regression. This
study conducts a hierarchical multiple regression analysis which indicates that the order of how
the variables are entered into the model is crucial based on theoretical reasoning. Table XXX
provides an overview of the regression equations that were used to test the hypotheses. The
following equations function depicts the base model
𝑌 = 𝛽0+ 𝛽1∗ 𝑥𝐶𝑆𝑅 + ∑ (𝛽𝑖𝑗 ∗ 𝑥𝑖𝑗)
𝑖𝑗 + 𝜀
𝑌 describes the dependent variable corporate financial performance (CFP), β0 denotes the
constant, βi represents the coefficients for the independent variable. ∑ (𝛽𝑖𝑗 𝑖𝑗∗ 𝑥𝑖𝑗)indicates the
sum of the control variables and 𝜀 is the error term. An overview of the different models and
equations is found in Table 9. The input variables in the model are the logarithmically
31 Table 9. Overview of regression equations
Model Equation Hypothesis
1a 𝑌
𝑆𝑇−𝐶𝐹𝑃= 𝛽0+ 𝛽1𝑥𝐶𝑆𝑅+ ∑ (𝛽𝑖𝑗∗ 𝑥𝑖𝑗)
𝑖𝑗 + 𝜀 H1a
2b 𝑌
𝑆𝑇−𝐶𝐹𝑃= 𝛽0+ 𝛽1𝑥𝐼𝑛𝑛𝑜𝑣𝑎𝑡𝑖𝑜𝑛+ ∑ (𝛽𝑖𝑗∗ 𝑥𝑖𝑗)
𝑖𝑗 + 𝜀 H2a
3
𝑌𝑆𝑇−𝐶𝐹𝑃= 𝛽0+ 𝛽1𝑥𝐼𝑛𝑛𝑜𝑣𝑎𝑡𝑖𝑜𝑛+ 𝜀 H3a
4 𝑌𝐼𝑛𝑛𝑜𝑣𝑎𝑡𝑖𝑜𝑛= 𝛽0+ 𝛽1𝑥𝐶𝑆𝑅+ 𝜀 H3a, H3b
5
𝑌𝑆𝑇−𝐶𝐹𝑃= 𝛽0+ 𝛽1𝑥𝐶𝑆𝑅+ 𝛽2𝑥𝐼𝑛𝑛𝑜𝑣𝑎𝑡𝑖𝑜𝑛+ 𝜀 H3a
6a 𝑌
𝐿𝑇−𝐶𝐹𝑃= 𝛽0+ 𝛽1𝑥𝐶𝑆𝑅+ ∑ (𝛽𝑖𝑗∗ 𝑥𝑖𝑗)
𝑖𝑗 + 𝜀
H1b
7b 𝑌
𝐿𝑇−𝐶𝐹𝑃= 𝛽0+ 𝛽1𝑥𝐼𝑛𝑛𝑜𝑣𝑎𝑡𝑖𝑜𝑛+ ∑ (𝛽𝑖𝑗∗ 𝑥𝑖𝑗)
𝑖𝑗 + 𝜀
H2b
8
𝑌𝐿𝑇−𝐶𝐹𝑃= 𝛽0+ 𝛽1𝑥𝐼𝑛𝑛𝑜𝑣𝑎𝑡𝑖𝑜𝑛+ 𝜀 H3b
9 𝑌𝐿𝑇−𝐶𝐹𝑃= 𝛽0+ 𝛽1𝑥𝐶𝑆𝑅+ 𝛽2𝑥𝐼𝑛𝑛𝑜𝑣𝑎𝑡𝑖𝑜𝑛+ 𝜀 H3b
aControl variables include: Innovation, Firm risk, Firm size, Industry bControl variables include: Firm risk, Firm size, Industry
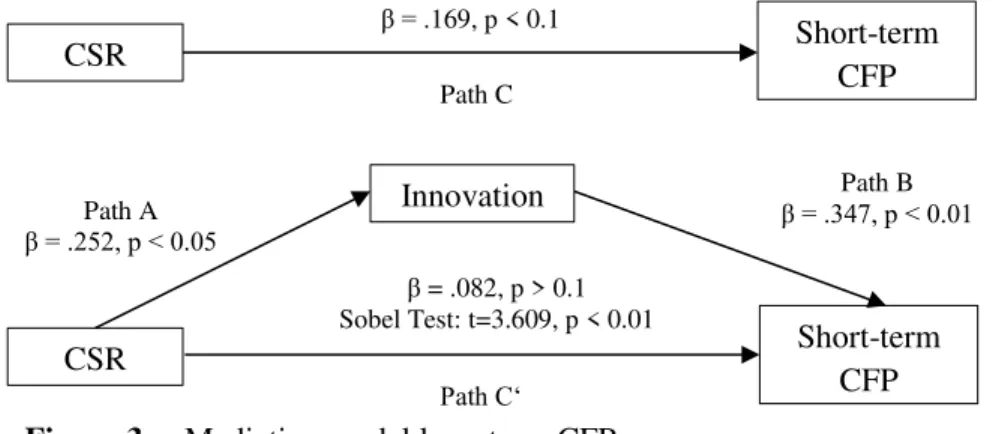
Hypothesis 1a: This hypothesis proposed that CSR would have a negative effect on short-term
CFP. The results from the Model 1 (F = 5.785, p < 0.05, adjusted R² (aR²) = 0.151) show a
positive but insignificant relationship between CSR and short-term CFP (β = 0.087, p > 0.1).
Hence, hypothesis 1a is rejected.
Hypothesis 1b: The second direct effect of CSR on long-term financial performance was tested
with Model 6 (F = 6.528, p < 0.05, adjusted R² (aR²) = 0.201). The model provided evidence for
the hypothesis and results in a positive relationship between CSR (β = 0.094, p < 0.1) and long
-term financial performance. Hence, hypothesis 1b was supported.
Hypothesis 2a: The study hypothesized that the relationship between innovation and short-term
firm performance is positive. Model 2 (F = 6.102, p < 0.01, adjusted R² (aR²) = 0.147) regressed