LEONARDUS VERGÜTZ
STUDYING THE SOIL COMPARTMENT OF THE
GLOBAL CARBON CYCLE
Tese apresentada à Universidade Federal de Viçosa, como parte das exigências do Programa de Pós-Graduação em Solos e Nutrição de Plantas, para obtenção do título Doctor Scientiae.
VIÇOSA
LEONARDUS VERGÜTZ
STUDYING THE SOIL COMPARTMENT OF THE
GLOBAL CARBON CYCLE
Tese apresentada à Universidade Federal de Viçosa, como parte das exigências do Programa de Pós-Graduação em Solos e Nutrição de Plantas, para obtenção do título Doctor Scientiae.
APROVADA: 12 de agosto de 2011
_________________________________ Prof. Ivo Ribeiro da Silva
(Coorientador)
_________________________________ Prof. Nairam Félix de Barros
_________________________________ Prof. Luis Henrique Mendes da Silva
_________________________________ Prof. Carlos Eduardo Pellegrino Cerri
_________________________________ Prof. Roberto Ferreira de Novais
ii
Dedico esta tese aos meus pais ILMO e NELI e à minha esposa TERESA CRISTINA
“Education is the most powerful weapon which you can use to change the world”
iii
AGRADECIMENTOS
À Deus, por me guiar e abençoar nessa caminhada;
À minha esposa Teresa Cristina, pelo carinho, amor, paciência, incentivo e companheirismo em todos os momentos;
Aos meus pais Ilmo e Neli, pelo amor incondicional, dedicação, apoio, incentivo e confiança;
Aos meus irmãos Thômas e Stéphany, pelo companheirismo, apoio e alegrias;
À Universidade Federal de Viçosa e ao Programa de Pós-graduação em Solos e Nutrição de Plantas, pela oportunidade oferecida;
Ao Department of Biology da Duke University, pelo ótimo ambiente e pela oportunidade; Ao CNPq, pela concessão das bolsas de estudo;
Ao meu orientador professor Roberto Ferreira de Novais, pela orientação, suporte, ensinamentos e exemplos durante toda minha formação acadêmica;
Aos professores Ivo Ribeiro da Silva e Luis Henrique Mendes da Silva, membros do meu comitê de orientação, pela amizade, apoio e pelos ensinamentos durante o preparo deste trabalho;
Ao professor Robert B. Jackson, por me receber em seu grupo e por todos os ensinamentos, orientação e apoio durante a realização das atividades na Duke University; A todos os professores com os quais tive a oportunidade de cursar disciplinas ou discutir idéias, pela minha formação acadêmica e intelectual;
Aos amigos e colegas brasileiros, americanos, espanhóis, argentinos, italianos, coreanos, chineses, finlandeses, venezuelanos... dentre eles mas não somente: José Luiz, Geraldo, Cardoso, Beto, João Milagres, Luciana, Michelle, Helton, Guilherme, Fernandinha, Fabrição, Flancer, Eric, Bárbara, Aline, Emanuelle, André, Cristiano, Vanessa, Ricardo, Emília, Soledad, Ilari, Justin, Cristina, Desiree, Colin, Will, Dush, John, Gervasio, Andrew, Kaiguang, Danielle, Eileen, Linda, Jim, Anita, Scotch, Rachel, Craig, Stefano, Derek, Carlos...
Finalmente, a todos que direta ou indiretamente me apoiaram e incentivaram ao longo do caminho;
iv
BIOGRAFIA
Leonardus Vergütz, filho de Ilmo Vergütz e Neli de Jesus Vergütz, nascido em 23 de março de 1982, em Patos de Minas, MG.
No ano de 2000 mudou-se para Viçosa, MG, onde iniciou o curso de Agronomia pela Universidade Federal de Viçosa.
Em 2005 obteve o título de bacharel e em agosto desse mesmo ano deu início aos estudos em nível de mestrado pelo programa de pós-graduação em Solos e Nutrição de Plantas dessa mesma universidade, desenvolvendo trabalhos sobre o impacto do cultivo de eucalipto nos estoques de C orgânico dos solos.
Em agosto de 2007 defendeu sua dissertação de mestrado, dando início ao curso de doutorado em Solos e Nutrição de Plantas nesse mesmo mês. Durante seu doutoramento dedicou esforços para melhorar o conhecimento a respeito do ciclo do C nos solos, realizando estudos quantitativos e qualitativos que incluem o estudo calorimétrico das substâncias húmicas.
Em setembro de 2009 mudou-se para Raleigh, NC, USA, onde iniciou o programa de doutorado sanduíche no Department of Biology da Duke University sob orientação do professor Robert B. Jackson. Permaneceu na Duke University até dezembro de 2010, tendo desenvolvido trabalho de meta-análise sobre a concentração e reabsorção global de nutrientes em folhas de plantas terrestres.
v
SUMÁRIO
RESUMO ... vii
ABSTRACT ... ix
GENERAL INTRODUCTION ... 1
CHAPTER 1. GLOBAL RESORPTION EFFICIENCIES AND CONCEN-TRATIONS OF CARBON AND NUTRIENTS IN LEAVES OF TERRESTRIAL PLANTS ... 4
ABSTRACT ... 4
1. INTRODUCTION ... 5
2. MATERIALS AND METHODS ... 10
2.1 Data description ... 10
2.2 Resorption calculation and data analysis ... 12
3. RESULTS ... 15
3.1 Leaf mass loss (LML) and mass-loss correction factors (MLCF)... 15
3.2 Nutrient content and mean resorption efficiency (NuR ) across plant functional types ... 18
3.3 Nutrient content and mean nutrient resorption for N2 fixers and non-fixers. ... 20
3.4 Resorption efficiency and plant nutrient status ... 22
3.5 Resorption efficiency along climatic gradients ... 24
4. DISCUSSION ... 26
4.1 Nutrient-resorption efficiency patterns ... 26
4.1.1 Mass loss during senescence ... 26
4.1.2 Nutrient content and resorption efficiency for plant functional types ... 28
4.1.3 Resorption efficiency and nutrient status... 29
4.1.4 Resorption efficiency and climate ... 31
4.2 Ecological consequences of observed patterns in resorption efficiency ... 32
4.3 Implications for terrestrial ecosystem modeling ... 33
5. CONCLUSIONS ... 35
6. ACKNOWLEDGEMENTS ... 35
7. REFERENCES ... 36
vi
CHAPTER 2. THERMODYNAMIC CHARACTERIZATION OF HUMIC ACID-SURFACTANT INTERACTION. NEW INSIGHTS ON HUMIC
ACIDS’ BEHAVIOR AND STRUCTURE ... 61
ABSTRACT ... 62
INTRODUCTION ... 62
EXPERIMENTAL SECTION ... 65
RESULTS AND DISCUSSION... 65
ACKNOWLEDGMENTS ... 79
REFERENCES ... 79
CHAPTER 3. THE ROLE OF SOIL TEXTURE AND CLIMATIC CONDITIONS ONTO SOIL ORGANIC CARBON IN THREE MAJOR BRAZILIAN BIOMES ... 85
ABSTRACT ... 85
1. INTRODUCTION ... 86
2. MATERIAL AND METHODS ... 88
3. RESULTS AND DISCUSSION ... 91
3.1 TOC and CFLOM stocks and C/NTOTAL and C/NFLOMin three Brazilian biome’s soils under native vegetation, eucalyptus plantation, and pasture ... 91
3.2 Associations of TOC, ∆TOC, CFLOM, ∆CFLOM, C/NTOTAL, ∆C/NTOTAL, C/NFLOM, and ∆C/NFLOM with climatic characteristics and clay content ... 95
3.3 Correlations and regressions among SOM variables ... 101
4. CONCLUSIONS ... 106
5. ACKNOWLEDGEMENTS ... 106
6. REFERENCES ... 106
7. APPENDIX ... 111
GENERAL CONCLUSIONS ... 126
vii
RESUMO
VERGÜTZ, Leonardus, D.Sc., Universidade Federal de Viçosa, agosto de 2011. Studying
the soil compartment of the global carbon cycle. Orientador: Roberto Ferreira de
Novais. Coorientador: Ivo Ribeiro da Silva.
viii
ix
ABSTRACT
VERGÜTZ, Leonardus, D.Sc., Universidade Federal de Viçosa, August, 2011. Studying
the soil compartment of the global carbon cycle. Advisor: Roberto Ferreira de Novais.
Co-advisor: Ivo Ribeiro da Silva.
x
1
GENERAL INTRODUCTION
There is a lot of scientific evidence showing that anthropogenic CO2 emissions have caused the climate to change. According to Smith et al. (2009) on “Clearing the air”, the great Swedish chemist Svante Arrhenius, back in 1895, used basic physical concepts, already well understood at the time, to described how variations in trace gases on the atmosphere (particularly CO2) should influence the heat budget on Earth. Therefore, a dramatic reduction on CO2 emissions is essential to reduce the risk of future devastating effects. But even if we could halt anthropogenic C emissions today, the climate risk they pose would persist for a long time – longer than that of nuclear waste – assuming that we must rely on natural processes to dissipate the perturbation (Keith et al., 2009). As our modern society is highly dependent on energy, and around eighty percent of this energy is derived from fossil fuel (Chu, 2009), an immediate emissions halt is essentially impossible. Moreover, the development and implementation of cleaner sources of energy is something that takes time and money, what allow us to say that CO2 emissions are going to keep high for a while.
2
microorganisms into more stable forms known as humus. Thus, photosynthesis is a process of great importance to the global C cycle, with terrestrial vegetation sequestering a quarter of all CO2 released annually into the atmosphere (Normile, 2009).
With those issues in mind, the goal of this work was to improve the knowledge about the global C cycle, studying SOC quantitative and qualitatively. In order to have a better understanding about the factors that lead to SOC stabilization, we focused at three different stages of it. On chapter 1 we did a meta-analysis on global resorption efficiencies and concentrations of carbon and nutrients in terrestrial plants. Nutrient resorption is a key component of plant nutrient conservation strategies and hence of productivity and elemental cycling in ecosystems. It influences many, if not most, ecosystem processes, including carbon cycling and resource-use efficiency (Aerts and Chapin 2000; Jackson et al. 2000; Gleason and Ares 2007; McGroddy et al. 2004). Thus, improved estimates of resorption parameters are needed for predicting long-term primary productivity and for improving biogeochemical models. Overall, global estimates for nutrient concentrations and resorption efficiencies should improve models that explicitly represent the cycling of C and nutrients, allowing the modeling community to represent more explicitly the coupling of other nutrient cycles.
3
(microcalorimetry) technique using cationic surfactants as molecular probes. Comprehending humic substances is essential to improve soil organic carbon storage and the fate of other compounds when interacting with them.
4
CHAPTER 1
Submitted as original paper to Ecological Monographs
GLOBAL RESORPTION EFFICIENCIES AND CONCENTRATIONS OF CARBON AND NUTRIENTS IN LEAVES OF TERRESTRIAL PLANTS
Leonardus Vergütz1,2, Stefano Manzoni3, Amilcare Porporato3,4, Roberto F. Novais1, Robert B. Jackson2,4,5
1
Departamento de Solos e Nutrição de Plantas, Universidade Federal de Viçosa, Viçosa, MG 36570, Brasil.
2
Department of Biology, Duke University, Durham, NC 27708, USA. 3
Pratt School of Engineering, Duke University, Durham, NC 27708, USA. 4
Nicholas School of the Environment, Duke University, Durham, NC 27708, USA. 5
Center on Global Change, Duke University, Durham, NC 27708, USA.
ABSTRACT
5
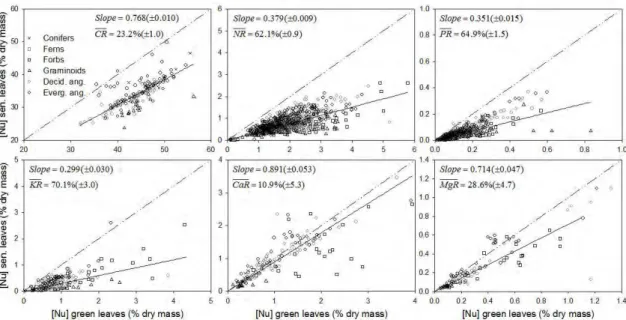
and deciduous woody angiosperms. In general, N and P resorption differed significantly from the commonly used global value of 50% (62.1 and 64.9%, respectively; P<0.05). Ca, C, and Mg showed lower average resorptions of 10.9, 23.2, and 28.6%, respectively. In contrast, K had the highest resorption of all nutrients studied (70.1%). We also found that resorption of N, P, and Ca depended on leaf nutrient-status; globally, N and P showed a decrease in resorption with increased nutrient status, while Ca showed an increase. On average, global leaf mass loss was 24.2%. Overall, our resorption data differ substantially from commonly assumed values and should help improve biogeochemical and land-surface models.
Keywords: Biogeochemical and land-surface models, Calcium, Carbon, Leaf mass loss,
Magnesium, Nitrogen, Nutrient resorption efficiency, Phosphorus, Potassium.
1. INTRODUCTION
Nutrient resorption (NuR) is a key component of plant nutrient conservation strategies and hence of productivity and elemental cycling in ecosystems. It influences many, if not most, ecosystem processes, including carbon cycling and resource-use efficiency (Aerts and Chapin 2000, Jackson et al. 2000, Gleason and Ares 2007, McGroddy et al. 2004), plant litter decomposition through changes in litter quality (Berg and McClaugherty 2007, Manzoni et al. 2008, Manzoni et al. 2010), and plant competition (Eckstein et al. 1999, Yuan et al. 2005). From a physiological perspective, resorption from leaves is the net result of several processes, including the enzymatic breakdown of N- and
P-containing compounds in leaves, phloem loading and transport, and the formation of an
6
energetically expensive process influenced by physiological factors and nutrient economics (Gordon and Jackson 2000, Freschet et al. 2010). From the perspective of leaf economics, understanding how NuR works and providing good quantitative estimates of its occurrence are essential for modeling nutrient cycling, biosphere productivity, and responses of plants and the biosphere to a changing climate (Jackson et al. 1997, Wright et al. 2004). In particular, the new generation of coupled global models of the carbon cycle and climate system require reliable estimates of resorption efficiencies globally (Thornton et al. 2007).
Although some studies have examined plant NuR in relation to climate, soil characteristics, and plant traits, data limitations have made the search for mechanistic and global relationships difficult (Chapin and Moilanen 1991, Aerts 1996, Lambers et al. 1998, Aerts and Chapin 2000, Kazakou et al. 2007, Yuan and Chen 2009a). N resorption (NR) generally increases from the tropics to the tundra while P resorption (PR) decreases, mirroring increased N- and decreased P-limitation towards northern latitudes (Yuan and Chen 2009a). High NuR was predicted to be more common in low-fertility soils, but this relationship has not been universally supported (Aerts 1996, Diehl et al. 2003). Similarly, an expected correlation between soil moisture and nutrient retention was not observed when tested in a tree species, Austrocedrus chilensis (Buamscha et al. 1998). Much less is known about resorption patterns of other essential nutrients, particularly K, Mg, and Ca, which to our knowledge have not been studied globally.
7
2003, Kobe et al. 2005, Cai and Bongers 2007). Although resorption efficiency sometimes is positively correlated with both N concentrations in mature leaves and soil N fertility (Diehl et al. 2003), a study by van Heerwaarden et al. (2003) found a general trend towards decreased NuR efficiency with higher N supply. Nutrient conservation strategies have also been related to plant functional type (Diehl et al. 2003, Yuan and Chen 2009a), although observed differences across growth forms and functional groups have typically been small. Where differences have been observed, NR tends to be higher in deciduous than in evergreen species and in trees than in shrubs (Yuan and Chen 2009b). PR is generally higher in graminoids (Aerts 1996) and in evergreen than deciduous species (Yuan and Chen 2009b).
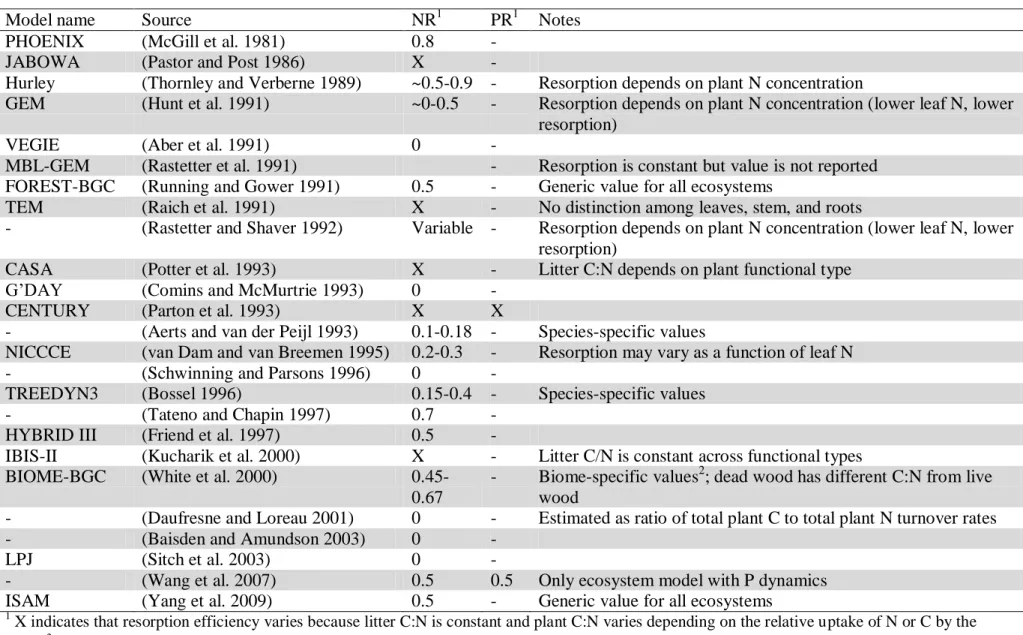
Along with its ecological importance in the field, nutrient resorption parameters are also vital for the accuracy of ecosystem and biogeochemical models. Our analysis of 25 such models shows wide variation in NuR values, from 0 to 90% of N resorption, with the most commonly used estimate of resorption efficiency being 50% (Table 1). This model overview also highlights some limitations in current resorption parameterization. First, ecosystem models tend to neglect the dynamics of P and do not consider other nutrients. Second, few of these models include different resorption parameters for different plant functional types, even when they model those functional types explicitly. Thus, a more solid observational base of NuR efficiencies could help constrain nutrient cycling in coupled biogeochemical models.
8
to avoid this issue. Nutrient pools have been expressed on the basis of leaf area or length, Ca concentration, lignin content, canopy area, and more, assuming that these factors do not change during senescence. However, changes do occur in most cases (e.g., leaf shrinkage) and the only unbiased method to estimate resorption is based on measurement of nutrient pools in the same leaves before and after senescence. Because this approach is impractical, other methods are employed, recognizing the need to quantify any corresponding errors. For example, leaf mass loss could lead to an average NuR underestimation of 10% when using leaf mass-based concentrations, while leaf shrinkage could lead to an average underestimation of 6% when using area-based concentrations (van Heerwaarden et al. 2003). For these reasons, global-scale correction factors are needed that account for changes in leaf mass (or area) during senescence and that can be used to obtain unbiased estimates of resorption.
9
Table 1. Leaf N and P resorption efficiencies (NR and PR) as represented in ecosystem and global biogeochemical models.
Model name Source NR1 PR1 Notes
PHOENIX (McGill et al. 1981) 0.8 -
JABOWA (Pastor and Post 1986) X -
Hurley (Thornley and Verberne 1989) ~0.5-0.9 - Resorption depends on plant N concentration
GEM (Hunt et al. 1991) ~0-0.5 - Resorption depends on plant N concentration (lower leaf N, lower resorption)
VEGIE (Aber et al. 1991) 0 -
MBL-GEM (Rastetter et al. 1991) - Resorption is constant but value is not reported FOREST-BGC (Running and Gower 1991) 0.5 - Generic value for all ecosystems
TEM (Raich et al. 1991) X - No distinction among leaves, stem, and roots
- (Rastetter and Shaver 1992) Variable - Resorption depends on plant N concentration (lower leaf N, lower resorption)
CASA (Potter et al. 1993) X - Litter C:N depends on plant functional type
G’DAY (Comins and McMurtrie 1993) 0 -
CENTURY (Parton et al. 1993) X X
- (Aerts and van der Peijl 1993) 0.1-0.18 - Species-specific values
NICCCE (van Dam and van Breemen 1995) 0.2-0.3 - Resorption may vary as a function of leaf N
- (Schwinning and Parsons 1996) 0 -
TREEDYN3 (Bossel 1996) 0.15-0.4 - Species-specific values
- (Tateno and Chapin 1997) 0.7 -
HYBRID III (Friend et al. 1997) 0.5 -
IBIS-II (Kucharik et al. 2000) X - Litter C/N is constant across functional types
BIOME-BGC (White et al. 2000)
0.45-0.67
- Biome-specific values2; dead wood has different C:N from live wood
- (Daufresne and Loreau 2001) 0 - Estimated as ratio of total plant C to total plant N turnover rates
- (Baisden and Amundson 2003) 0 -
LPJ (Sitch et al. 2003) 0 -
- (Wang et al. 2007) 0.5 0.5 Only ecosystem model with P dynamics
ISAM (Yang et al. 2009) 0.5 - Generic value for all ecosystems
1
10 2. MATERIALS AND METHODS 2.1 Data description
11
Figure 1. Global distribution of the nutrient resorption data set.
12
monthly temperatures and precipitation, as well as the seasonality of precipitation (McKnight and Hess 2000), and it is still the most frequently used climate classification (Kottek et al. 2006). Overall, 171 data points were available for C concentrations in leaves, 948 for N, 669 for P, 207 for K, 150 for Ca, 115 for Mg, and 191 for leaf mass-loss calculations (APPENDIX). Relatively few of the studies provided data on soil attributes, but where possible we compiled data for extractable soil nutrients and texture.
2.2 Resorption calculation and data analysis
Resorption data are often presented as NuR efficiency, defined as the proportional withdrawal of a nutrient during senescence (Cartaxana and Catarino 2002, van Heerwaarden et al. 2003, Wright and Westoby 2003, Cai and Bongers 2007, Yuan and Chen 2009a),
100 leaves green in nutrient of Mass leaves senesced in nutrient of Mass 1
NuR
(1)
Most observations, however, are made on a leaf mass basis, and resorption is thus estimated as 100 Nu Nu 1 NuR Gr Sen (2) where leaves green of mass Dry leaves green in nutrient of Mass
NuGr (3)
leaves senesced of mass Dry leaves senesced in nutrient of Mass
NuSen (4)
13
resorption because of increased NuSen, especially when comparing species that lose different relative amounts (van Heerwaarden et al. 2003). To obtain unbiased resorption estimates, we can rewrite the real resorption as
100 M LCF Nu Nu 1 NuR Gr Sen (5)
where MLCF is the mass loss correction factor, specifically the ratio of the dry mass of green leaves, MGr, and the dry mass of senesced leaves, MSen,
Gr Sen
M M
M LCF (6)
Using MLCF, we corrected nutrient contents in senesced leaves by normalizing them by green leaf mass,
MLCF Nu
Nu*Sen Sen. (7)
Accordingly, the unbiased estimate of resorption efficiency (analytically equivalent to the definition of NuR in Eq. (1)) is given by:
100 Nu Nu 1 NuR Gr Sen . * (8)
The MLCF was calculated directly when data on dry mass were shown for both green and senesced leaves. When just the percentage of leaf mass loss (LML) was shown, we calculate MLCF as
100 LM L 1
M LCF (9)
14
To calculate mean nutrient resorption ( NuR ) for different functional groups or the global dataset as a whole, and to assess the role of plant nutrient status on resorption efficiency, we used power law regressions according to Kobe et al. (2005):
Gr
Sen Nu
Nu* (10)
which corresponds to a linear regression in the logarithmic plot,
NuSen
log
log
NuGr
log * (11)
Combining Eqs (8) and (10) yields the following expression for NuR ,
1 Nu
100NuR Gr1 . (12)
For Eq. 12, a β value >1 indicates the cases where nutrient resorption efficiency
decreases with leaf nutrient status. In other words, when β>1, resorption is more efficient in green leaves that have low nutrient concentrations. In contrast, β<1 indicates higher resorption efficiency in nutrient-rich fresh leaves. Eq. (10) was used first to assess the mean nutrient resorption (NuR ) independently of nutrient status, with the β exponent was set to 1, resulting in a linear correlation. Second, we assessed the role of leaf nutrient status by determining β through nonlinear regression. This two-step regression allowed us to compare our results to the NuR values based on linear regression that are typically reported, while also considering, as a second-order approximation, the effect of nutrient status.
15
and y, as is generally the case, RMA should be used. OLS regression is based on the assumption that x-values are known exactly, while only the y-values (dependent variable) are subject to measurement error (Seim and Sæther 1983). In biological datasets, in contrast, x and y-values are often subject to measurement errors of comparable magnitude. Graphically, RMA minimizes perpendicular offsets, incorporating uncertainties of the data points along both x and y-axes. For purposes of comparison, we proceed with both regression types (I and II) analysis, but results from type II regression are shown here.
We calculated NuR for each nutrient for the dataset as a whole and for each plant type and climate group separately. To compare NuR for the entire dataset and for each vegetation type and climate group, we used 95% confidence intervals of the regressions. Differences in growth types as well as differences with 0 or 50% resorption cited throughout the text were assessed as non-overlapping 95% confidence intervals. Similarly, the average amounts of nutrients in green and senesced leaves are presented as mean content followed by 95% confidence intervals. To estimate relationships between NuR and climate variables (MAT and MAP) and latitude, we used Pearson correlations.
3. RESULTS
3.1 Leaf mass loss (LML) and mass-loss correction factors (MLCF)
16
(Eq. 9) and used it to correct nutrient resorption estimates for mass loss during senescence (Eqs. 8 and 12).
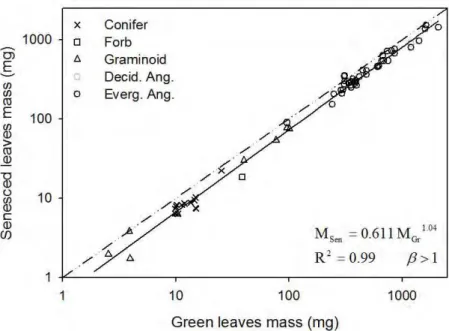
Figure 2. Leaf mass loss (LML) during senescence. Green leaves mass vs senesced
17
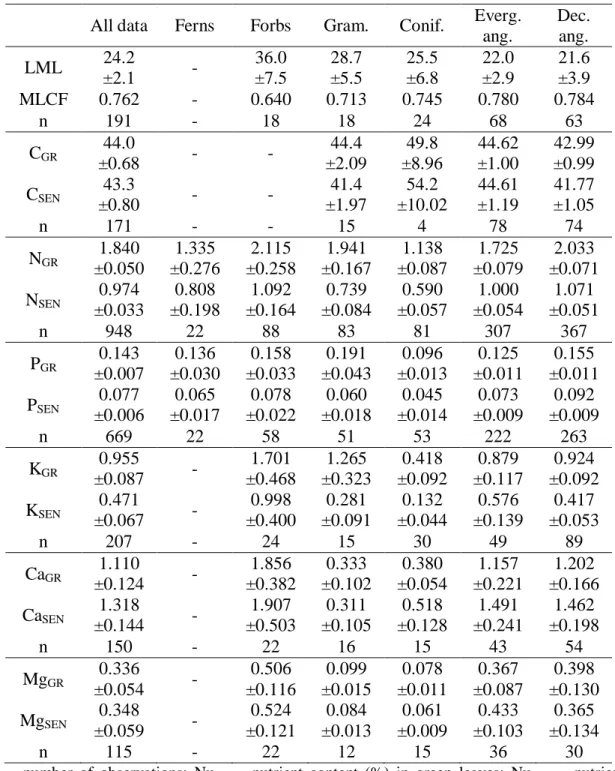
Table 2. Leaf mass loss (LML), mass loss correction factor (MLCF), and average C
and nutrients content (% dry mass) in green and senesced leaves (not corrected for mass loss), followed by 95% confidence interval, for the entire data set and for different plant growth types.
All data Ferns Forbs Gram. Conif. Everg. ang.
Dec. ang. LML 24.2
±2.1 -
36.0 ±7.5 28.7 ±5.5 25.5 ±6.8 22.0 ±2.9 21.6 ±3.9
MLCF 0.762 - 0.640 0.713 0.745 0.780 0.784
n 191 - 18 18 24 68 63
CGR 44.0
±0.68 - -
44.4 ±2.09 49.8 ±8.96 44.62 ±1.00 42.99 ±0.99 CSEN 43.3
±0.80 - -
41.4 ±1.97 54.2 ±10.02 44.61 ±1.19 41.77 ±1.05
n 171 - - 15 4 78 74
NGR 1.840 ±0.050 1.335 ±0.276 2.115 ±0.258 1.941 ±0.167 1.138 ±0.087 1.725 ±0.079 2.033 ±0.071 NSEN 0.974
±0.033 0.808 ±0.198 1.092 ±0.164 0.739 ±0.084 0.590 ±0.057 1.000 ±0.054 1.071 ±0.051
n 948 22 88 83 81 307 367
PGR 0.143 ±0.007 0.136 ±0.030 0.158 ±0.033 0.191 ±0.043 0.096 ±0.013 0.125 ±0.011 0.155 ±0.011 PSEN 0.077
±0.006 0.065 ±0.017 0.078 ±0.022 0.060 ±0.018 0.045 ±0.014 0.073 ±0.009 0.092 ±0.009
n 669 22 58 51 53 222 263
KGR 0.955
±0.087 -
1.701 ±0.468 1.265 ±0.323 0.418 ±0.092 0.879 ±0.117 0.924 ±0.092 KSEN 0.471
±0.067 -
0.998 ±0.400 0.281 ±0.091 0.132 ±0.044 0.576 ±0.139 0.417 ±0.053
n 207 - 24 15 30 49 89
CaGR 1.110
±0.124 -
1.856 ±0.382 0.333 ±0.102 0.380 ±0.054 1.157 ±0.221 1.202 ±0.166 CaSEN 1.318
±0.144 -
1.907 ±0.503 0.311 ±0.105 0.518 ±0.128 1.491 ±0.241 1.462 ±0.198
n 150 - 22 16 15 43 54
MgGR
0.336
±0.054 -
0.506 ±0.116 0.099 ±0.015 0.078 ±0.011 0.367 ±0.087 0.398 ±0.130 MgSEN 0.348
±0.059 -
0.524 ±0.121 0.084 ±0.013 0.061 ±0.009 0.433 ±0.103 0.365 ±0.134
n 115 - 22 12 15 36 30
n = number of observations; NuGR = nutrient content (%) in green leaves; NuSEN = nutrient
content (%) in senesced leaves (not corrected for mass loss); LML = leaf mass loss during senescence (%); and MLCF = mass loss correction factor (i.e., MLCF = (senesced leaf mass/green leaf mass)).
18
mean annual temperature (MAT), and mean annual precipitation (MAP), but showed no relationship with LML (see APPENDIX). SLA, leaf area and leaf mass showed negative correlations with latitude (P<0.001) but strong, positive correlations with MAT (P<0.01). Only leaf mass showed positive correlation with MAP (P<0.01).
3.2 Nutrient content and mean resorption efficiency ( NuR ) across plant functional
types
Across the global dataset of C, N, P, K, Ca, and Mg concentrations and plant growth forms, forbs always had the highest nutrient concentrations or among the highest for both green and senesced leaves (Table 2). In contrast, conifers generally had the lowest nutrient contents in both green and senesced leaves (Table 2). For NuR , graminoids were always among the growth types with the highest NuR while evergreen woody angiosperms typically had the lowest or close to lowestNuR .
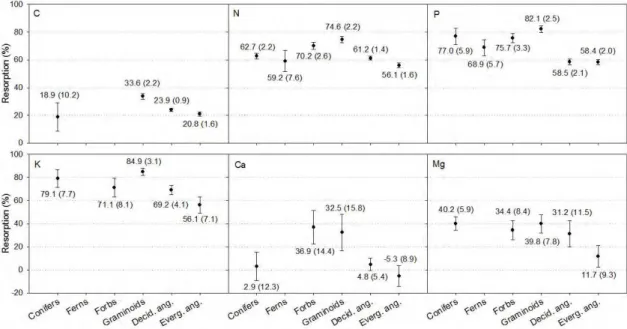
Mean N and P resorptions (NR , PR ) globally were 62.1% and 64.9%, respectively. These values are statistically greater than the typically assumed value of 50% (P<0.05; Figure 3). Within plant types, graminoids and forbs had the highest NR (74.6 and 70.2%, respectively) while evergreen woody angiosperms and ferns had the lowest values (56.1 and 59.2%, respectively) (Figure 4). For PR , evergreen and deciduous woody angiosperms had the lowest resorption (58.4 and 58.5%, respectively), whereas conifers and graminoids showed the highest PR (77.0 and 82.1%, respectively).
19
while evergreen woody angiosperms and forbs had the lowest KR (56.1 and 71.1%, respectively).
In general, C, Ca, and Mg showed a lower average resorption (23.2, 10.9, and 28.6%, respectively) compared with the other nutrients (Figure 3), and none of the three showed any evidence of enrichment during senescence. M gRwas found to be the most conservative and was statistically indistinguishable among all growth types except for evergreen woody angiosperms, which had the lowest value (P<0.05; 11.7%). CaR was statistically indistinguishable from 0% resorption for all woody species, but graminoids and forbs had CaR of 32.5 and 36.9%, respectively (P<0.05; Figure 4). For C, graminoids showed the highest mean resorption (33.6%) whereas conifers and evergreen woody angiosperms had the lowest values, 18.9 and 20.8%, respectively (Figure 4).
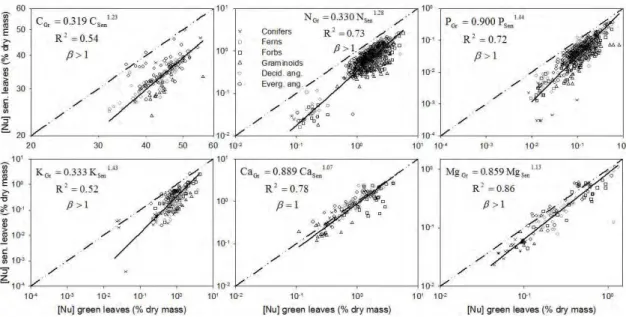
Figure 3. Linear regressions of nutrient content in green vs senesced leaves (corrected
20
Figure 4. Mean nutrient resorption by growth type for all nutrients studied. Values
under or above symbols are the mean nutrient resorption for each given point. Within parentheses are the 95% confidence intervals.
3.3 Nutrient content and mean nutrient resorption for N2 fixers and non-fixers.
21
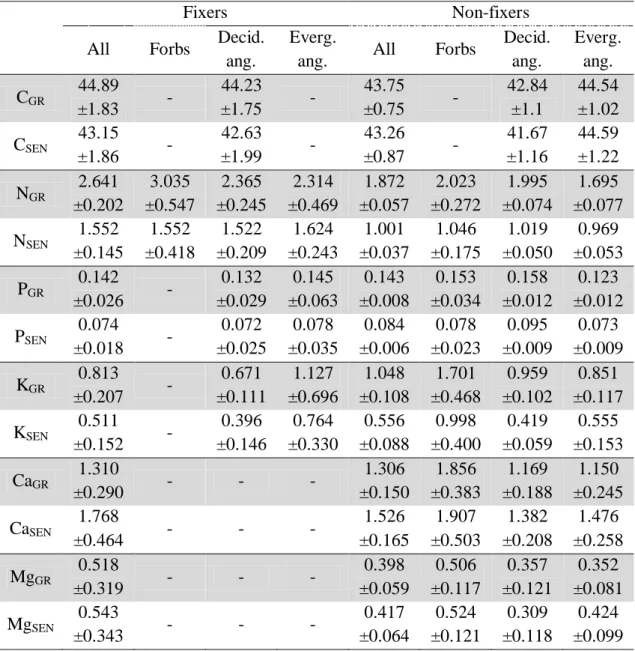
Table 3. Average C and nutrients content (% dry mass) in green and senesced leaves
(not corrected for mass loss) for N2 fixers and non-fixers species, followed by its 95% confidence interval.
Fixers Non-fixers
All Forbs Decid. ang.
Everg.
ang. All Forbs
Decid. ang. Everg. ang. CGR 44.89
±1.83 -
44.23
±1.75 -
43.75
±0.75 -
42.84 ±1.1
44.54 ±1.02 CSEN 43.15
±1.86 -
42.63
±1.99 -
43.26
±0.87 -
41.67 ±1.16 44.59 ±1.22 NGR 2.641 ±0.202 3.035 ±0.547 2.365 ±0.245 2.314 ±0.469 1.872 ±0.057 2.023 ±0.272 1.995 ±0.074 1.695 ±0.077 NSEN 1.552
±0.145 1.552 ±0.418 1.522 ±0.209 1.624 ±0.243 1.001 ±0.037 1.046 ±0.175 1.019 ±0.050 0.969 ±0.053 PGR 0.142
±0.026 -
0.132 ±0.029 0.145 ±0.063 0.143 ±0.008 0.153 ±0.034 0.158 ±0.012 0.123 ±0.012 PSEN 0.074
±0.018 -
0.072 ±0.025 0.078 ±0.035 0.084 ±0.006 0.078 ±0.023 0.095 ±0.009 0.073 ±0.009 KGR 0.813
±0.207 -
0.671 ±0.111 1.127 ±0.696 1.048 ±0.108 1.701 ±0.468 0.959 ±0.102 0.851 ±0.117 KSEN 0.511
±0.152 -
0.396 ±0.146 0.764 ±0.330 0.556 ±0.088 0.998 ±0.400 0.419 ±0.059 0.555 ±0.153 CaGR 1.310
±0.290 - - -
1.306 ±0.150 1.856 ±0.383 1.169 ±0.188 1.150 ±0.245 CaSEN 1.768
±0.464 - - -
1.526 ±0.165 1.907 ±0.503 1.382 ±0.208 1.476 ±0.258 MgGR 0.518
±0.319 - - -
0.398 ±0.059 0.506 ±0.117 0.357 ±0.121 0.352 ±0.081 MgSEN 0.543
±0.343 - - -
0.417 ±0.064 0.524 ±0.121 0.309 ±0.118 0.424 ±0.099
22
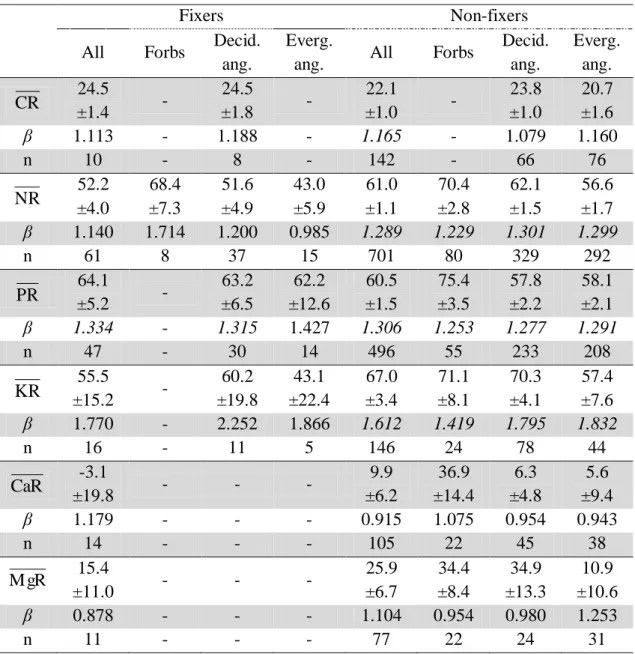
Table 4. Mean C and nutrients resorption (corrected for mass loss; followed by its 95%
confidence interval) and β coefficients for N2 fixers and non-fixers species.
Fixers Non-fixers
All Forbs Decid. ang.
Everg.
ang. All Forbs
Decid. ang.
Everg. ang. CR 24.5
±1.4 -
24.5
±1.8 -
22.1
±1.0 -
23.8 ±1.0
20.7 ±1.6
β 1.113 - 1.188 - 1.165 - 1.079 1.160
n 10 - 8 - 142 - 66 76
NR 52.2 ±4.0 68.4 ±7.3 51.6 ±4.9 43.0 ±5.9 61.0 ±1.1 70.4 ±2.8 62.1 ±1.5 56.6 ±1.7 β 1.140 1.714 1.200 0.985 1.289 1.229 1.301 1.299
n 61 8 37 15 701 80 329 292
PR ±5.2 64.1 - ±6.5 63.2 ±12.6 62.2 ±1.5 60.5 75.4 ±3.5 57.8 ±2.2 ±2.1 58.1
β 1.334 - 1.315 1.427 1.306 1.253 1.277 1.291
n 47 - 30 14 496 55 233 208
KR 55.5
±15.2 -
60.2 ±19.8 43.1 ±22.4 67.0 ±3.4 71.1 ±8.1 70.3 ±4.1 57.4 ±7.6 β 1.770 - 2.252 1.866 1.612 1.419 1.795 1.832
n 16 - 11 5 146 24 78 44
CaR ±19.8 -3.1 - - - ±6.2 9.9 ±14.4 36.9 ±4.8 6.3 ±9.4 5.6
β 1.179 - - - 0.915 1.075 0.954 0.943
n 14 - - - 105 22 45 38
M gR 15.4
±11.0 - - -
25.9 ±6.7 34.4 ±8.4 34.9 ±13.3 10.9 ±10.6
β 0.878 - - - 1.104 0.954 0.980 1.253
n 11 - - - 77 22 24 31
β coefficients in italic are significant different from 1 (P<0.05), and n = number of data points.
3.4 Resorption efficiency and plant nutrient status
23
Figure 5. Power law regression analysis (Eq. 10) of C and nutrients content in green vs
senesced leaves (corrected for mass loss) for the global data set on a log scale. β different from 1 means that the relationship between NuSen and NuGreen is not linear, with β>1 indicating decreased resorption efficiency with increasing leaf nutrient status.
24
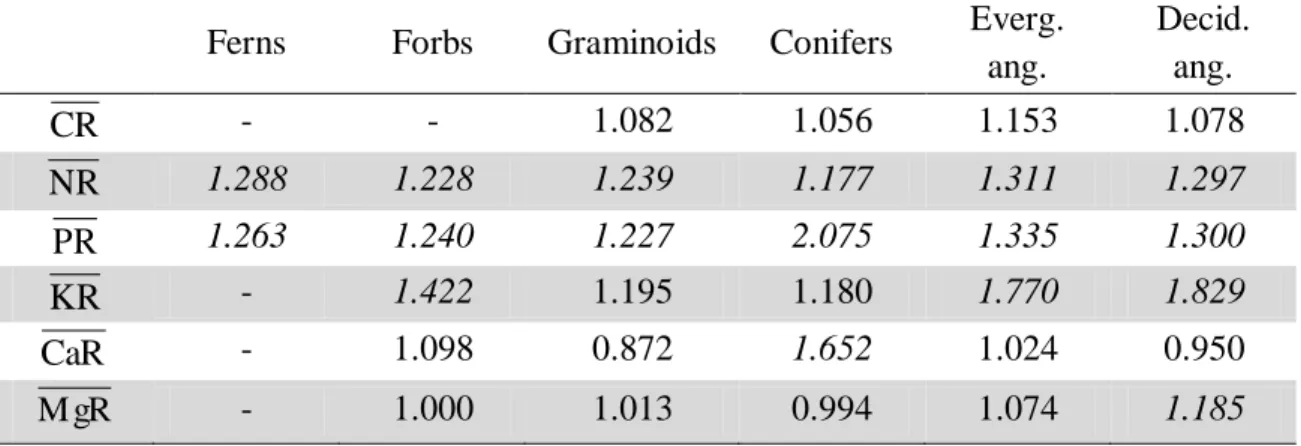
Table 5. β coefficients for the entire data set and for different growth types. These β coefficients are obtained from the power law regression Nu*Sen NuGr (Eq. 10). β different from 1 means that the relationship between NuSen and NuGreen is not linear, with β > 1 indicating decreased resorption efficiency with increasing leaf nutrient status.
Ferns Forbs Graminoids Conifers Everg. ang.
Decid. ang.
CR - - 1.082 1.056 1.153 1.078
NR 1.288 1.228 1.239 1.177 1.311 1.297
PR 1.263 1.240 1.227 2.075 1.335 1.300
KR - 1.422 1.195 1.180 1.770 1.829
CaR - 1.098 0.872 1.652 1.024 0.950
M gR - 1.000 1.013 0.994 1.074 1.185
Values in italic are significantly different from 1 (P<0.05).
Table 6. β coefficients for different climate groups. These β coefficients are obtained from the power law regression of Eq. (10) (NuSen* NuGr ). β different from 1 means that the relationship between NuSen and NuGreen is not linear, with β>1 indicating decreased resorption efficiency with increasing leaf nutrient status.
Koppen A Koppen B Koppen C Koppen D Koppen E
CR 1.110 1.365 1.163 - -
NR 1.233 1.392 1.303 1.223 1.237
PR 1.445 2.539 1.619 1.371 1.495
KR 1.114 0.660 1.241 1.542 1.107
CaR 0.878 0.997 1.245 1.455 0.863
M gR 0.992 0.705 1.281 0.748 0.944
Values in italic are significantly different from 1 (P<0.05). “ns” means non-significant.
3.5 Resorption efficiency along climatic gradients
25
with precipitation (P<0.001) but not with temperature. The opposite was true for M gR, which showed a negative relationship with temperature (P<0.001), but no correlation with precipitation. CaR was the only variable to show a small but positive correlation with temperature (P<0.05) and no correlation with precipitation.
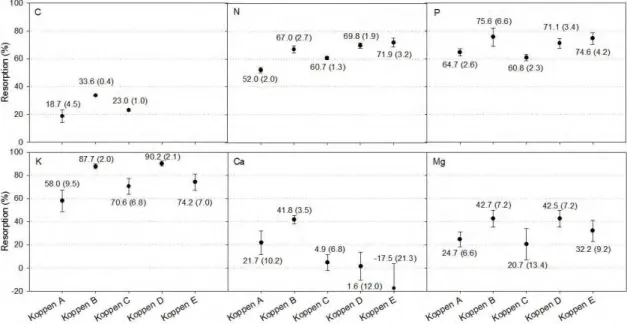
Figure 6. Mean nutrient resorption by climate for all nutrients studied. Values under or
above symbols are the mean nutrient resorption for each given point. Within parentheses are the 95% confidence intervals. Koppen’s groups are described in detail in the Methods, with: A – Tropical; B – Dry (arid and semiarid) climates); C – Temperate climates; D – Continental and; E – Polar climates.
26
Table 6 compares β exponents among climates. Temperate and continental climates (Koppen C and D, respectively) showed β>1 for all nutrients, except Mg. In contrast, tropical, dry, and polar climates (Koppen A, B, and E, respectively) showed β>1 only for N and P resorption (P<0.05). The high β value of 2.54 for P resorption in
dry climates (Koppen B) shows that PR depends strongly on green leaves P status in this environment.
4. DISCUSSION
4.1 Nutrient-resorption efficiency patterns 4.1.1 Mass loss during senescence
Our results provide new insights for C, N, and P resorption that build upon earlier work (Aerts 1996, Kobe et al. 2005, Yuan and Chen 2009a, b) and that provide to our knowledge the first global estimates for K, Ca, and Mg resorption. Unlike the often cited 50% NR and PR found in the literature (Aerts 1996, Yuan et al. 2005, Huang et al. 2007, Yuan and Chen 2009a, Kilic et al. 2010), we estimate that NR and PR for terrestrial plants in general are 62.1% and 64.9%, respectively (Figure 3). The major difference between our estimates and this former 50% value arise from the fact that we took into account mass loss (and thus the change in measurement basis) that occurs during senescence. Ignoring this leads to an underestimation of nutrient resorption of ~10% (van Heerwaarden et al. 2003). Mass loss can be caused by several processes, including leaching and translocation before abscission, and is affected by different environmental factors such as rainfall, temperature, and nutrient status of a plant. Here we discuss how such diverse factors might affect mass loss and consequently resorption estimates.
27
from plants, K, Ca and Mg are usually leached in the greatest quantities (Tukey Jr. 1970). Despite the potential importance of leaching, especially in wetter climates, there is fairly strong evidence showing that leaching has very little influence on leaf nutrient pool depletion during senescence, at least for N and P (Freschet et al. 2010). One of the reasons why leaching appears to affect nutrient absorption estimates only marginally is the short duration of senescence and abscission, which does not allow substantial leaching to occur. If leaching played a prominent role in nutrient resorption during senescence, we would expect nutrient resorption to show a positive correlation with mean annual precipitation. In contrast, our data show no correlation between mean annual precipitation and CaR and M gR and this correlation was even negative for
CR , NR , PR , and KR (APPENDIX). This result lends further support to the hypothesis that leaching is not significantly affecting resorption efficiency of the nutrients, at least at the large scales we are investigating.
Besides leaching and resorption, mass loss may also be caused by decomposition and photo-degradation. Even high quality, nutrient-rich leaves, which can be easily degraded by decomposers, generally require at least two weeks under ideal environmental conditions for leaf mass loss to start occurring (Palm and Sanchez 1990, Berg and McClaugherty 2007). Photochemical mineralization of organic material can be an important factor that controls carbon turnover, causing loss of up to 60% of the whole mass in water-limited ecosystems (Austin and Vivanco 2006). Similarly to in-situ decomposition, however, photo-degradation is a slow process when compared to leaf senescence and abscission. As a consequence, if decomposition and/or photo-degradation take place on the leaf mass loss during senescence, their contribution should be small, given the frame time of senescence.
28
trees in fact compares well with 30-35% and 20-25% LML in the same broad plant groups.
4.1.2 Nutrient content and resorption efficiency for plant functional types
29
there are indeed important differences in nutrient concentrations and resorption, but that these differences are not universal.
Although Aerts (1996) concluded that there were at best minor differences in nutrient resorption efficiency between plant growth types, our results show that these differences can be large, as in the case of K, for which graminoids showed 84.9% KR and evergreen woody angiosperms 56.1% KR (Figure 4). In fact, graminoids had among the highest resorptions of all nutrients examined, followed by conifers and forbs. The largest differences observed were for N, P, and K, where graminoids had 74.6% NR , 82.1% PR , and 84.9% KR , much higher than the average of 50% typically assumed in most terrestrial models for N and P (Table 1) and reported by Yuan & Chen (2009a) for both conifers and broadleaf species.
Ca is known to be a structural element in plants, particularly in cell walls, that tends to be resorbed little during senescence (Tukey Jr. 1970, Lambers et al. 1998, Kazakou et al. 2007). Previous research has suggested that Ca is generally conserved in leaves (van Heerwaarden et al. 2003). In contrast, our data showed, on average, a 10.9% CaR during senescence (Figure 3). While conifers and deciduous and evergreen woody angiosperms showed a CaR statistically indistinguishable from zero, forbs and graminoids showed 36.9 and 32.5% CaR , respectively (Figure 4). Hence, these results show that Ca is not a sufficiently conservative measurement basis and thus should not be used to estimate unbiased resorption efficiencies.
4.1.3 Resorption efficiency and nutrient status
30
increasing leaf nutrient status. Our power-law regression analysis confirmed that C, N, P, K, and Mg resorption are more efficient in green leaves that have low nutrient concentrations (β>1) and showed that Ca resorption is independent of Ca status (β=1; Table 5 and Figure 5). From the perspective of leaf economics, this pattern of more efficient resorption at low nutrient concentrations is expected, corroborating the notion that plants will use the least energetically costly process to acquire nutrients.
Overall C resorption had β>1, suggesting increased C resorption in C-poor leaves (Tables 5 and 6). If relative changes in leaf C concentrations were mainly due to different concentration of non-structural carbohydrates (NSC), C resorption would be expected to be correlated to NSC content. Also, C resorption should show β>1 for all plant types, as NSC are relatively easily resorbed. Concentrations of NSC have been found to decrease with mean growing-season temperature, ranging from treeline conifers (NSC ~18% dry mass, 8 oC) to tropical lowlands (~6% NSC; 27 oC), with an average value for trees of ~11% (Körner 2003). Herbaceous plants and shrubs show an average of 15.3% NSC content in leaves. An upper limit of NSC content in leaves was found to be 23% (Körner and Miglietta 1994). If NSC were the main C compounds being resorbed, this upper NSC value of ~25% should mirror the upper theoretical limit for C resorption. Given that starch (C6H10O5) and sugars (C6H12O6) are the main NSC compounds in leaves (Taiz and Zeiger 2002), and they have an average C concentration of 42%, an upper limit of 25% NSC results in a potential maximum ~10% C resorption. Our data show an average C resorption of 23.2% and a β value slightly larger than one,
thus corroborating the hypothesis that NSC is responsible for less than 50% of C resorption.
31
greater than one. In only one case did β reach a negative value – Mg resorption in continental climates. From a leaf economics perspective, all nutrients for which uptake from the soil is more energy-demanding than resorption would be expected to show β>1.
4.1.4 Resorption efficiency and climate
Our analysis contrasts with some of the conclusions of Yuan & Chen (2009a), who found that N resorption increased with latitude but decreased with MAT and MAP, with P resorption showing opposite relationships. We found significant and similar, rather than contrasting, climate trends for N and P. Both nutrients correlated negatively with MAT and MAP, and positively with latitude (APPENDIX). This pattern of negative relationships between NuR and MAT and MAP, and a positive relationship between NuR and latitude, was found in almost all climates and growth types.
32
4.2 Ecological consequences of observed patterns in resorption efficiency
Source-sink interactions within a plant may strongly influence nutrient
resorption (Nambiar and Fife 1987, Chapin and Moilanen 1991, Buchanan-Wollaston
1997, Watson and Lu 2004). Leaf senescence could be repressed, or even reversed,
when developing sinks are removed (Crafts-Brandner 1991). When leaf senescence occurs relatively early in the growing season, mineral nutrients, particularly N, can be reallocated to other simultaneous growth processes (stronger sinks and more resorption), but at the expense of potential C acquisition by those leaves. Conversely, when leaves senesce later in the season, the period for assimilate acquisition is longer, at the expense of nutrient reallocation to other developing structures (weaker sinks, less resorption). By having an active growth of new leaves (a strong sink) at the time of leaf senescence, both graminoids and evergreens were predicted to have relatively high nutrient resorption efficiency (Lambers et al. 1998). This explains why graminoids
showed the highest NuR, although evergreens did not (Figure 4). Beside graminoids, our results showed that only conifers similarly showed such high NuR values, at least for P, K, and Mg.
According to Lambers et al. (1998), nutrient conservation strategies differ between broad-leaved deciduous and conifer species. Conifers typically have lower nutrient concentrations in leaves and relatively higher investments in C-rich compounds, while broad-leaved deciduous species tend to be characterized by higher N, P, and K concentrations in mature leaves and higher N resorption (Lambers et al. 1998). We found that conifer species indeed have lower nutrient concentrations in leaves and differed from angiosperms in leaf nutrient concentration and NuR parameters (Figure 4 and Table 2). However, we did not find evergreen woody
angiosperms to be intermediate between conifers and deciduous species, as suggested
33
very similar nutrient concentrations in leaves and very similar NuR values. The difference between the two groups was in C, N, and K resorption (P<0.05), which was
significantly higher for deciduous (23.9, 61.2, and 69.2% NuR , respectively) than for evergreen species (20.8, 56.1, and 56.1% NuR, respectively).
A simple model to explain the dominance of low-productive perennials in
nutrient-poor habitats over high-productive perennials has been proposed (Aerts and
van der Peijl 1993). They showed that, in nutrient-poor environments, nutrient
conserving species can have a higher equilibrium biomass than species with higher
nutrient losses. This means that nutrient conservation strategies like high resorption at
senescence lead to a direct advantage in nutrient-poor environments. Our data show
that graminoids would be the species best adapted to nutrient-poor environments,
followed by conifers and forbs, and lastly by evergreen and deciduous woody
angiosperms.
Conservation strategies different from improved resorption efficiency might
also be important (Hobbie 1992), and could partly explain the lack of correlation
between NuR and climatic and soil nutrient conditions. For example, increased leaf
lifespan and lower nutrient concentrations (e.g., Aerts and Chapin 2000) could both
contribute to higher overall nutrient use efficiency.
4.3 Implications for terrestrial ecosystem modeling
34
Because the quality of leaves in senescence, the final step of nutrient cycling at the leaf level, is the initial condition for litter decomposition, our NuR parameters provide important information for bridging plant and soil carbon and nutrient cycling.
35 5. CONCLUSIONS
Our newly assembled database of nutrient contents in green and senesced leaves worldwide allowed us to compute resorption efficiencies across plant types and climates, accounting for mass loss during senescence. We show here a consistent pattern of leaf mass loss during senescence in terrestrial plants and how neglecting it can lead to an underestimation of nutrient resorption. Based on our global database, overall C, N, P, K, and Mg resorption is nutrient-status dependent, with relatively more nutrients resorbed for lower leaf nutrient concentrations, in agreement with a leaf economics perspective. Overall, our new global estimates for nutrient concentrations and resorption efficiencies should improve models that explicitly represent the cycling of C and nutrients, particularly N and P. They should also allow the modeling community to represent more explicitly the coupling of other nutrient cycles within plants and ecosystems.
6. ACKNOWLEDGEMENTS
36 7. REFERENCES
Aber, J. D., J. M. Melillo, K. J. Nadelhoffer, J. Pastor, and R. D. Boone. 1991. Factors controlling nitrogen cycling and nitrogen saturation in northern temperate forest ecosystems. Ecological Applications 1:303-315.
Aerts, R. 1990. Nutrient use efficiency in evergreen and deciduous species from heathlands. Oecologia 84:391-397.
Aerts, R. 1996. Nutrient resorption from senescing leaves of perennials: are there general patterns? Journal of Ecology 84:597-608.
Aerts, R. 1997. Climate, leaf litter chemistry and leaf litter decomposition in terrestrial ecosystems: A triangular relationship. Oikos 79:439-449.
Aerts, R., and F. S. Chapin. 2000. The mineral nutrition of wild plants revisited: a re-evaluation of processes and patterns. Advances in ecological research 30:1-67. Aerts, R., and M. J. van der Peijl. 1993. A simple model to explain the dominance of
low-productive perennials in nutrient-poor habitats. Oikos 66:144-147.
Austin, A. T., and L. Vivanco. 2006. Plant litter decomposition in a semi-arid ecosystem controlled by photodegradation. Nature 442:555-558.
Axelrod, D. I. 1966. Origin of deciduous and evergreen habits in temperate forests. Evolution 20:1-15.
Baisden, W. T., and R. Amundson. 2003. An analytical approach to ecosystem biogeochemistry modeling. Ecological Applications 13:649-663.
Berg, B., and C. McClaugherty. 2007. Plant litter. Decomposition, humus formation, carbon sequestration. 2nd edition. Springer-Verlag.
37
Buamscha, G., M. Gobbi, M. J. Mazzarino, and F. Laos. 1998. Indicators of nitrogen conservation in Austrocedrus chilensis forests along a moisture gradient in Argentina. Forest Ecology and Management 112:253-261.
Buchanan-Wollaston, V. 1997. The molecular biology of leaf senescence. Journal of Experimental Botany 48:181-199.
Cai, Z. Q., and F. Bongers. 2007. Contrasting nitrogen and phosphorus resorption efficiencies in trees and lianas from a tropical montane rain forest in Xishuangbanna, south-west China. Journal of Tropical Ecology 23:115-118. Cartaxana, P., and F. Catarino. 2002. Nitrogen resorption from senescing leaves of
three salt marsh plant species. Plant Ecology 159:95-102.
Chapin, F. S. 1980. The mineral nutrition of wild plants. Annual Review of Ecology and Systematics 11:233-260.
Chapin, F. S., and L. Moilanen. 1991. Nutritional controls over nitrogen and phosphorus resorption from Alaskan birch leaves. Ecology 72:709-715.
Comins, H. N., and R. E. McMurtrie. 1993. Long-term response of nutrient-limited forests to CO2 enrichment; equilibrium behavior of plant-soil models. Ecological Applications 3:666-681.
Crafts-Brandner, S. J. 1991. Nonstructural carbohydrate metabolism during leaf ageing in tobacco (Nicotiana tabacum). Physiologia Plantarum 82:299-305.
Daufresne, T., and M. Loreau. 2001. Ecological stoichiometry, primary producer-decomposer interactions, and ecosystem persistence. Ecology 82:3069-3082. Diehl, P., M. J. Mazzarino, F. Funes, S. Fontenla, M. Gobbi, and J. Ferrari. 2003.
38
Eckstein, R. L., P. S. Karlsson, and M. Weih. 1999. Leaf life span and nutrient resorption as determinants of plant nutrient conservation in temperate-arctic regions. New Phytologist 143:177-189.
Freschet, G. T., J. H. C. Cornelissen, R. S. P. van Logtestijn, and R. Aerts. 2010. Substantial nutrient resorption from leaves, stems and roots in a subarctic flora: what is the link with other resource economics traits? New Phytologist 186:879-889.
Friend, A. D., A. K. Stevens, R. G. Knox, and M. G. R. Cannell. 1997. A process-based, terrestrial biosphere model of ecosystem dynamics (Hybrid v3.0). Ecological Modelling 95:249-287.
Gleason, S. M., and A. Ares. 2007. Foliar resorption in tree species.in A. K. Scaggs, editor. New Research on Forest Ecology. Nova Science Publishers, New York. Gordon, W. S., and R. B. Jackson. 2000. Nutrient concentrations in fine roots. Ecology
81:275-280.
Hobbie, S., and L. Gough. 2002. Foliar and soil nutrients in tundra on glacial landscapes of contrasting ages in northern Alaska. Oecologia 131:453-462. Hobbie, S. E. 1992. Effects of plant species on nutrient cycling. Trends in Ecology &
Evolution 7:336-339.
Huang, J., X. Wang, and E. Yan. 2007. Leaf nutrient concentration, nutrient resorption and litter decomposition in an evergreen broad-leaved forest in eastern China. Forest Ecology and Management 239:150-158.
39
Jackson, R. B., H. A. Mooney, and E. D. Schulze. 1997. A global budget for fine root biomass, surface area, and nutrient contents. Proceedings of the National Academy of Sciences of the United States of America 94:7362-7366.
Jackson, R. B., H. J. Schenk, E. G. Jobbágy, J. Canadell, G. D. Colello, R. E. Dickinson, C. B. Field, P. Friedlingstein, M. Heimann, K. Hibbard, D. W. Kicklighter, A. Kleidon, R. P. Neilson, W. J. Parton, O. E. Sala, and M. T. Sykes. 2000. Belowground consequences of vegetation change and their treatment in models. Ecological Applications 10:470-483.
Kazakou, E., E. Garnier, M. L. Navas, C. Roumet, C. Collin, and G. Laurent. 2007. Components of nutrient residence time and the leaf economics spectrum in species from Mediterranean old-fields differing in successional status. Functional Ecology 21:235-245.
Kilic, D., H. G. Kutbay, T. Ozbucak, and R. Huseyinova. 2010. Foliar resorption in Quercus petraea subsp. iberica and Arbutus andrachne along an elevational gradient. Annals of Forest Science 67:213.
Killingbeck, K. T. 1996. Nutrients in senesced leaves: keys to the search for potential resorption and resorption proficiency. Ecology 77:1716-1727.
Killingbeck, K. T., and W. G. Whitford. 2001. Nutrient resorption in shrubs growing by design, and by default in Chihuahuan Desert arroyos. Oecologia 128:351-359. Kobe, R. K., C. A. Lepczyk, and M. Iyer. 2005. Resorption efficiency decreases with
increasing green leaf nutrients in a global data set. Ecology 86:2780-2792. Körner, C. 2003. Carbon limitation in trees. Journal of Ecology 91:4-17.
40
Kottek, M., J. Grieser, C. Beck, B. Rudolf, and F. Rubel. 2006. World map of the Koppen-Geiger climate classification updated. Meteorologische Zeitschrift
15:259-263.
Kucharik, C. J., J. A. Foley, C. Delire, V. A. Fisher, M. T. Coe, J. D. Lenters, C. Young-Molling, N. Ramankutty, J. M. Norman, and S. T. Gower. 2000. Testing the performance of a dynamic global ecosystem model: water balance, carbon balance, and vegetation structure. Global Biogeochemical Cycles 14:795-825. Lal, C. B., C. Annapurna, A. S. Raghubanshi, and J. S. Singh. 2001. Effect of leaf habit
and soil type on nutrient resorption and conservation in woody species of a dry tropical environment. Canadian Journal of Botany 79:1066-1075.
Lambers, H., F. S. Chapin, and T. L. Pons. 1998. Plant physiological ecology. 2nd edition. Springer-Verlag, New York.
Manzoni, S., R. B. Jackson, J. A. Trofymow, and A. Porporato. 2008. The global stoichiometry of litter nitrogen mineralization. Science 321:684-686.
Manzoni, S., J. A. Trofymow, R. B. Jackson, and A. Porporato. 2010. Stoichiometric controls on carbon, nitrogen, and phosphorus dynamics in decomposing litter. Ecological Monographs 80:89-106.
McGill, W. B., H. W. Hunt, R. G. Woodmansee, and J. O. Reuss. 1981. Phoenix, a model of the dynamics of carbon and nitrogen in grassland soils. Pages 49-115 in F. E. Clark and T. Rosswall, editors. Ecological Bulletins, Stockholm.
McGroddy, M. E., T. Daufresne, and L. O. Hedin. 2004. Scaling of C:N:P stoichiometry in forests worldwide: implications of terrestrial Redfield-type ratios. Ecology 85:2390-2401.
41
Monk, C. D. 1966. An ecological significance of evergreenness. Ecology 47:504-505. Nambiar, E. K. S., and D. N. Fife. 1987. Growth and nutrient retranslocation in needles
of radiata pine in relation to nitrogen supply. Annals of Botany 60:147-156. Niklas, K. J. 2006. Plant allometry, leaf nitrogen and phosphorus stoichiometry, and
interspecific trends in annual growth rates. Annals of Botany 97:155-163. Palm, C. A., and P. A. Sanchez. 1990. Decomposition and nutrient release patterns of
the leaves of three tropical legumes. Biotropica 22:330-338.
Parton, W., W. L. Silver, I. C. Burke, L. Grassens, M. E. Harmon, W. S. Currie, J. Y. King, E. C. Adair, L. A. Brandt, S. C. Hart, and B. Fasth. 2007. Global-scale similarities in nitrogen release patterns during long-term decomposition. Science 315:361-364.
Parton, W. J., J. M. O. Scurlock, D. S. Ojima, T. G. Gilmanov, R. J. Scholes, D. S. Schimel, T. Kirchner, J. C. Menaut, T. Seastedt, E. Garcia Moya, A. Kamnalrut, and J. I. Kinyamario. 1993. Observations and modeling of biomass and soil organic matter dynamics for the grassland biome worldwide. Global Biogeochemical Cycles 7:785-809.
Pastor, J., and W. Post. 1986. Influence of climate, soil moisture, and succession on forest carbon and nitrogen cycles. Biogeochemistry 2:3-27.
Potter, C. S., J. T. Randerson, C. B. Field, P. A. Matson, P. M. Vitousek, H. A. Mooney, and S. A. Klooster. 1993. Terrestrial ecosystem production: a process model based on global satellite and surface data. Global Biogeochemical Cycles
7:811-841.
42
Rastetter, E. B., M. G. Ryan, G. R. Shaver, J. M. Melillo, K. J. Nadelhoffer, J. E. Hobbie, and J. D. Aber. 1991. A general biogeochemical model describing the responses of the C and N cycles in terrestrial ecosystems to changes in CO2, climate, and N deposition. Tree Physiology 9:101-126.
Rastetter, E. B., and G. R. Shaver. 1992. A model of multiple-element limitation for acclimating vegetation. Ecology 73:1157-1174.
Reich, P. B., D. S. Ellsworth, and C. Uhl. 1995. Leaf carbon and nutrient assimilation and conservation in species of differing successional status in an oligotrophic Amazonian forest. Functional Ecology 9:65-76.
Reich, P. B., M. B. Walters, and D. S. Ellsworth. 1992. Leaf life-span in relation to leaf, plant, and stand characteristics among diverse ecosystems. Ecological Monographs 62:365-392.
Richter, D. D., and L. I. Babbar. 1991. Soil diversity in the tropics. Pages 315-389 in M. Begon, A. H. Fitter, and A. Macfadyen, editors. Advances in Ecological Research. Academic Press.
Running, S. W., and S. T. Gower. 1991. FOREST-BGC, A general model of forest ecosystem processes for regional applications. II. Dynamic carbon allocation and nitrogen budgets. Tree Physiology 9:147-160.
Schwinning, S., and A. J. Parsons. 1996. Analysis of the coexistence mechanisms for grasses and legumes in grazing systems. Journal of Ecology 84:799-813.
Seim, E., and B. E. Sæther. 1983. On rethinking allometry: which regression model to use? Journal of Theoretical Biology 104:161-168.
43
Taiz, L., and E. Zeiger. 2002. Plant Physiology. 3rd edition. Sinauer Associates, Inc., Sunderland, MA.
Tateno, M., and F. S. Chapin. 1997. The logic of carbon and nitrogen interactions in terrestrial ecosystems. The American Naturalist 149:723-744.
Thornley, J. H. M., and E. L. J. Verberne. 1989. A model of nitrogen flows in grassland. Plant, Cell and Environment 12:863-886.
Thornton, P. E., J. F. Lamarque, N. A. Rosenbloom, and N. M. Mahowald. 2007. Influence of carbon-nitrogen cycle coupling on land model response to CO2 fertilization and climate variability. Global Biogeochemical Cycles 21:GB4018. Tukey Jr., H. B. 1970. The leaching of substrates from plants. Annual Review of Plant
Physiology 21:20.
van Dam, D., and N. van Breemen. 1995. NICCE: a model for cycling of nitrogen and carbon isotopes in coniferous forest ecosystems. Ecological Modelling 79:255-275.
van Heerwaarden, L. M., S. Toet, and R. Aerts. 2003. Current measures of nutrient resorption efficiency lead to a substantial underestimation of real resorption efficiency: facts and solutions. Oikos 101:664-669.
Vitousek, P. M. 1984. Litterfall, nutrient cycling, and nutrient limitation in tropical forests. Ecology 65:285-298.
Wang, Y. P., B. Z. Houlton, and C. B. Field. 2007. A model of biogeochemical cycles of carbon, nitrogen, and phosphorus including symbiotic nitrogen fixation and phosphatase production. Global Biogeochemical Cycles 21:GB1018.
44
White, M. A., P. E. Thornton, S. W. Running, and R. R. Nemani. 2000. Parameterization and sensitivity analysis of the BIOME–BGC terrestrial ecosystem model: net primary production controls. Earth Interactions 4:1-85. Wright, I. J., P. B. Reich, M. Westoby, D. D. Ackerly, Z. Baruch, F. Bongers, J.
Cavender-Bares, T. Chapin, J. H. C. Cornelissen, M. Diemer, J. Flexas, E. Garnier, P. K. Groom, J. Gulias, K. Hikosaka, B. B. Lamont, T. Lee, W. Lee, C. Lusk, J. J. Midgley, M. L. Navas, U. Niinemets, J. Oleksyn, N. Osada, H. Poorter, P. Poot, L. Prior, V. I. Pyankov, C. Roumet, S. C. Thomas, M. G. Tjoelker, E. J. Veneklaas, and R. Villar. 2004. The worldwide leaf economics spectrum. Nature 428:821-827.
Wright, I. J., and M. Westoby. 2003. Nutrient concentration, resorption and lifespan: leaf traits of Australian sclerophyll species. Functional Ecology 17:10-19. Yang, X., V. Wittig, A. K. Jain, and W. Post. 2009. Integration of nitrogen cycle
dynamics into the Integrated Science Assessment Model for the study of terrestrial ecosystem responses to global change. Global Biogeochemical Cycles
23:GB4029.
Yuan, Z. Y., and H. Y. H. Chen. 2009a. Global-scale patterns of nutrient resorption associated with latitude, temperature and precipitation. Global Ecology and Biogeography 18:11-18.
Yuan, Z. Y., and H. Y. H. Chen. 2009b. Global trends in senesced-leaf nitrogen and phosphorus. Global Ecology and Biogeography 18:532-542.
Yuan, Z. Y., L. H. Li, X. G. Han, J. H. Huang, G. M. Jiang, S. Q. Wan, W. H. Zhang, and Q. S. Chen. 2005. Nitrogen resorption from senescing leaves in 28 plant species in a semi-arid region of northern China. Journal of Arid Environments
45 8. APPENDIX
Table A1. Number of datapoints.
C N P K Ca Mg LML
Total 171 948 669 207 150 115 191
Conifers 4 81 53 30 15 15 24
Ferns 0 22 22 0 0 22 0
Forbs 0 88 58 24 22 0 18
Graminoids 15 83 51 15 16 12 18
Dec. ang. 75 363 260 89 54 30 63
Ev. ang. 77 302 218 49 43 36 68
Koppen A 12 177 154 49 47 44 -
Koppen B 8 76 13 8 8 8 -
Koppen C 149 484 351 84 66 34 -
Koppen D 2 165 110 53 16 16 -
46
51 List of references containing data used in this study
Allison, S. D., and P. M. Vitousek. 2004. Rapid nutrient cycling in leaf litter from invasive plants in Hawai’i. Oecologia 141:612-619.
Bertiller, M., M. Mazzarino, A. Carrera, P. Diehl, P. Satti, M. Gobbi, and C. Sain. 2006. Leaf strategies and soil N across a regional humidity gradient in Patagonia. Oecologia 148:612-624.
Blanco, J. A., J. B. Imbert, and F. J. Castillo. 2009. Thinning affects nutrient resorption and nutrient-use efficiency in two Pinus sylvestris stands in the Pyrenees. Ecological Applications 19:682-698.
Boerner, R. E. J. 1984. Foliar nutrient dynamics and nutrient use efficiency of four deciduous tree species in relation to site fertility. Journal of Applied Ecology
21:1029-1040.
Bowman, W. D., T. A. Theodose, and M. C. Fisk. 1995. Physiological and production responses of plant growth forms to increases in limiting resources in alpine tundra: implications for differential community response to environmental change. Oecologia 101:217-227.
Cai, Z. Q., and F. Bongers. 2007. Contrasting nitrogen and phosphorus resorption efficiencies in trees and lianas from a tropical montane rain forest in Xishuangbanna, south-west China. Journal of Tropical Ecology 23:115-118. Campanella, M. V., and M. B. Bertiller. 2008. Plant phenology, leaf traits and leaf
litterfall of contrasting life forms in the arid Patagonian Monte, Argentina. Journal of Vegetation Science 19:75-85.