Annals of the University of Petroşani, Economics, 11(3), 2011, 237-244 237
ECONOMICAL AND LIVING STANDARD OF
PENSIONERS, AT NATIONAL LEVEL AND IN THE JIU
VALLEY AREA
ROXANA PLE
Ş
A
*ABSTRACT: The level of pensions in Romania has been a favourite topic of debate and analysis by experts and the media, since 1990 until now. Aging and reducing the number of jobs produce structural changes in socio-economic terms over the active and inactive population. The growing number of pensioners, which exceeded the number of employees in the economy related to the level of economic and social development of our country, has led to the inability to create a social system for older people able to provide a decent income for them. The phenomenon requires concrete and concerted social action to influence developments in the sense of autonomy and welfare of life of elderly people, for a healthy aging and to ensure a good quality of life.
KEYWORDS: quality of life; living standard; income and expenditure; poverty.
JEL CLASSIFICATION: Z10.
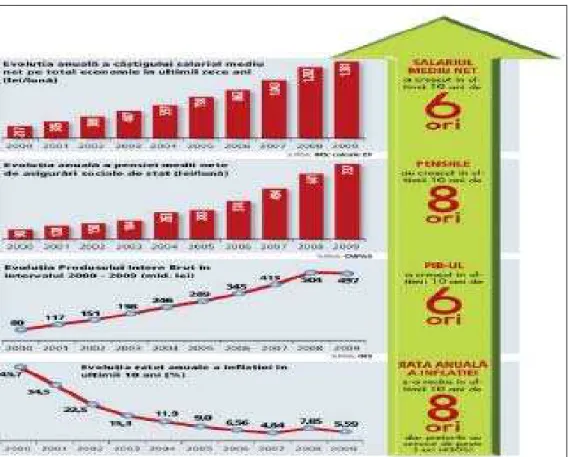
As for most people, the income of elderly persons, in spite of all increases occurred, can be characterized in real terms by the decline, which cannot lead to a decent living. Pensions are small compared to the population's needs, but if their progress is compared to the evolution of wages and GDP in the last 10 years, this shows that pensions increased eight times in the period 2000-2009, while wages and GDP increased only six times, according to INSSE data.
Pensions have increased much faster in recent years compared to wages, taking into consideration that between the ‘90-2000 period, the pensions had collapsed. A possible explanation of this aspect may have political connotations, if we think that over the past decade, six or seven were election years and the electoral mass of pensioners is a major. Another explanation could be that most of the wages of private sector is not recorded at their fair value so as to avoid paying social contributions for them, because of their high level.
*
238
Ple
ş
a, R.
Budget wages have risen in a few years from 5% of GDP to 9% of GDP. And this aspect connected with labour shortages in some sectors increased wages in the private sector too. According to economists, there was the so-called "demonstration effect". In 2008, Romania recorded an economic growth of 7.1% and in 2006, a growth of 7.9%, while the economic potential was estimated around 5.5 to 6%. The average pension in 2000 represented about 41% of net average wage, while in 2009 reached 53% of net average wage. In developed countries, the average pension is about 70-75% of net average wage.
Source: http://www.zf.ro/eveniment
Figure 1. Annual evolution of average net wage of the total economy, of the average net pension of state social security, of Gross Domestic Product,
inflation rate between 2000-2009
Monthly rate of inflation for the twelve months of 2009, overall and by groups of goods and services is shown in table 1.
Economical and Living Standard of Pensioners, at National Level and …
239
legumes (-0.6%). Non-food prices rose by 0.5%. There were observed price increases on tobacco, cigarettes (+3.6%), books, newspapers, magazines (+1.0%), drugs (+0.3%). Prices dropped for cars and spare parts (-0.8%) and fuels (-0.3%). Prices of services decreased by 0.3% due to lower prices for telephone, air transport (-1.4%), rent (-0.2%). Tariffs increased for water, sewerage, sanitation (1.1%), auto subscriptions, and payment of accommodation in hotel units (+ 0.2%).
Table 1. Evolution of prices of consumer goods and services in all months of 2009
Jan. Feb. Mar. Apr. May June July Aug. Sep. Oct. Nov. Dec. Total 1.2 0.9 0.5 0.3 0.0 0.2 - 0.1 - 0.2 0.4 0.4 0.7 0.3 Groceries 0.7 0.3 0.4 0.0 - 0.1 - 0.2 - 0.5 - 1.1 - 0.2 0.2 0.4 0.3 Non-food
goods
0.8 1.3 0.7 0.8 0.0 0.4 0.1 0.3 0.8 0.5 1.1 0.5
Services 3.3 1.0 0.3 - 0.5 0.1 0.4 0.3 0.3 0.5 0.9 0.1 - 0.3
*Products whose prices are regulated: medicines, electricity, gas, heat, rents set by local administration, water, sewerage, sanitation, urban transport, rail transport, water transport, post and courier, fixed phone, radio-TV subscription, issuance of identity cards, driving licenses, passports
Source: http://www.insse.ro/cms/files/arhiva_buletine2009
The evolution of partial indices, calculated by excluding certain components from the IPC, is shown in the table below:
Table 2. Evolution of prices of consumer goods and services in December 2009 compared to December 2008
December 2009 % compared to December 2008
TOTAL IPC 104,74
Total IPC excluding alcoholic beverages and tobacco 102,95
Total IPC excluding fuels 104,15
Total IPC excluding products whose prices are regulated *
105,05
*Products whose prices are regulated: medicines, electricity, gas, heat, rents set by local administration, water, sewerage, sanitation, urban transport, rail transport, water transport, post and courier, fixed phone, radio-TV subscription, issuance of identity cards, driving licenses, passports
Source: http://www.insse.ro/cms/files/arhiva_buletine2009
In December 2009, the inflation rate compared with same month of 2008 was of 4.7%. Food price increased by 0.4%, the price of non-food goods by 7.7% and service charges increased by 6.9%.
240
Ple
ş
a, R.
early '90s. If we consider the ratio between average pension and average wage, net average pension decreased from 51.1% of the average net salary in October 1990 to 45.8% in December 2008. This process is explained by the fact that indexation as followed to some extent the inflation index, while wages increased faster, by following the logic of the market with other indicators such as productivity, growth, etc. The result is that pensioners have become poorer than other members of society.
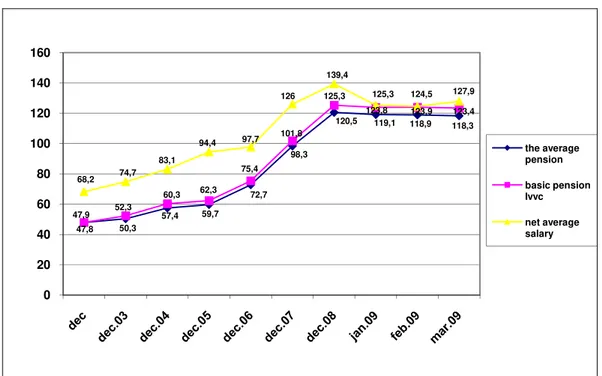
Figure No. 2 shows that the purchasing power of pensions increases in the months only when the value of the pension point increases, followed by further decreases immediately due to increased prices for basic food, for non-food products and essential services. In March 2009, the purchasing power of average basic pension in the social security system was 118.33% compared to October 1990, according to the ratio: 3.940.6 (increase of average pension of state social insurance between 1.X.1990-30.III.2009) x 100; 3.330.1 (increase of price between 1.X.1990-1.X.1990-30.III.2009).
47,8 50,3
57,4 59,7 72,7
98,3
120,5 119,1 118,9 118,3
47,9 52,3
60,3 62,3 75,4
101,8 125,3
123,8 123,9 123,4
68,2 74,7 83,1
94,4 97,7 126
139,4
125,3 124,5 127,9
0 20 40 60 80 100 120 140 160
the average pension
basic pension Ivvc
net average salary
Source: National Council of Senior Citizens (2009)
Figure 2 - Evolution of the purchasing power of average basic pension, of old - age full length type pension and of the average wage in period
December 2002-2008, January-March 2009 (%)
Economical and Living Standard of Pensioners, at National Level and …
241
wage, the values were 35.8% for the average basic pension and 49.4% for old-age pension with full contribution stage.
The net average salary in March 2009 was of 1402 lei, i.e. 2.04 times higher than the average basic pension (687 lei) and 1.48 times higher than the average old-age pension with full contribution stage (950 lei). In March 2009, while the average net salary in the country increased by 4258.9 times and the average gross salary of 4746.9 times compared to October 1990, pensions have risen less in the same period, as follows: the average pension of state social insurance - the 3940.6 times; the average old-age pension with full contribution stage - of 4110.8 times.
So in the first three months of 2009, pension revenues were insufficient for older people live a decent life, in spite of all increases made to the pension point value, because the purchasing power of pensions records a decreasing dynamics, a situation which requires the application of exceptional measures for immediate recovery of the living standards of the vast majority of pensioners.
Knowledge of living conditions of the population, its welfare, consumption and the possibilities of meeting the vital needs, the standard of living and lifestyle, of quality of life as a whole, has always been a current concern. Considerable decrease of quality of life compared to the years before the transition originates in the degradation social sphere. Defining the living conditions of any segment of the population can be achieved by knowledge of a large number of parameters; some refer to the existence of economic support, and others to the daily living conditions, health status, the general state of mind, etc. Among all these parameters, the crucial role is played by economic support. Income and consumption are essential components of quality of life and are characterized by low levels, structural imbalances and inequalities.
A sociological survey conducted in 2009, the Jiu Valley area has highlighted aspects of quality of life of retired elderly persons. This research aimed at breaking down the concept of quality of life in many indicators - financial situation, health, relationships with family, neighbours, healthcare, social services, trust in people and institutions involved in social and political life, life satisfaction, etc., but mainly this sociological approach focused on aspects of living standards, income and expenditure budget, the economic equilibrium of the family.
Figure 3 shows the comparison between the monthly expenses for households of pensioners at national level and the expenses made by the families of pensioners living in the Jiu Valley in 2009. Both at national level and in the Jiu Valley, the retirees allocate most of their income for food but there is a significant difference between the two reference systems, the ones living in the Jiu Valley spending with 13.4% less on these products. An assumption in explaining this difference could be a greater pension for those living in the area where our research was done, but most likely is the version their more modest life.
242
Ple
ş
a, R.
conditions in the area. We have to underline that the sample interviewed percentage of people who worked in mining is of 48%.
53,6
15,3
7,3 5,5 4,8 4,6 3,3
3,1 2,5
40,2
22,2
3,4 4,3
14,5
4,5 3,6 5,5
1,8
0 50 100
A B C D E F G H I
Romania Jiu Valley
A - food products and soft drinks; B - home payment; C - transport and communications; D -beverages and tobacco; E – health; F - clothes and foother ; G - recreation, education and culture; H - furniture and home equipment; I - other produits and services.
Source: INSSE, Statistical Yearbook of Romania, 2009 (for the information in Romania), Research carried out by author (for the information in the Jiu Valley)
Figure 3. Average monthly consumption expenditure in households of pensioners, at national level and Jiu Valley region in 2009 (%)
In terms of housing maintenance and utilities, the pensioners of the Jiu Valley allocates seven percent more than those at national level; this difference is explained to some extent by higher prices of household utilities in the Jiu Valley compared to other areas of the country. For other destinations, namely clothing and footwear, durable goods, leisure, culture and education, the proportion from household budget is relatively balanced, except for transport and communications, pensioners in the country give them a double rate compared with subjects interviewed.
Economical and Living Standard of Pensioners, at National Level and …
243
Minimum of subsistence requires a person's survival issues, while the minimum for a decent standard of living involves calculating the resources needed for current consumption - food, clothing, footwear, housing, services – in addition to a social status component that allows development and participation individual in society.
Absolute poverty threshold is calculated by adding up the cost of minimum food basket with a minimum of non-food consumer goods and services, equal to the expenditure of people whose food consumption equals the cost of food basket. Severe poverty threshold is calculated by adding up the cost of minimum food basket with minimum non-food consumer goods and services equal to the costs incurred by individuals whose total consumption equals the cost of food basket. (Mihailescu, 2001, p.49).
In 2009, in the paper "Dimensions of social inclusion in Romania" produced by the National Institute of Statistics, based on Household Budget Survey shows that pensioners hold a significant percentage of the total population (23.3%) and poor pensioners, 16.4% among the poor persons of 16 years old and over.
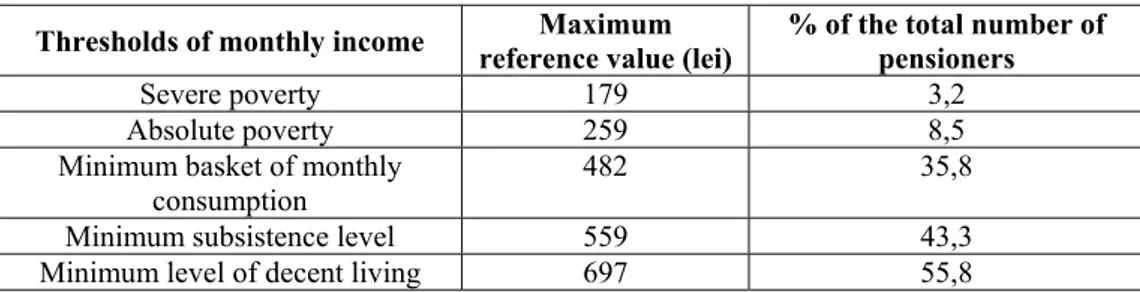
Nationally, in 2009, of all pensioners, 3.2% had pension below the severe poverty threshold, 8.5% below the absolute poverty threshold, over a third (35.8%) had pension below the minimum basket of monthly consumption, 43.3% had pensions below the minimum subsistence threshold, while more than half (55.8%) had pension below the minimum of decent living, namely:
Table 3. Pensioners at national level whose pensions situate under the thresholds of monthly (%)
Thresholds of monthly income Maximum reference value (lei)
% of the total number of pensioners
Severe poverty 179 3,2
Absolute poverty 259 8,5
Minimum basket of monthly consumption
482 35,8
Minimum subsistence level 559 43,3
Minimum level of decent living 697 55,8
Source: National Council of Senior Citizens (2011), Socio-economic situation of older people in Romania and EU countries - present and development perspectives
244
Ple
ş
a, R.
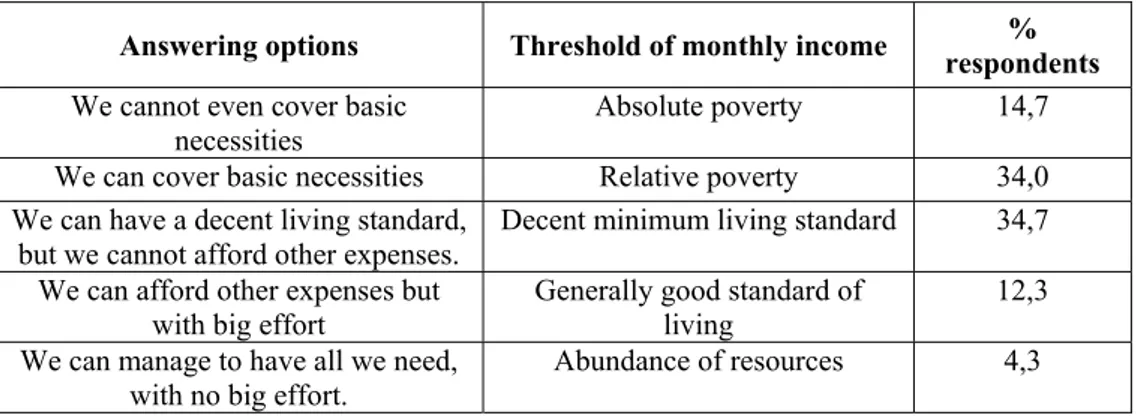
Table 4. Pensioners living in the Jiu Valley under the threshold of monthly income (%)
Answering options Threshold of monthly income %
respondents We cannot even cover basic
necessities
Absolute poverty 14,7
We can cover basic necessities Relative poverty 34,0
We can have a decent living standard, but we cannot afford other expenses.
Decent minimum living standard 34,7
We can afford other expenses but with big effort
Generally good standard of living
12,3
We can manage to have all we need, with no big effort.
Abundance of resources 4,3
Source: Research conducted by the author
Conclusions. As a member state of EU-27, Romania has applied the methodology to estimate poverty recommended by Eurostat (relative method), while developing a national system based on estimating absolute poverty method. The difficulties encountered in Europe and worldwide related to social protection in general and of the elderly persons, in particular, here we consider Romania situation, were added to extra problems of economic transition, the inadequacies of the legislative and institutional framework. The segment poor population from amidst the elderly persons has emerged in the process of impoverishment of the majority population. According to social researches, families of pensioners have an intermediate rate of poverty, but lower than average (15.7% to 22.4% in 2009). Usually, the elderly persons (retirees) are not among the beneficiaries of economic growth. Current expenditure, especially for utilities, tends to cause slipping into poverty of more and more elderly persons.
REFERENCES:
[1]. Mihăilescu, A. (2000) Aspecte ale standardului de viaţă în România ultimilor zece ani, Revista Calitatea Vieţii, XII, nr.1-4
[2]. Mihăilescu, A. (2001) Metodologia de calcul a minimului de trai decent şi de subzistenţă, Revista Calitatea Vieţii, XII, nr.1-4
[3]. Consiliul Naţional al Persoanelor Vârstnice (2009) Îmbătrânirea populaţiei în context european şi în România
[4]. Consiliul Naţional al Persoanelor Vârstnice (2011) Situaţia socio-economică a persoanelor vârstnice din România şi din ţările Uniunii Europene – prezent şi perspective de evoluţie
[5]. Institutul Naţional de Statistică (2009) Anuarul Statistic al României [6]. http://www.insse.ro/cms/files/arhiva_buletine2009