Submitted 23 July 2015 Accepted 2 November 2015 Published26 November 2015
Corresponding authors
Junfeng Xia, jfxia@ahu.edu.cn Yan Chen,
chenyan91030@yahoo.com
Academic editor
Frank Emmert-Streib
Additional Information and Declarations can be found on page 11
DOI10.7717/peerj.1425
Copyright
2015 Yue et al.
Distributed under
Creative Commons CC-BY 4.0
OPEN ACCESS
Prediction of cancer cell sensitivity to
natural products based on genomic and
chemical properties
Zhenyu Yue1, Wenna Zhang1, Yongming Lu1,
Qiaoyue Yang1, Qiuying Ding1, Junfeng Xia2and Yan Chen1 1School of Life Sciences, Anhui University, Hefei, Anhui, China
2Institute of Health Sciences, Anhui University, Hefei, Anhui, China
ABSTRACT
Natural products play a significant role in cancer chemotherapy. They are likely to provide many lead structures, which can be used as templates for the construction of novel drugs with enhanced antitumor activity. Traditional research approaches studied structure-activity relationship of natural products and obtained key structural properties, such as chemical bond or group, with the purpose of ascertaining their effect on a single cell line or a single tissue type. Here, for the first time, we develop a machine learning method to comprehensively predict natural products responses against a panel of cancer cell lines based on both the gene expression and the chemical properties of natural products. The results on two datasets, training set and independent test set, show that this proposed method yields significantly better prediction accuracy. In addition, we also demonstrate the predictive power of our proposed method by modeling the cancer cell sensitivity to two natural products, Curcumin and Resveratrol, which indicate that our method can effectively predict the response of cancer cell lines to these two natural products. Taken together, the method will facilitate the identification of natural products as cancer therapies and the development of precision medicine by linking the features of patient genomes to natural product sensitivity.
Subjects Bioinformatics, Computational Biology
Keywords Natural products, Machine learning, Gene expression, Chemical descriptors
INTRODUCTION
time-consuming. Therefore the use of computational methods based on structure-activity relationship (SAR) has been intensively investigated.
Traditional exploring approaches of SAR focus on producing a range of analogues based on the basic skeleton of lead structure by synthetic chemists and searching empirically for their structural properties predictive of the antitumor activity (Cao et al., 2013;Dong et al., 2012;Liu et al., 2015;Zhang et al., 2007). These SAR studies tried to predict responses in a single cell line or a single tissue type using only structure data. Although much progress has been made, the problem of predicting natural products response is far from being solved.
In the present study, we developed a machine learning approach to predict the cell lines response to natural products, based on gene expression of cancer cell lines (genomic information) and the chemical descriptors of the considered natural products (chemical structure) for the first time. Empirical studies show that our method can obtain good performance when predicting sensitivity for hundreds of cancer cell lines to natural products in test set and case study analyses and indicate that both the structural properties and gene expression signatures are important determinants of antitumor activity of natural products. Taken together, this study outlines a first approach to predict drug response for natural products and generate novel natural product candidates for further studies.
MATERIALS AND METHODS
Data collection
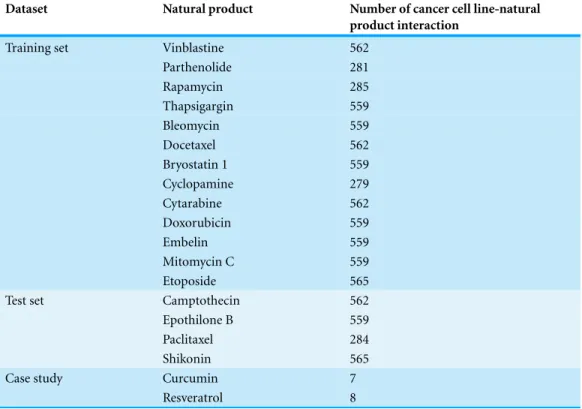
In order to develop robust predictors of response to natural products, we collected and annotated a published large-scale preclinical dataset, namely, the Genomics of Drug Sensitivity in Cancer (GDSC) (Garnett et al., 2012). This large dataset includes drug sensitivity data from 138 drugs across almost 700 cell lines. By retrieving the drug information from PubChem database (http://pubchem.ncbi.nlm.nih.gov), we identified 17 drugs as natural products or their derivatives from these 138 drugs (Table 1). These natural products in GDSC were screened across a range of279–565cell lines per drug (mean=495cell lines per drug) representing8,420cancer cell line-drug interactions. The
publically available drug sensitivity (Drug IC50values) data for all the 17 natural products was downloaded from GDSC (http://www.cancerrxgene.org).
Among these 17 natural products, 13 of them were randomly chosen for models’ building, which represents 6,450 cancer cell line-natural product interactions (training set,Table S1). The remaining 4 natural products with 1,970 cancer cell line-natural product interactions were used in the test set (Table S2).
Table 1 Natural products and the corresponding cancer cell line-natural product interaction data used in the training set, test set and case studies analyses.
Dataset Natural product Number of cancer cell line-natural
product interaction
Training set Vinblastine 562
Parthenolide 281
Rapamycin 285
Thapsigargin 559
Bleomycin 559
Docetaxel 562
Bryostatin 1 559
Cyclopamine 279
Cytarabine 562
Doxorubicin 559
Embelin 559
Mitomycin C 559
Etoposide 565
Test set Camptothecin 562
Epothilone B 559
Paclitaxel 284
Shikonin 565
Case study Curcumin 7
Resveratrol 8
it was screened on 16 cancer cell lines derived from 5 cancer types; and for Resveratrol, it encompasses drug sensitivity data for 13 cancer cell lines derived from 6 cancer types. After removing cell lines for which we could not find the corresponding gene expression information in GDSC, we finally obtained 7 and 8 cancer cell line-natural product interactions for Curcumin and Resveratrol, respectively (Table 2).
Genomic features
The GDSC gene expression microarray data were derived directly from the work of
Geeleher, Cox & Huang (2014). Subsequent analyses were restricted to 12,026 annotated genes with Entrez Gene ID.
Chemical features
Table 2 Detailed results of case studies.Samples, the number of cell lines in literature. Overlap, the number of cell lines overlapped with GDSC. Correctly, the number of cell lines whose sensitivity was predicted correctly.
(A) Curcumin
Melanoma Lung Breast Pancreas Prostate Total
Samples 8 2 3 2 1 16
Overlap 4 1 1 1 0 7
Correctly 3 1 1 1 0 6
(B) Resveratrol
Melanoma Lung Breast Pancreas Prostate Neuroblastoma Total
Samples 2 1 3 2 4 1 13
Overlap 2 1 3 1 1 0 8
Correctly 1 0 3 0 1 0 5
Models construction
In this study, the prediction model was built using the software WEKA (Hall et al., 2009) with the default parameters. The R scripts (Ihaka & Gentleman, 1996) were used for the statistical analyses.
RESULTS AND DISCUSSION
Strategy for prediction of cancer cell sensitivity to natural products
Our goal was to use gene expression andin vitrodrug sensitivity data derived from cell lines, with the addition of chemical properties, to predict cell lines’ response to natural products. The conceptual framework for prediction of cancer cell sensitivity to natural products is shown inFig. 1. In the first step, cell lines in GDSC were clustered into two groups (Sensitive and Resistant) or three groups (Sensitive, Resistant and Intermediate) according to their sensitivities (drug IC50values) to a given drug withK-Means algorithm in WEKA (Hall et al., 2009). HereKwas set 2 or 3, which means that the cancer cell lines were divided into 2 or 3 groups. Samples in Sensitive and Resistant groups are used to build machine learning model. Then, the performance of J48 (Decision Tree), SVM (Support Vector Machine), Random Forest and Rotation Forest (Rodriguez, Kuncheva & Alonso, 2006) models were comprehensively evaluated. After this step, we used genomic features from gene expression data and chemical features to construct prediction model, where the optimal feature number were selected usingt-test with R scripts (Gentleman et al., 2011).
Determination of number of cancer cell lines clusters
Figure 1 Natural products sensitivity prediction workflow.This data flow diagram demonstrates the simulation workflow for creation and optimization of natural products sensitivity prediction model. Our method was based on three key steps: (1) clustering of IC50values from the GDSC, then the cell lines were divided into 2 or 3 groups, the sensitive cell lines were set to 1, the resistant cell lines were set to 0. (2) TopNfeatures that were most significantly differential between the 1 and 0 cell line sets were chosen as the features of training and test sets. (3) Machine learning models were fitted in WEKA and can then be applied to the new data, to yield natural products sensitivity estimates.
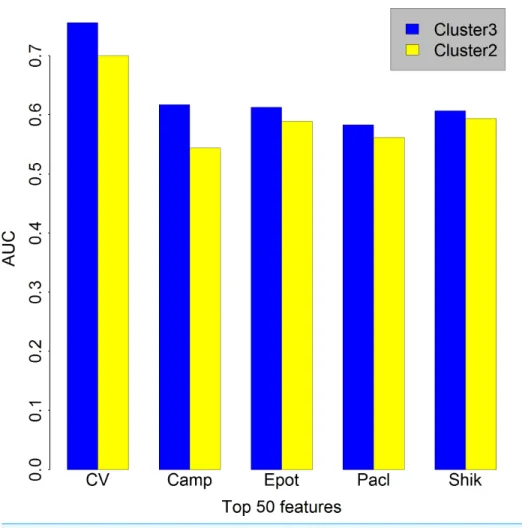
K=3 compared with those in the caseK=2 when features number is set as 50. The
similar situation occurred when the features number is set as 100 or 500 (Figs. S1andS2, respectively), so we choseK=3, which means that the cancer cell lines in GDSC were
Figure 2 Comparison between the caseK=2 andK=3.Bar chart showing in the caseK=3 (blue) we obtained a higher AUC than in the caseK=2 when features number is set as 50. Cluster3, the caseK=3. Cluster2, the caseK=2. CV, cross validation; Camp, Camptothecin; Epot, Epothilone B; Pacl, Paclitaxel;
Shik, Shikonin; AUC, Area under the curve.
Assessment of feature importance
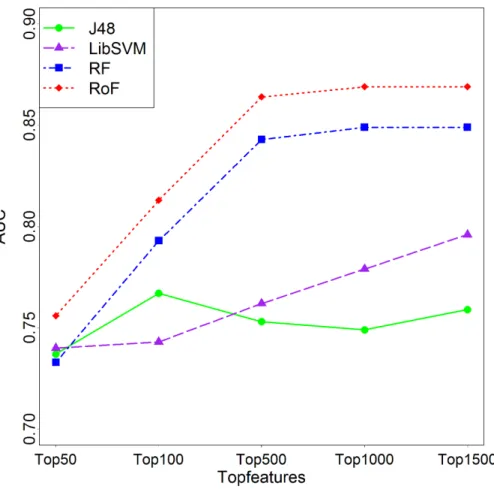
In feature selection step, a 10-fold cross validation on the training set was conducted to get the optimal gene numbers. Examination on predicted AUC with respect to numbers of selected feature numbers showed a consistent trend of increasing first and decreasing afterwards with the increase of selected feature numbers except SVM model (Fig. 3). As a result, the top 1,000 features were chosen as optimal features for further analyses.
Figure 3 Comparison among different topNsignificantly differential features.AUCs plotted against different topNfeatures in the caseK=3 are varied. J48, Decision Tree; SVM, Support Vector Machines;
RF, Random Forest; RoF, Rotation Forest; AUC, Area under the curve.
in this permutation test. So the genomic features (genes) we chosen were more likely to be related to tumorigenesis.
The top 1,000 features also contained 532 chemical descriptors of natural products. The systematic machine learning-based integration of various data sources, including chemical structure and genomic information, can provide better discriminative power than those using only individual data sources. This may presents a simple and promising strategy to predict antitumor activity of unknown natural products using pharmacology data and machine learning approaches.
The detailed 468 genes and 532 descriptors used in the top 1,000 features are shown in
Tables S3andS4.
Comparison of different machine learning methods
Figure 4 Comparison among different machine learning models.ROC curve showing the proportion of true positives against the proportion of false positives as the classification threshold is varied for test set. (A–D) represent Camptothecin, Epothilone B, Paclitaxel and Shikonin, respectively. ROC, receiver operating characteristic; J48, Decision Tree; SVM, Support Vector Machines; RF, Random Forest; RoF, Rotation Forest.
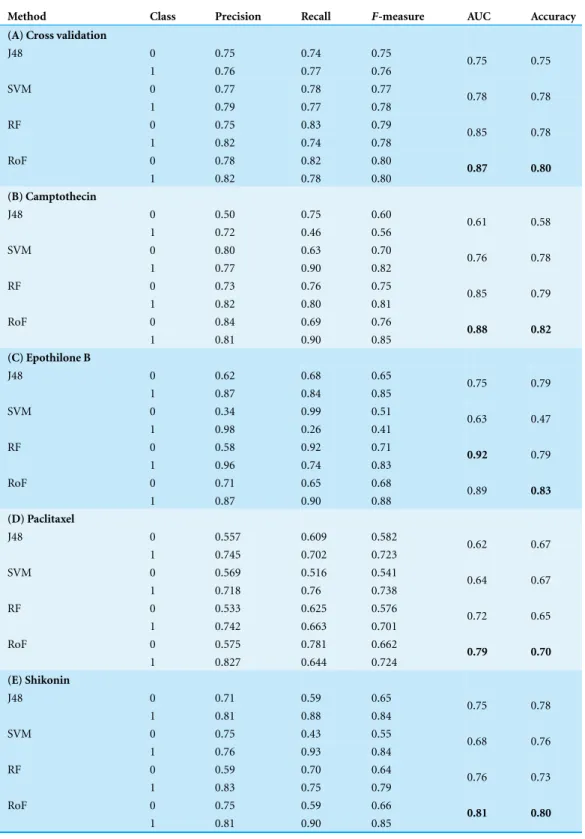
learning method in our previous work (Xia, Han & Huang, 2010), which also performed best using 10-fold cross validation (AUC=0.87,Fig. 3) in this study. A consistent trend
occurred in the test set (Fig. 4), where the AUC for for Camptothecin, Epothilone B, Paclitaxel, and Shikonin are 0.88, 0.89, 0.79 and 0.81, respectively.
Table 3 Results of classification based on different algorithms.Detailed classifiers assessment results of training set and test set. Each dataset chose the top 1,000 group as the model features.
Method Class Precision Recall F-measure AUC Accuracy
(A) Cross validation
J48 0 0.75 0.74 0.75
1 0.76 0.77 0.76 0.75 0.75
SVM 0 0.77 0.78 0.77
1 0.79 0.77 0.78 0.78 0.78
RF 0 0.75 0.83 0.79
1 0.82 0.74 0.78 0.85 0.78
RoF 0 0.78 0.82 0.80
1 0.82 0.78 0.80 0.87 0.80
(B) Camptothecin
J48 0 0.50 0.75 0.60
1 0.72 0.46 0.56 0.61 0.58
SVM 0 0.80 0.63 0.70
1 0.77 0.90 0.82 0.76 0.78
RF 0 0.73 0.76 0.75
1 0.82 0.80 0.81 0.85 0.79
RoF 0 0.84 0.69 0.76
1 0.81 0.90 0.85 0.88 0.82
(C) Epothilone B
J48 0 0.62 0.68 0.65
1 0.87 0.84 0.85 0.75 0.79
SVM 0 0.34 0.99 0.51
1 0.98 0.26 0.41 0.63 0.47
RF 0 0.58 0.92 0.71
1 0.96 0.74 0.83 0.92 0.79
RoF 0 0.71 0.65 0.68
1 0.87 0.90 0.88 0.89 0.83
(D) Paclitaxel
J48 0 0.557 0.609 0.582
1 0.745 0.702 0.723 0.62 0.67
SVM 0 0.569 0.516 0.541
1 0.718 0.76 0.738 0.64 0.67
RF 0 0.533 0.625 0.576
1 0.742 0.663 0.701 0.72 0.65
RoF 0 0.575 0.781 0.662
1 0.827 0.644 0.724 0.79 0.70
(E) Shikonin
J48 0 0.71 0.59 0.65
1 0.81 0.88 0.84 0.75 0.78
SVM 0 0.75 0.43 0.55
1 0.76 0.93 0.84 0.68 0.76
RF 0 0.59 0.70 0.64
1 0.83 0.75 0.79 0.76 0.73
RoF 0 0.75 0.59 0.66
1 0.81 0.90 0.85 0.81 0.80
Notes.
classes. As is shown inTable 3, all the 4 methods obtained good results based on 10-fold cross validation (training set) and test data set.
Case studies
To further illustrate the effectiveness of our approach for detecting cancer cell sensitivity to natural products, we present two additional natural products examples. By searching CancerHSP database (Tao et al., 2015) and natural products-related studies from the PubMed database (http://www.ncbi.nih.gov/pubmed), we obtained 2 natural products screened on 29 cancer cell lines: Curcumin (Bush et al., 2001;Choudhuri et al., 2002;Khor et al., 2006;Radhakrishna Pillai et al., 2004;Wang et al., 2006) and Resveratrol (Chen et al., 2004;Cl´ement et al., 1998;Ding & Adrian, 2002;Hsieh & Wu, 1999;Lu & Serrero, 1999;
Niles et al., 2003;Whyte et al., 2007), which have been proven effective in prevention and treatment of various kinds of cancers, including melanoma, lung cancer, ovarian cancer and so on (Tao et al., 2015). After eliminating cancer cell lines for which we could not find the corresponding gene expression information in GDSC, we finally obtained 7 and 8 cancer cell line-natural product interactions for Curcumin and Resveratrol, respectively. The prediction results in these two natural products are shown inTable 2.
Case study 1: curcumin
Curcumin, a phenolic compound from the rhizome of the plantCurcuma longa, induced apoptosis in tumor cells via a p53-dependent pathway or pathways independent of p53. We predicted responses of 7 cell lines that are sensitive to Curcumin, including 4 cell lines from melanoma, 1 cell line from lung cancer, 1 cell line from breast cancer, and 1 cell line from pancreatic cancer (Table S5). Notably, of the 7 cell lines that were defined as responders, 6 were correctly classified by our model (Table 2). The only cell line that was classified incorrectly is Sk-mel-5, a melanoma cell line containing wild-type p53. Because the rest 3 melanoma cell lines in this study contain mutant p53 (Bush et al., 2001), this may explain why our method could not obtain the correct result in Sk-mel-5 cell line.
Case study 2: resveratrol
CONCLUSIONS
In this study, we investigated the inherent determinants of antitumor activity of natural products. For this purpose, we developed a machine learning method to predict natural products responses against a panel of cancer cell lines based on both the gene expression data and the chemical properties of natural products. Our results show that it is possible to enrich for natural products responders using gene expression and chemical descriptors, by applying models generated from a large panel of cancer cell lines. The performance of our approach was firstly evaluated using the 10-fold cross validation (training set) and test set, and further validated by modeling two additional natural products (case studies analyses). The experimental results show that our method can effectively predict the response of cancer cell lines to natural products.
Although our final best model is based on both the gene expression signatures of cancer cells lines and the chemical properties, novel features that better describe natural product sensitivity can be easily incorporated into our prediction system to further improve the prediction performance of natural product response. In our future work, we will add other genomic features such as mutation information into the prediction model. Besides these genomic information, epigenetic and protein level information also play very important role in natural product response mechanism, and thus should be incorporated in our prediction system. In addition, it should be noted that in the current study we focused on “natural product sensitivity in cancer.” In the future, we will consider extending our model to non-natural product sensitivity prediction. Last, we will offer an online web interface through which our approach can be implemented to computationally predict natural product sensitivity.
ADDITIONAL INFORMATION AND DECLARATIONS
Funding
This work was supported by National Natural Science Foundation of China (31271817, 31301101), the Key Project of Science and Technology of Anhui (1501031099), the Anhui Provincial Natural Science Foundation (1408085QF106), the Specialized Research Fund for the Doctoral Program of Higher Education (20133401120011), and the Technology Foundation for Selected Overseas Chinese Scholars from Department of Human Resources and Social Security of Anhui Province (No. [2014]-243). The funders had no role in study design, data collection and analysis, decision to publish, or preparation of the manuscript.
Grant Disclosures
The following grant information was disclosed by the authors: National Natural Science Foundation of China: 31271817, 31301101. Key Project of Science and Technology of Anhui: 1501031099. Anhui Provincial Natural Science Foundation: 1408085QF106.
Specialized Research Fund for the Doctoral Program of Higher Education: 20133401120011.
Competing Interests
The authors declare there are no competing interests.
Author Contributions
• Zhenyu Yue conceived and designed the experiments, performed the experiments,
analyzed the data, contributed reagents/materials/analysis tools, wrote the paper, prepared figures and/or tables, reviewed drafts of the paper, data collection.
• Wenna Zhang, Yongming Lu, Qiaoyue Yang and Qiuying Ding reviewed drafts of the
paper.
• Junfeng Xia conceived and designed the experiments, analyzed the data, contributed
reagents/materials/analysis tools, wrote the paper, prepared figures and/or tables, reviewed drafts of the paper.
• Yan Chen conceived and designed the experiments, reviewed drafts of the paper.
Data Availability
The following information was supplied regarding data availability: Sensitivity data for natural products/drugs:
http://www.cancerrxgene.org/
SMILES codes of natural products:http://pubchem.ncbi.nlm.nih.gov/
Gene expression of cell lines:
http://genemed.uchicago.edu/∼pgeeleher/cgpPrediction/.
Supplemental Information
Supplemental information for this article can be found online athttp://dx.doi.org/ 10.7717/peerj.1425#supplemental-information.
REFERENCES
Bush JA, Cheung Jr K, John J, Li G. 2001.Curcumin induces apoptosis in human melanoma cells through a Fas receptor/caspase-8 pathway independent of p53.Experimental Cell Research 271:305–314DOI 10.1006/excr.2001.5381.
Cao R, Fan W, Guo L, Ma Q, Zhang G, Li J, Chen X, Ren Z, Qiu L. 2013.Synthesis and
structure-activity relationships of harmine derivatives as potential antitumor agents.European Journal of Medicinal Chemistry60:135–143DOI 10.1016/j.ejmech.2012.11.045.
Chen J, Nikolovska-Coleska Z, Wang G, Qiu S, Wang S. 2006.Design, synthesis, and characterization of new embelin derivatives as potent inhibitors of X-linked inhibitor of apoptosis protein.Bioorganic & Medicinal Chemistry Letters16:5805–5808 DOI 10.1016/j.bmcl.2006.08.072.
Chen Y, Tseng S-H, Lai H-S, Chen W-J. 2004.Resveratrol-induced cellular apoptosis and cell cycle arrest in neuroblastoma cells and antitumor effects on neuroblastoma in mice.Surgery 136:57–66DOI 10.1016/j.surg.2004.01.017.
Cl´ement M-V, Hirpara JL, Chawdhury S-H, Pervaiz S. 1998.Chemopreventive agent resveratrol, a natural product derived from grapes, triggers CD95 signaling-dependent apoptosis in human tumor cells.Blood92:996–1002.
Dai Y, DeSano J, Qu Y, Tang W, Meng Y, Lawrence TS, Xu L. 2011.Natural IAP inhibitor Embelin enhances therapeutic efficacy of ionizing radiation in prostate cancer.American Journal of Cancer Research1:128–143.
Ding X-Z, Adrian TE. 2002.Resveratrol inhibits proliferation and induces apoptosis in human pancreatic cancer cells.Pancreas25:e71–e76DOI 10.1097/00006676-200211000-00024. Dong G, Wang S, Miao Z, Yao J, Zhang Y, Guo Z, Zhang W, Sheng C. 2012.New tricks for an old
natural product: discovery of highly potent evodiamine derivatives as novel antitumor agents by systemic structure-activity relationship analysis and biological evaluations.Journal of Medicinal Chemistry55:7593–7613DOI 10.1021/jm300605m.
Fawcett T. 2006.An introduction to ROC analysis.Pattern Recognition Letters27:861–874 DOI 10.1016/j.patrec.2005.10.010.
Futreal PA, Coin L, Marshall M, Down T, Hubbard T, Wooster R, Rahman N, Stratton MR. 2004.A census of human cancer genes.Nature Reviews Cancer4:177–183DOI 10.1038/nrc1299. Garnett MJ, Edelman EJ, Heidorn SJ, Greenman CD, Dastur A, Lau KW, Greninger P,
Thompson IR, Luo X, Soares J. 2012.Systematic identification of genomic markers of drug sensitivity in cancer cells.Nature483:570–575DOI 10.1038/nature11005.
Geeleher P, Cox NJ, Huang RS. 2014.Clinical drug response can be predicted using baseline gene expression levels andin vitrodrug sensitivity in cell lines.Genome Biology15:Article R47 DOI 10.1186/gb-2014-15-3-r47.
Gentleman R, Carey V, Huber W, Hahne F. 2011.Genefilter: methods for filtering genes from microarray experiments. R package version 1.
Goldwasser F, Bae I, Valenti M, Torres K, Pommier Y. 1995.Topoisomerase I-related parameters and camptothecin activity in the colon carcinoma cell lines from the National Cancer Institute anticancer screen.Cancer Research55:2116–2121.
Hall M, Frank E, Holmes G, Pfahringer B, Reutemann P, Witten IH. 2009. The WEKA data mining software: an update. ACM SIGKDD Explorations Newsletter 11:10–18 DOI 10.1145/1656274.1656278.
Hsieh T-C, Wu JM. 1999.Differential effects on growth, cell cycle arrest, and induction of apoptosis by resveratrol in human prostate cancer cell lines.Experimental Cell Research 249:109–115DOI 10.1006/excr.1999.4471.
Ihaka R, Gentleman R. 1996. R: a language for data analysis and graphics.Journal of Computational and Graphical Statistics5:299–314DOI 10.1080/10618600.1996.10474713. Khor TO, Keum Y-S, Lin W, Kim J-H, Hu R, Shen G, Xu C, Gopalakrishnan A, Reddy B,
Zheng X. 2006.Combined inhibitory effects of curcumin and phenethyl isothiocyanate on the growth of human PC-3 prostate xenografts in immunodeficient mice.Cancer Research 66:613–621DOI 10.1158/0008-5472.CAN-05-2708.
Liu T, Ma M, Ge H-M, Yang C, Cleveland J, Shen B. 2015.Synthesis and evaluation of 8, 4′
-dideshydroxy-leinamycin revealing new insights into the structure-activity relationship of the anticancer natural product leinamycin.Bioorganic & Medicinal Chemistry Letters25:4899–4902 DOI 10.1016/j.bmcl.2015.05.078.
Lynch TJ, Bondarenko I, Luft A, Serwatowski P, Barlesi F, Chacko R, Sebastian M, Neal J, Lu H, Cuillerot J-M. 2012.Ipilimumab in combination with paclitaxel and carboplatin as first-line treatment in stage IIIB/IV non–small-cell lung cancer: results from a randomized, double-blind, multicenter phase II study. Journal of Clinical Oncology30:2046–2054 DOI 10.1200/JCO.2011.38.4032.
Niles RM, McFarland M, Weimer MB, Redkar A, Fu Y-M, Meadows GG. 2003.Resveratrol is a potent inducer of apoptosis in human melanoma cells.Cancer Letters190:157–163 DOI 10.1016/S0304-3835(02)00676-6.
Of Trialists IC. 2011.International phase III trial assessing neoadjuvant cisplatin, methotrexate, and vinblastine chemotherapy for muscle-invasive bladder cancer: long-term results of the BA06 30894 trial.Journal of Clinical Oncology29:2171–2177DOI 10.1200/JCO.2010.32.3139. Radhakrishna Pillai G, Srivastava AS, Hassanein TI, Chauhan DP, Carrier E. 2004.Induction
of apoptosis in human lung cancer cells by curcumin.Cancer Letters 208:163–170 DOI 10.1016/j.canlet.2004.01.008.
Rodriguez JJ, Kuncheva LI, Alonso CJ. 2006. Rotation forest: a new classifier ensemble method. IEEE Transactions on Pattern Analysis and Machine Intelligence28:1619–1630 DOI 10.1109/TPAMI.2006.211.
Rodr´ıguez-Berna G, Mangas-Sanju´an V, Gonzalez-Alvarez M, Gonzalez-Alvarez I,
Garc´ıa-Gim´enez JL, Caba˜nas MJD, Bermejo M, Corma A. 2014.A promising camptothecin derivative: semisynthesis, antitumor activity and intestinal permeability.European Journal of Medicinal Chemistry83:366–373DOI 10.1016/j.ejmech.2014.06.050.
Silvestri R. 2013.New prospects for vinblastine analogues as anticancer agents.Journal of Medicinal Chemistry56:625–627DOI 10.1021/jm400002j.
Tao W, Li B, Gao S, Bai Y, Shar PA, Zhang W, Guo Z, Sun K, Fu Y, Huang C. 2015.CancerHSP: anticancer herbs database of systems pharmacology.Scientific Reports5:Article 11481. Wang Z, Zhang Y, Banerjee S, Li Y, Sarkar FH. 2006.Notch—down—regulation by curcumin is
associated with the inhibition of cell growth and the induction of apoptosis in pancreatic cancer cells.Cancer106:2503–2513DOI 10.1002/cncr.21904.
Weininger D. 1988.SMILES, a chemical language and information system. 1. Introduction to methodology and encoding rules.Journal of Chemical Information and Computer Sciences 28:31–36.
Whyte L, Huang Y-Y, Torres K, Mehta RG. 2007.Molecular mechanisms of resveratrol action in lung cancer cells using dual protein and microarray analyses.Cancer Research67:12007–12017 DOI 10.1158/0008-5472.CAN-07-2464.
Xia J-F, Han K, Huang D-S. 2010.Sequence-based prediction of protein–protein interactions by means of rotation forest and autocorrelation descriptor.Protein and Peptide Letters17:137–145 DOI 10.2174/092986610789909403.
Yap CW. 2011.PaDEL—descriptor: an open source software to calculate molecular descriptors and fingerprints.Journal of Computational Chemistry32:1466–1474DOI 10.1002/jcc.21707. Zhang M, Cui S, Cheung P, Wang Q. 2007.Antitumor polysaccharides from mushrooms: a review
on their isolation process, structural characteristics and antitumor activity.Trends in Food Science & Technology18:4–19DOI 10.1016/j.tifs.2006.07.013.