Pedro Miguel Borges Fonseca
Licenciado em Biologia Celular e Molecular
Prostate Cancer Exosomes As Molecular
Predictors Of Response To Therapy
Dissertação para obtenção do Grau de Mestre em Genética Molecular e Biomedicina
Orientador: Theocharis Panaretakis, Associate Professor,
Karolinska Institutet
SPINE (LOMBADA)
Department of Life Sciences, Faculty of Sciences and Technology, New University of Lisbon
Department of Oncology-Pathology, Karolinska Institutet, Sweden
Pedro Miguel Borges Fonseca
Prostate Cancer Exosomes As Molecular
Predictors Of Response To Therapy
Dissertassion to obtain an MSc in Molecular Genetics and Biomedicine
Orientador: Theocharis Panaretakis, Associate Professor, Karolinska
Institutet
September 2015
Prostate Cancer Exosomes As Molecular Predictors Of Response To Therapy
Copyright Pedro Miguel Borges Fonseca, FCT/UNL, UNL
A Faculdade de Ciências e Tecnologia e a Universidade Nova de Lisboa têm o direito, perpétuo e sem limites
geográficos, de arquivar e publicar esta dissertação através de exemplares impressos reproduzidos em papel ou
de forma digital, ou por qualquer outro meio conhecido ou que venha a ser inventado, e de a divulgar através de
repositórios científicos e de admitir a sua cópia e distribuição com objectivos educacionais ou de investigação,
AKNOWLEDGMENTS
First of all I would like to thank my supervisor Theocharis Panaretakis, not only for giving me the oportunity to come and work in his lab, but also for motivating me every day to do better research. Greatly appreciate your support and I am delighted to be working with exosomes! Telia!
Would also like to thank our lab members: Dimitris for being my tutor and introducing me to the lab and everything that comes with it, really made my adaptation easier, and learned alot from you; Julia for being so hard-working and always being present whenever we need help, sorry for my amazing singing skills in the cell hood; Tsesmetzis, for the very interesting scientific discussions, enthusiasm, and for keeping me in my place in the kindest way possible, "who is the best?"; also the "intruder" Nikos and George, for teaching me alot and showing me how to do proper research; Dr. Rassidakis for also welcoming me to CCK and introducing me to a whole new world of research I was not familiar with; also want to thank the previous lab members Pedram, Sophia, Claire, Qiao, Nikolina, some of you I didn't have the chance to meet in person, but really appreciate your hard work and research conducted that eventually led to where we are now; almost forgot about Occhionero - just kidding -, my partner in crime, really appreciate our abstract thinking about life, don't forget what I always told you, and sorry for overloading you with Pink Floyd. Oh and a special thanks to Lena, for being a great friend and researcher to work with, and to Dr. Sten Nilsson, Dr. Jeffrey Yachnin and Dr. Anders Ullén for collaborating and bringing a more clinical perspective to the research we conduct.
To sum it up, also want to thank the amazing people in CCK, really like the environment. It feels like a professional but at the same time familly place (with the head of the department Dan Grander being representative of this), highly due to its amazing people: Aravindh, Sara, Thomas, Yuanyuan, Tanja, Ali, Reiner, Stefano, Xianli, Mathilde/Annabelle, Poppy, Joahanna, Patrícia, Dalel, Jens, Vassilis, Alex, Aida, Lorena, Ran, Karthik, Lisa, John, Sander, Tiago, Santiago, Matheus, Iryna, Jason, Alessandro, Elin, Carina, Sara, Artur, Ellin, Elena, the amazing Nik, Deniz, Emma, and many others. Would also like to thank other people in stockholm that enlightened my stay: Pedro, with that name you could only be a great guy, want to thank you for being like a brother to me; Paula, for being an amazing "accidental" friend; Siw, Mohammed, Ali, Robert, Xinsong, thank you all.
Can't forget to also thank Prof. Pedro's and Prof. Alexandra's lab, specially Milton, where last year I found a renewed spark for science, really grateful since without it I probably wouldn't have made it here; and also all my friends and colleagues at the FCT, LBCM and MGMB - lu, zepe, tides, mike, brito, David, Mauro, Migs!
ABSTRACT
Prostate cancer is the second most common cancer in men and acording to the Globocan report from 2012, there will be over 1.2 million new cases and over 300 000 deaths, worldwide. Organ-defined prostate cancer is a curable disease, but then it develops into metastatic castration resistant prostate cancer, and it is usually a matter of time until the patient develops resistance to chemotherapy and becomes an incurable disease.
This evokes the need for biomarkers that can predict disease progression and response to therapy. This would allow for a better stratification of the patients to receive the most efficacious, therapeutic treatment. Cancer cell derived exosomes, with their molecular cargo that represents the tumor cells, have been demonstrated to be a good source of such prognostic and predictive biomarkers. In this study we isolated and characterized exosomes derived from prostate cancer cells that are resistant to docetaxel and abiraterone acetate. One interesting finding is that the cells that are resistant to these two drugs secrete more exosomes than their sensitive counterparts. We compared the proteomic profile of these exosomes with exosomes from the parental, drug-sensitive cell lines. We have identified a number of putative markers that may constitute a predictive signature and are currently under validation. From our pilot studies we have identified that p-gp positive exosomes may function as predictive biomarkers for response to docetaxel, and that exosomes containing the splice variant 7 of the androgen receptor may have the potential to predict response to abiraterone acetate and enzalutamide. However, both of these biomarkers have to be validated in larger patient cohorts along with the newly identified proteins. In addition to proteomics, the exosomes are currently being analysed by transcriptomics, mRNA and miRNA arrays. These combined molecular data will provide valuable information in finding predictive signatures for response to therapy, in order to provide the patients with a more personalized medical care and stratified course of treatment, leading to improved overall survival.
ABSTRACT (IN PORTUGUESE)
Em termos mundiais, o cancro da prostata é o segundo cancro com maior incidência no homem, e segundo o relatório de 2012 da Globocan, estão previstos 1.2 milhões de novos casos incidentes e mais de 300 mil mortes. Quando o cancro da próstata passa a uma fase resistente à deprivação hormonal e com potencial de criar metástases, é só uma questão de tempo até o doente apresentar resistência à quimioterapia, tornando-se incurável.
Isto levanta uma questâo importante: a necessidade de descobrir biomarcadores que possam prever a progressão da doença e a resposta a determinados fármacos. Tal descoberta iria permitir uma melhor estratificação dos doentes para que pudessem ter um cuidado médico mais apropriado, nomeadamente ao nível quimioterapêutico. Exosomas isolados de células tumorais possuem um perfil molecular equiparado ao do tumor, o que faz com que estes tenham o potencial de serem ou conterem esses mesmos biomarcadores. Neste estudo isolámos e caracterizámos exosomas provenientes de células do cancro da próstata, células estas que apresentam resistência aos fármacos Docetaxel e Abiraterone Acetate. Uma observação relevante é o facto de as células resistentes a estes dois fármacos excretarem mais exosomas do que as mesmas células mas sensíveis aos fármacos, o que revela o potencial dos exosomas em serem utilizados como biomarcadores. Comparámos o proteoma destes exosomas com exosomas provenientes das linhas celulares não resistentes, e identificámos um conjunto de proteínas que se encontram actualmente em estudo relativamente ao seu potencial como biomarcador. Nos nossos estudos iniciais identificámos: exosomas que contêm a proteina p-gp, que podem servir como biomarcador de resposta ao tratamento com docetaxel; e exosomas que contêm proteinas proveniente do splicing alternativo 7 do receptor de androgénio, como tendo o potencial para prever uma resposta aos fármacos abiraterone acetate e enzalutamide. No entanto, tanto estes biomarcadores como as proteínas recentemente identificadas necessitam de posterior validação em grandes grupos de doentes. Para além do proteoma seria beneficial obter o perfil genómico (mRNA e miRNAS) destes exosomas. Ao complementar as duas abordagens poderíamos obter informação relevante para identificar assinaturas com potencial de prever a resposta à quimioterapia, com o objectivo de providenciar aos doentes um atendimento médico mais personalizado e estratificado relativamente às opções de tratamento, o que levaria a uma melhoria global em termos de sobrevivência.
TABLE OF CONTENTS
1. Introduction ____________________________________________________________________ 1
1.1. Cancer ________________________________________________________________ 1
1.1.1. Tumorigenesis __________________________________________________ 1
1.1.2. Tumor Progression _______________________________________________ 2
1.1.3. Stratification and "Drivers" of Cancer ________________________________ 2
1.1.4. Hallmarks of Cancer ______________________________________________3
1.2. Prostate Cancer __________________________________________________________
1.2.1. The Prostate ____________________________________________________
1.2.2. Epidemiology ___________________________________________________
1.2.3. Risk Factors ____________________________________________________
1.2.4. From Screening to Diagnosis and Classification _______________________
1.2.5. Pathogenesis ____________________________________________________
1.2.6. Androgen Receptor Signaling ______________________________________
1.2.7. Treatment, mCRPC, and Resistance to Therapy ________________________
1.2.8. Proposing a New Molecular Classification for PCa _______________________
1.2.9. Biomarkers ______________________________________________________
1.3. Exosomes ______________________________________________________________
1.3.1. Composition ____________________________________________________
1.3.2. Biogenesis and Uptake ____________________________________________
1.3.3. Isolation and Characterization ______________________________________
1.3.4. Potential Functional Activities _____________________________________
1.3.5. Clinical Beneficts as a Source of Biomarkers __________________________
1.4. Aim of the Study ________________________________________________________
2. Materials and Methods ___________________________________________________________
3. Results
3.1. Exosomes originated from docetaxel sensitive (DUS) and resistant (DUR) cells _____
3.1.1 Exosome Characterization _________________________________________
3.1.2 Proteomics Profiling of exosomes ___________________________________
3.1.3 Validation _____________________________________________________
3.2 Exosomes from AA sensitive and resistant DU145 and LNCaP cells ______________
3.2.1 Exosome Characterization ________________________________________
3.2.2 Proteomics Profiling of exosomes __________________________________
3.2.3 Validation _____________________________________________________
4. Discussion ____________________________________________________________________
5. References ____________________________________________________________________
LIST OF FIGURES
Figure 1. Tumor iniciation and progression. ______________________________________________
Figure 2. The Hallmarks of Cancer. _____________________________________________________
Figure 3. The prostate. _______________________________________________________________
Figure 4. TMPRSS2-ERG fusion protein. ________________________________________________
Figure 5. AR mode of action schematics. ________________________________________________
Figure 6. Schematic representation of possible mechanisms of resistance to chemotherapy. _______
Figure 7. Illustrative figure of a new model of classification for PCa. __________________________
Figure 8. Illustrative figure of molecular constitutents of exosomes. __________________________
Figure 3.1: Characterization of exosomes secreted from DUS and DUR cells, with prior cell death profiling of those same cells.
Figure 3.2: Comparative biochemical characterization of exosomes isolated from DU145 Tax-Sen and DU145 Tax-Res cells.
Figure 3.3: Bioinformatics analysis of the DU145 Tax-Sen and DU145 Tax-Res exosomal proteome. _
Figure 3.4: Proteomics profiling of exosomes isolated from DU145 and DUR cells. _______________
Figure 3.5: Cell death profiling of DU145, DUAAR, LNCaP and LNAAR cells by Annexin V/PI staining.
Figure 3.6: Cell proliferation profiling of DU145, DUAAR, LNCaP and LNAAR cells by iCELLigence .
Figure 3.7: Characterization of exosomes secreted from DU145, DUAAR, LNCaP and LNAAR cells.
Figure 3.8: Characterization of exosomes secreted from DU145, DUAAR, LNCaP and LNAAR cells by western blot and sucrose gradients
Figure 3.9: Bioinformatics analysis of the DUAAR and DU145 exosomal proteome. ______________
Figure 3.10: Bioinformatics analysis of the LNCaP and LNAAR exosomal proteome. _____________
Figure 3.11: Androgen Receptor Profiling of DU145, DUAAR, LNCaP and LNAAR cells and exsosomes by western blotting.
LIST OF ABBREVIATIONS
AR Androgen Receptor
ADT Androgen deprivation therapy
ARAT Androgen receptor (AR)-axis-targeted therapy
BHP Benign prostatic hyperplasia
DHT Dihydrotestosterone
DUR DU145 cell line resistant to docetaxel/taxotere
DUAAR DU145 cell line resistant to abiraterone acetate
EVs Extracellular vesicles
LHRH Luteinizing hormone-releasing hormone
LNAAR LNCaP cell line resistant to abiraterone acetate
lncRNA Long non-conding RNA
mRNA Messenger RNA
mCRPC Metastatic castration resistant prostate cancer
mPC Metastatic prostate cancer
miRNA Micro RNA
mtDNA Mitocondrial DNAs
PIA Proliferative inflammatory atrophy
PCa Prostate Cancer
PIN Prostatic intraepithelial neoplasia
PSA Prostate specific antigen
1. INTRODUCTION
1.1 CANCER
Cancer is the second leading cause of death worldwide, accounting for over 8 million deaths in 2013 (Global Burden of Disease Cancer et al., 2015). Despite the progress made within the recent years regarding prevention, diagnosis and treatment of certain types of cancer, close to 15 million incident cancer cases were reported in 2013. These numbers are attributed not only to risk factors such as smoking, obesity and dietary habits, but also to a global increase in the world's population and respective life expectancy. While these numbers seem alarming, they are suspected to increase to 22 million new cases within the next 20 years (Edwards et al., 2014, Global Burden of Disease Cancer et al., 2015).
But what is cancer?
The majority of the cells in our body have the ability to grow, divide and die. Ultimately speaking it seems that there is no life without death, and our survival is dependent on the balance between a sustained cell proliferation and programmed cell death. In a simplistic view, cancer can be seen as something that disrupts the balance of life, where cells no longer respond to the strict mechanisms that regulate cell survival, proliferation and death. But it is much more complex than that, and even though research has provided answers to many questions, it seems that we are still only scratching the surface.
Let’s have a brief overview of this complexity.
1.1.1 Tumourigenesis
Cancer is a multifactorial disease, with its progression being influenced by genetic, epigenetic and environmental factors (Lochhead et al., 2015). These factors can alter the content and structure of a cell's genome, which can lead to atypical cell phenotypes. Mutated genes often prompt changes in cellular growth programs, resulting in the formation of large cell populations, thus breaking tissue homeostasis. These masses of cells can be divided into two major categories, based on their ability to invade neighbouring tissue: benign tumours, which grow locally and do not metastasize, and malignant tumours that can invade not only nearby tissues but also metastasize to distant organs
1.1.2 Tumour Progression
While most of the tumours originating in humans are benign and cause little harm to the host, there are cases where the tumour mass applies pressure into vital organs, with one example being the brain. In addition, some benign tumours can develop into dysplasias. These are characterized by abnormal cells and additional effects on the overall tissue architecture, as opposed to hyperplasias, characterized by an over excessive cell proliferation but no apparent anomaly in the tissue architecture. Added degrees of abnormality can further develop dysplasias into neoplasias, which can be pre-malignant or malignant, and it's the latter that is collectively termed as cancer (Shin et al., 2014). A simplified scheme is presented in Figure 1.
1.1.3 Stratification and "Drivers" of Cancer
Cancer can be considered as the collective name for many different types of malignancy. Stratification can be done based on the cellular origin of the tumour, with malignant tumours originating from epithelial cells, being the most common. These are termed carcinomas, but more than 100 different types exist. Other common examples include sarcomas, formed from mesenchymal cells in soft tissues; leukemias, lymphomas and multiple myelomas, originating from haematological cells which do not form solid tumours, but rather consist of malignant cells present in the blood or the lymphatic system, initiating in different kinds of immune cells; and many others such as melanomas and neuronal tumours (Chizuka et al., 2006).
Types of cancer are also named after the organ or tissue in which they appear, but can also be characterized by the types of genetic alterations that are thought to be driving them. These genetic
modifications, commonly called "drivers" of cancer, usually affect three main types of genes: proto-oncogenes, tumour suppressor genes and DNA repair genes (Vogelstein and Kinzler, 2004). The most common genetic events that initiate cancer are: copy number amplification or specific mutations that might activate proto-oncogenes into cancer-driving genes, also known as oncogenes, which are involved in cell growth, division and death, allowing cells to survive when they were not supposed to; there are also deletions, mutations and epigenetic events that can cause loss of function of certain genes, namely tumour suppressor genes, with p53 as the most prevalent example, allowing cells to divide in an uncontrolled manner, when otherwise it would act by supressing the proliferation and survival of affected cells. These events usually occur simultaneously, while also affecting DNA repair genes, which may cause an accumulation of mutations in these and other genes, potentially leading to the development of cancer.
1.1.4 Hallmarks of Cancer
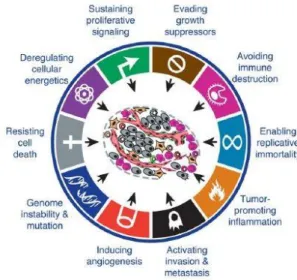
Cancer usually develops over many years, starting from relatively benign agglomerations of cells and then turning into malignant tumours. The accumulation of these genetic alterations over the years can lead to the acquisition of a specific set of properties that account for the transition from normal to malignant cells. During tumour progression, most malignant tumours acquire the same set of functional capabilities, regardless of tumour origin, coined as "Hallmarks of Cancer" by Hanahan and Weinberg. These consistently observed characteristics displayed by cancer cells are: sustained proliferative signalling, evasion of growth suppression, activation of invasion and metastasis, replicative immortality, induction of angiogenesis, and resisting cell death; (Hanahan and Weinberg, 2000).
1.2 PROSTATE CANCER
1.2.1 The Prostate
The prostate is a walnut-sized gland that can only be found in men; it is located in front of the rectum and below the bladder, surrounding the urethra. Its main function is the production of seminal fluid, mostly produced in the seminal vesicles located behind the prostate, which has a protective and supportive role in transporting sperm (Hurwitz et al., 2003). The prostate is highly dependent on androgens, such as the male hormones testosterone and dihydrotestosterone (DHT), and its size changes with age. It grows rapidly during puberty, due to an increased concentration of these hormones in the body, and it usually stays about the same size in adult men, as long as male hormones are present.
Figure 3. The prostate. Schematic representation of the prostate gland (with a malignant tumour), a seminal vesicle, the urethra and the bladder. Adapted from
http://www.cancer.org/cancer/prostatecancer/detailedg uide/prostate-cancer-what-is-prostate-cancer on the September 18th, 2015.
If the prostate continues to grow, which often happens, specially in old men, it can lead to a common condition named benign prostatic hyperplasia (BPH). BPH can be a serious problem for some men, but it is not cancer. Similarly, abnormal prostate development can lead to other conditions, such as prostatic intraepithelial neoplasia (PIN), or proliferative inflammatory atrophy (PIA), and even though the concept is not fully understood, research suggests that PCa can arise from one of these pre-cancerous conditions. Adenocarcinoma represents the most common form of PCa, with 70 to 80 % of cases arising in the peripheral zone of the prostate gland (DeMarzo et al., 2003, Liu et al., 2015).
1.2.2 Epidemiology
According to a GLOBOCAN report published in 2012, it is predicted that in 2015, there will be over 300 000 deaths and 1.2 million new cases of PCa, comprising approximately 15% of all cancers diagnosed in men worldwide. This makes PCa the second most common cancer and the fifth leading cause of cancer-related deaths in men worldwide. However, if we only consider the more developed countries, PCa ranks first and third respectively (Ferlay et al., 2015).
1.2.3 Risk Factors
PCa is one of the main medical conditions afflicting male populations around the world, and when it comes to assessing the risk factors that are associated to PCa, the convergence is on age and family history. Regarding the incidence of PCa, it increases dramatically in men over 60 years old, and peaks in men over 75 years old. Another interesting fact is that PCa was never observed in men younger than 15 years of age, hinting for the critical role of androgens in PCa development (Ferlay et al., 2015). Concerning family history, the risk for PCa is at least two fold higher if one first-line relative manifested the disease, and there is a 5 to 11-fold increase in the risk if there are two or more first-line relatives with history of prostate cancer (Grönberg et al., 1996). This points to a hereditary form of PCa, and several susceptibility genes have been identified, though none of them show high penetrance. A few examples are: namely hereditary prostate cancer 1 (HPC-1), breast cancer 1/2 (BRCA1/2), homeobox B13 (HOXB13), Nijmegen breakage syndrome 1 (NBS1), checkpoint kinase 2 (CHEK2), PALB2, among others (Eeles et al., 2014, Mazaris and Tsiotras, 2013).
The correlation between the genetic variants of these and other genes with PCa needs to be further investigated, as most of them show low frequency in the population at-risk, which is why the fusion protein TMPRSS2-ERG, originating from two oncogenes, seems of particular interest, considering the high frequency shown. When coupled to the loss of PTEN and concomitant activation of AKT, this
Figure 4. TMPRSS2-ERG fusion protein. Loss of PTEN may act with the TMPRSS2-ERG fusion protein leading to PCa progression. PIN - prostatic intraepithelial neoplasia; ARE - androgen receptor elements; TA - transcriptional activators; TF - transcription factors. Taken from Squire, J. 2009. TMPRSS2-ERG and PTEN loss in prostate cancer. Nature Genetics 41: 509-510. include race, physical activity, diet, smoking and sexual activity (Patel and Klein, 2009). Therefore, it seems that hereditary factors are crucial in determining the risk of developing clinical PCa, but exogenous factors may have an important impact on this risk. The doubt dwells on whether there is enough evidence to recommend changes in the patients’ lifestyle that would decrease the risk, specially considering that gene testing is not a common practice in the clinic for PCa.
1.2.4 From Screening to Diagnosis and Classification
Early detection of PCa is crucial for the patients’ outcome, and screening approaches are usually performed on asymptomatic but at risk patients. These are based on serum prostate-specific antigen (PSA) levels coupled with digital rectal examination (Smith et al., 2007).
Men with elevated PSA levels that show a free-to-total PSA ratio of less than 20%, and also present a PSA velocity higher than 0.75 ng/mL/year, have higher risk of developing PCa. In this situation, transrectal ultrasound guided biopsy of the prostate is recommended, being the main diagnostic tool used in the clinic (Heidenreich et al., 2014a).
1.2.5 Pathogenesis
Most cases of prostate cancer seem to be sporadic, with various molecular pathways involved in the different stages of pathogenesis. In those pathways are included tumour suppressor genes, such as p53,
PTEN, p27, NKX3.1, as well as oncogenes like c-MYC, Bcl-2, PSCA, CYP17, among others (Mazaris
and Tsiotras, 2013).
Even though PCa appears mostly in aged men, it is thought that it usually develops throughout many years, with PIN being the most likely precursor entity that eventually transitions into the invasive PCa
(DeMarzo et al., 2003). PIN exhibits cell modifications that mirror those of cancer, either being cellular proliferation, or other genotypic and phenotypic abnormalities that balance the scale between normal epithelium and cancer. It should be noted though that not every patient with PIN will develop an invasive disease. What makes the balance shift in favour of PCa insurgence are the molecular mechanisms related to oncogenes/tumour suppressor genes, microenvironment, and the androgen receptor (AR), which is thought to play a central role throughout the entire process of PCa (Logothetis
et al., 2013).
1.2.6 Androgen Receptor Signalling
Androgen receptor signalling is crucial for both normal prostate function and growth and differentiation of prostate cancer cells. The human AR gene is located on chromosome X
(Xq11.2-q12) and has 8 known exons, being around 180kb long. It codes for a protein of around 110kDa that
has 3 major functional domains: a transcription regulatory region in the N-terminal domain (NTD), encoded by exon 1 and representing 60% of the protein; a DNA-binding domain (DBD), encoded by exons 2 and 3, which contain 2 zinc finger motifs responsible for determining the DNA sequences recognized by the receptors; and a C-terminal ligand-binding domain (LBD), encoded by exons 4 to 8, where androgen binding regulates the transcriptional activity of the receptor .
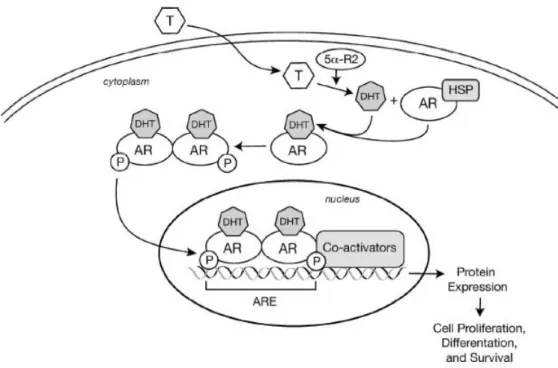
Figure 5. AR mode of action schematics. Conversion of testosterone to DHT by 5a reductase; binding of DHT to AR leads to its dissociation from HSPs, causing dimerization and translocation into the nucleus, where it binds to specific DNA sequences, or androgen response elements (AREs); series of co-activators are recruited which ultimately leads to cell proliferation, differenciation and survival. Taken from Velcheti, V., Karnik, S., Bardot, S. & Prakash, O. 2008. Pathogenesis of Prostate Cancer, Lessons from Basic Research. The Ochsner Journal 8: 213-218.
1.2.7 Treatment, mCRPC, and Resistance to Therapy
Prostate cancer usually has a long latency period, ranging from several months to several years, with patients having a higher life expectancy when compared to other types of cancer. However, as the disease progresses to a more advanced stage and becomes metastatic (mPC), resistance to hormone deprivation therapy rapidly follows which is manifested as castration resistant prostate cancer (CRPC), eventually leading to the death of the patient.
For localized prostate cancer treatment options include prostatectomy, radiation therapy and androgen-deprivation therapy (ADT), usually in a combined fashion. When the disease spreads and is no longer localized, which happens primarily to the bones but also to the lymph nodes and other sites, such as visceral metastasis, androgen ablation is still ensued. This is done in order to reduce the production of androgens by the testis, and the procedures are either orchiectomy, the use of LHRH analogues and antagonists, or androgen blockade, which is a combination of one of the previous two options coupled with an antiandrogen (i.e. finasteride). However, after an initial response which can differ between patients, the disease eventually progresses despite castration levels of testosterone in circulation, and the patient enters a new stage of the disease termed castration resistant prostate cancer, which has an average overall survival of 1.5 years, depending on the extent of metastasis.
Men with mCRPC can continue to receive radiotherapy and other second line hormonal therapies, but with these having more of a palliative role, while chemotherapy becomes the standard form of treatment. For this matter, Docetaxel is the gold standard as first line chemotherapy. It binds and
stabilizes β-tubulin, preventing its disassembly from the microtubule network, which in turn leads to cell death by mitotic catastrophe, since it stabilizes the mitotic spindle during the G2-M phase, causing cell cycle arrest. Another mode of action relies on lowering the apoptotic threshold by inhibiting Bcl-2
and other anti-apoptotic family members, which allow stressed cells to undergo apoptosis (Kavallaris,
2010). Recently, the STAMPEDE study suggested that Docetaxel should be considered not only for men with mCRPC, but also for men with high risk and non-metastatic disease (Prostate Cancer: Summary from ASCO 2015)
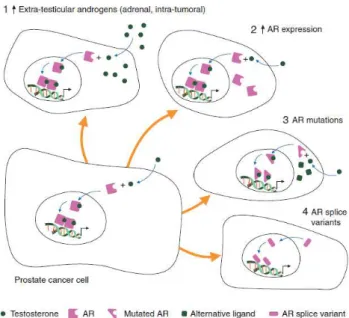
Nevertheless, this stage of the disease is no longer termed as androgen independent, as it previously used to be, even though androgen ablation therapy is non-responsive, since AR signalling remains active as a main inducer of cancer progression. Possible explanations reside on compensatory mechanisms, including AR gene amplification, incomplete interruption of the ligand-dependant AR activation, aberrant AR co-regulator activity, AR mutations, AR and growth factors cross-talk
Figure 6. Schematic representation of possible mechanisms of resistance to chemotherapy. Taken from Chi, K., Hotte, S. J., Joshua, A. M., North, S., Wyatt, A. W., Collins, L. L. & Saad, F. 2015. Treatment of mCRPC in the AR-axis-targeted therapy-resistant state. Ann Oncol 10.1093/annonc/mdv267.
2. DeMarzo, A. M., Nelson, W. G., Isaacs, W. B. & Epstein, J. I. 2003.
Based on these findings, novel chemotherapeutical agents have been developed and carefully evaluated in clinical trials, with the most commonly used AR-axis-targeted (ARAT) therapies for the treatment of mCRPC being Abiraterone Acetate (AA) and Enzalutamide (Enza). AA is a CYP17A1
inhibitor, inhibiting both 17α-hydroxylase and 17,20-lyase activities, therefore blocking androgen synthesis in the testes, adrenal glands and tumour microenvironment (Yin and Hu, 2014). Besides its use in mCRPC treatment, studies point to its potential in chemotherapy-naive patients in earlier stages of the disease, and also as adjuvant therapy for mCRPC (Hoy, 2013). Enza has a broader spectrum of action, affecting not only the interaction of the AR with its co-regulators, but also chromatin binding and nuclear translocation of the receptor. Studies suggest beneficial effects not only in chemotherapy-naive mCRPC patients, but also in patients who previously failed chemotherapy (Beer et al., 2014). Other compounds that are not ARAT specific also exist, namely cabazitaxel, sipuleucel-T and Radium-223, with the first one being used for Docetaxel resistant patients, the second as an immunotherapeutic agent, and the third for skeletal metastasis (Chi et al., 2015).
lethal concentrations of this drug (Seruga et al., 2011). In terms of inherent mechanisms to mCRPC resistance, some examples are AR gene amplification, mutation and/or overexpression of the AR receptor, overexpression of AR coactivators, aberrant kinase pathway activation, and expression of AR splice variants. These splice variants of the AR lack the ligand-binding domain, and though not capable of binding DHT or other androgens, they remain constitutively active and are able to promote or activate target genes (Chi et al., 2015).
1.2.8 Proposing a New Molecular Classification for PCa
The course of treatment varies from patient to patient, and the current clinical model for prostate cancer groups patients by similar prognosis, for example: if there is a response to ADT, if the patient has developed metastasis and where, if the patient is under chemotherapy or not. This is done based on morphologic criteria such as the Gleason Score, and doesn't consider that the stage of cancer progression will determine if a therapeutically agent is effective or not.
To overcome this limitation, Logothetis et al. proposed a new classification system where molecular
markers define a specific stage of progression in order to guide therapy selection, independent of the tumour stage. This would incorporate the 3 molecular mechanisms that most commonly drive prostate cancer progression: AR, oncogenes/tumour suppressor genes, and tumour/bone microenvironment
(Vogelstein and Kinzler, 2004).
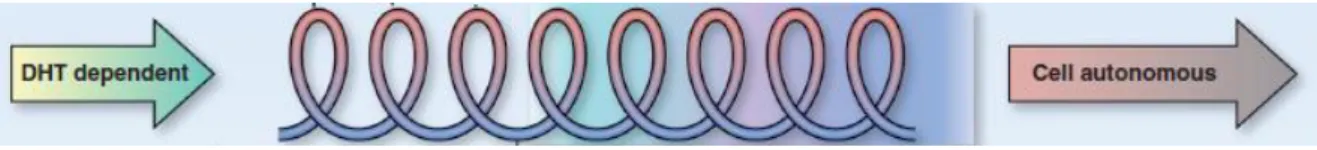
In this alternative model, illustrated in Figure 7, tumour progression is grouped in three categories: endocrine-driven, microenvironment-dependent, and tumour cell-autonomous. For the first category, treatment would be based on inhibiting DHT formation through the use of ADT. Disease progression would lead to a transition from an endocrine, dependent on gonadal hormones, to a paracrine phase, dependent on microenvironment factors, which alerts for the potential lethal progression of the cancer. Thereafter the patient would be in a stage the authors coined "progressive spiral", in which the 3 "drivers" of PCa would act synergistically, leading to a tumour adaptation over time, with the tumour altering the microenvironment and vice-versa. In the last stage of the disease, where there is no positive therapeutic effect, cancer cells would exit these spiral loops and become tumour cell-autonomous, characteristic of a big increase in tumour mass and in which cells do not secrete PSA or express AR. Nonetheless, this does not mean they are independent of AR signalling (Logothetis et al., 2013).
Figure 7. Illustrative figure of a new model of classification for PCa. Transition between the endocrine-driven phase (DHT dependent), the microenvironment-dependent phase ("progressive spiral"), and the tumour cell-autonomous phase. Taken from Logothetis, C. J., Gallick, G. E., Maity, S. N., Kim, J., Aparicio, A., Efstathiou, E. & Lin, S. H. 2013. Molecular classification of prostate cancer progression: foundation for marker-driven treatment of prostate cancer. Cancer Discov 3: 849-61.
mean that the patient became resistant to the compound being used, ensuring change in the therapeutical approach.
1.2.9 Biomarkers
Biomarkers can be of different nature, including proteins, RNAs such as mRNAs or miRNAs, DNA, or even other factors or signatures of combined nature (Ploussard and de la Taille, 2010)
PSA as a biomarker really made an impact in prostate cancer management, but its use remains controversial to some extent, since activities that are unrelated to the presence of cancer can induce the expression and secretion of this molecule (Duijvesz et al., 2011). This makes it so that an invasive procedure such as a prostate biopsy still remains the only diagnostic tool available, highlighting the need for new biomarkers that improve early PCa detection. Not only this, but following in on the previous subchapter (Proposing a New Molecular Classification for PCa), it is of crucial importance to identify biomarkers that are prognostic and/or predictive of response to therapy, thus allowing for changes in the course of treatment as early as possible. Even though none of the following have been validated as predictive biomarkers, factors such as duration of response to ADT, Gleason Score, PSA response, androgen levels at baseline, chromogranin A, and the fusion protein TMPRSS2-ERG are good examples.
PCa biomarker discovery has focused on protein expression changes and aberrations in the AR gene. Other potential candidates are nuclear AR, cytoplasmic CYP17 expression, AR amplifications, and AR copy number, with some of these being associated with poor response to ARAT agents such as AA and Enza (Chi et al., 2015).
presence of a specific splice variant of the androgen receptor in CTCs, the AR-V7, is not only associated with resistance to AA and Enza in patients with mCRPC, but can also provide information on tumour status and stage of disease progression (Antonarakis et al., 2014).
On a similar fashion to CTCs, another possible source of biomarkers relies on extracellular vesicles, and more specifically, exosomes. Cancer cells have different genotypic and phenotypic profiles compared to normal cells, and since these vesicles share their content with the vesicle-producing cells, exosomes derived from cancer cells would share similar molecular profiles and could, therefore, carry the same and/or different markers. The even higher suitability of these vesicles as biomarkers resides on the fact that they are produced by all cells (studied in this regard thus far) and can be isolated from circulating fluids, such as blood and urine, without the need of more invasive procedures (Øverbye et al., 2015).
1.2 EXOSOMES
Communication between cells is a crucial hallmark for the survival of multicellular organisms. If, for example, we look at the communication that occurs between tumour and stromal cells, or even between tumour and more distant cells, this is accomplished by: cell-cell interactions, such as tight-junctions; paracrine mechanisms, including growth factors, proteases and chemokines; and also by extracellular vesicles (EVs). EVs are secreted by cells both under physiological and pathological conditions, such as cancer, with exosomes being the most studied type of EV (Kharaziha et al., 2012).
Exosomes were first discovered in 1987 by Johnstone et al., under the observation that sheep reticulocytes under maturation secreted exosomes in order to excrete the transferrin receptor (Johnstone
et al., 1987). These and other EVs were initially regarded as having no biological significance other
than excreting debris and unwanted material from the cell, until Raposo et al. demonstrated that EVs
could indeed hold biological significance, in this case by stimulating adaptive immune responses
(Raposo et al., 1996).
Other types of EVs include microvesicles, apoptotic bodies, and others, which often have overlapping nomenclature and/or definition, not to mention that different reports tend to have different definitions of the same EVs. Apoptotic bodies are the overall biggest, with sizes ranging from 500nm to 2000nm, and they are characteristic of cells undergoing apoptosis, containing fragments of the nuclear components and cellular organelles. Microvesicles are smaller in size when compared to apoptotic bodies, but still show sizes from 50 to 1000nm, while floating at a high density on a linear sucrose gradient (Mathivanan et al., 2010).
Exosomes are the smallest of the three and have a more confined size range, between 50 and 150nm. They are homogenous in shape, with a characteristic "cup" format when visualized by electron
microscopy, and float on a linear sucrose gradient at densities between 1.13 and 1.19 g/mL (Thery et
Figure 8. Illustrative figure of molecular constitutents of exosomes. Taken from Kharaziha, P., Ceder, S., Li, Q. & Panaretakis, T. 2012. Tumour cell-derived exosomes: a message in a bottle. Biochim Biophys Acta 1826: 103-11.
1.3.1 Composition
The underlying mechanism of exosome function is not fully understood, but their complexity can easily be observed just by looking at their molecular composition. Their content, illustrated here in Figure 8, usually reflects that of the originating cells. They contain a variety of proteins and nucleic acids (DNA, mRNA, miRNA, lncRNA, rRNA and mtDNA), and are usually enriched in specific proteins, such as the
tetraspanins CD63, CD81, CD82, CD9, among others
(Gajos-Michniewicz et al., 2014). Some of these proteins are involved in multivesicular body formation, such as Alix, TSG101, clathrins, while other proteins are of endosomal origin, such as Annexins,
Rab GTPases and SNAREs. Another interesting characteristic is that exosome´s lipid bilayer also differs from the originating cells, conferring added rigidity and stabilizing these vesicles in biological fluids. The differences are in the enrichment of lipid rafts, phospholipids, diglycerides, glycerophospholipids, phosphatidylinositol, sphingolipids, and others (Kharaziha et al., 2012). Some of these molecular entities serve as exosomal markers.
1.3.2 Biogenesis and Uptake
Flowing in the other direction we have exosome uptake by recipient cells, which can be located at distant sites or in the vicinity of the secreting cells. This can be done by the following mechanisms: fusion of the cell membrane with the exosomes, leading to a direct release of the exosomal content in the cytoplasm; receptor proteins that facilitate exosomal binding with the target cells; and endocytosis
(Gajos-Michniewicz et al., 2014).
1.3.3 Isolation and Characterization
In order to be able to perform exosomal studies it is crucial to employ proper and standardized exosome isolation techniques, with the goal being the isolation of exosomes from cell culture supernatants and/or body fluids (i.e. urine, blood). The gold standard in terms of isolation is differential ultracentrifugation. The tricky part of working with exosomes resides on the contamination of the exosome preparations by other EVs (i.e. microvesicles), since this is a size exclusion-based procedure, and the even though exosomes have very specific size-ranges, other EVs can have an overlapping spectrum. One way of purifying an exosome sample is to run it through a sucrose density gradient, based on the principle that vesicles other than exosomes float on different densities. The size distribution of your exosome isolation and particle count can be determined by nanoparticle tracking analysis (NTA). To complement these methods, imaging techniques such as transmission electron microscopy (TEM) are used in order to visualize and determine size and morphology of the isolated exosomes. In addition to these physical characteristics, they express exosomal markers such as the tetraspanins CD9, CD63, CD81, the tumour susceptibility gene 101 (Tsg101), Rab5, and Alix, which are routinely used for exosome characterization. The validity of these markers on an exosome isolation can be assessed by western blot, immunophenotyping using exosomes bound on beads, or by sucrose gradient fractions (Thery et al., 2006).
In recent years, efforts have been made to adapt already existing techniques to exosome isolation and characterization, such as microfluidic devices, flow cytometry based techniques, among others, but the aforementioned procedures remain the gold standard. It is important to mention though that the reason for this not only resides on the technical difficulties of working with very small particles, but also in the importance of having globally used techniques from which results stemming from different studies can be compared and extrapolated (Thery et al., 2006).
1.3.4 Potential Functional Activities
has also been observed that body fluids from cancer patients showed an increase in exosome levels when compared to healthy controls (Azmi et al., 2013). These observations seem to indicate that exosomes might have different functions depending on the cells they originate from. On a physiological role, exosomes not only transfer DNA, RNA and proteins to other cells, but also modulate immune response and present antigens to immune cells (Andaloussi et al., 2013). But exosomes also seem to play an important role in the cancer setting: they can promote metastasis; alter the phenotypic characteristics of recipient cells; differentiate normal fibroblasts to myofibroblasts in a pro-tumour growth fashion; transfer resistance to chemotherapy; and stimulate cell migration and invasion (Costa-Silva et al., 2015).
A revolutionary finding was unravelled this year, showing that exosomes might not only be responsible for the transport of bioactive molecules, but might also have the potential to synthesize or at least process those same molecules. In this regard, Melo et al. showed that exosomes have the ability to perform cell-independent miRNA biogenesis and therefore promote tumorigenesis as an individual entity (Melo et al., 2014).
1.3.5 Clinical Benefits as a Source of Biomarkers
The possibility of malignancy or disease detection by non-invasive means, coupled to the concept that exosomes represent molecular fingerprints of the secreting cells, puts these vesicles in the focus of biomarker research (Duijvesz et al., 2011)
Following this idea, several studies incorporating proteomics and transcriptomics approaches have been applied on exosome research (Dijkstra et al., 2014, Duijvesz et al., 2013, Øverbye et al., 2015).
One example that revolutionized the field, and that took any possible doubt out of the idea of using exosomes as biomarkers, was the study performed by Melo et al. It shows that Glypican-1, a membrane-anchored protein that is overexpressed in breast and pancreatic cancer, can be used as a biomarker that distinguishes cancer exosomes from normal exosomes. Moreover, it also suggests that Glypican-1 positive exosomes may serve as screening and diagnostic tool for detection of early stages of pancreatic cancer, with absolute specificity and sensitivity (Melo et al., 2015).
1.3 AIM OF THE STUDY
The aim of this project is to study prostate cancer-derived exosomes, with special focus on resistance to therapy.
For that purpose, we developed cell lines that are resistant to specific chemotherapeutic agents used in the treatment of mCRPC. This was done on a progressive fashion, starting with the golden standard of CRPC therapy, Docetaxel (Taxotere) and with a recently introduced anti-cancer agent, Abiraterone Acetate (Ryan et al., 2013). The cell lines in question are LNCaP, a non-metastatic prostate cancer cell line, mimicking initial stages of the disease, and DU145, highly metastatic, representing an advanced stage of prostate cancer. The cell line model used was: first, DU145 and DUR (resistant to Docetaxel); second, DU145, DUAAR (resistant to Abiraterone Acetate), LNCaP, and LNAAR (resistant to Abiraterone Acetate).
2. MATERIALS AND METHODS
Antibodies and reagents
The primary antibodies used in this study were: Rab 5, CD81, CD82, Alix, Emmprin and Caveolin-1, from Cell Signaling Technology; TSG101, CD9, CD82 and PACSIN2, from Abcam; MDR-1 and MDR-3, from GeneTex; AIF, CD9, CD63, CD81, Endophilin A2, PACSIN2 and AR (N-20), from Santa Cruz Biotechnology; CYP17A1, from Novus Biologicals. The HRP-conjugated secondary antibodies, anti-mouse and anti-rabbit, were obtained from Cell Signaling Technology.
The chemotherapeutical agents Docetaxel and Abiraterone Acetate were obtained from Seleck Chemicals.
Cell lines and culture conditions
All cell lines were obtained from ATCC: DU145 (ATCC® HTB-81™) is derived from a human prostate
adenocarcinoma metastatic to the brain; LNCaP (ATCC® CRL-1740™) is also a human prostate cancer
cell line, established from a metastatic deposit in a lymph node.
The resistant cell lines were generated by growing the cells with increased concentrations of the respective drug for several weeks. DUR cell line was treated with Docetaxel until growth was observed at a final concentration of 500 ng/mL. DUAAR and LNAAR cell lines were treated with Abiraterone Acetate until growth was observed at final concentrations of 30 µM and 20 µM,
respectively. All cell lines were cultured in 175 cm2 flasks using RPMI 1640 (Hyclone), supplemented
with 10% Fetal Bovine Serum (Hyclone), 2mM L-Glutamine, and 50 µg/mL of Penicillin and Streptomycin (GIBCO). For exosome isolation cells were cultured for 48 hours in vesicle depleted medium, as described below.
Conditioned Media and Exosome Isolation
Exosomes were isolated from cells cultured in conditioned medium. In order to deplete vesicles from medium, RPMI 1640 supplemented with 30% Fetal Bovine Serum (FBS) was ultracentrifuged overnight at 120,000g, 4ºC. The pellet was discarded and the supernatant was then filtered through a
0.22 μm vacuum system, diluted with RPMI 1640 to reach a 10% final concentration of FBS, and supplemented with 2mM L-Glutamine, 50 µg/mL Penicillin and Streptomycin.
Cells were cultured in conditioned media in multilayer flasks (Millicell® HY, from Millipore) until they reached 70 to 80% confluency (48-72h). Supernatants were then collected, centrifuged at 1000g
at room temperature and filtered through a 0,22 μm vacuum system. Supernatants were then frozen at
-20oC. Prior to exosome isolation the supernatants were thawed at 4oC and centrifuged at 120,000g for 2h at 4ºC. The supernatants were discarded and the pellets were washed in a phosphate buffered solution (PBS) and ultracentrifuged again for 120,000g for 2h at 4ºC. The resulting exosome pellet was then ressuspended in 1x PBS (100 µL to 500 µL) and stored at -80ºC. Exosomes used for Western blotting were ressuspended directly in 1xRIPA buffer
Western blotting
Cells and exosomes were lysed in a modified RIPA buffer. This buffer contains 50mM Tris, 150mM NaCl, 1mM EDTA, 1% IGEPAL, 1% glycerol (pH adjusted to 7.4), with added PhosSTOP and Phosphatase Inhibitor Cocktails (Roche), Complete Protease Inhibitor Cocktail (Roche), 100mM vanadate (Life technologies), and 1mM dithiothreitol (DTT) (Sigma Aldrich). For exosomes ressuspended in PBS, a 4 times concentrated RIPA buffer was used,
After lysis of cells and/or exosomes for 30 minutes on ice with 1x or 4x RIPA buffer, respectively, protein concentration was determined using a Bradford assay (Bio-Rad). Equal amounts of protein
(15μg unless stated otherwise) were denatured for 5 minutes at 90ºC, and resolved by SDS-PAGE (sodium dodecyl sulphate - polyacrylamide gel electrophoresis) in 10 or 12% Bis-Tris gels (Life Technologies), according to manufactures instructions. Proteins were then transferred to PVDF membranes (Perkin Elmer) and blocked in 5% (w/v) non-fat dry milk in 1x TBST, for 1hour in room temperature. The blots were then probed with specific primary antibodies (1:1000 dilutions unless stated otherwise), and then with horseradish peroxidase-conjugated secondary antibodies (1:2000). The bands were detected by chemiluminescence using ECL, ECL+, ECL pro or ECL ultra (PerkinElmer) after exposure on X-ray films (CL-exposure Film, Thermo Scientific).
Sucrose density gradient
Nanoparticle Tracking Analysis (NTA)
For the secretion study, NS500 (Nanosight Limited, London, UK) was used, equipped with an 8 mega pixel camera (Andor Technology, Tokyo, Japan) and a 405 nm laser, in order to measure the size and determine concentration of exosomes. NTA v2.3.0.17 software (NanoSight Limited) was used for both data acquisition and analysis. Three samples from each exosome type were measured and their average was calculated. The duration of each video was 5 minutes. During the analysis procedure the camera level was 14 and the detection threshold was 15.
Electron Microscopy – negative staining
3μl of the sample were added to a grid with carbon supporting film for 5 minutes and then the grid was rinsed by adding 5μl dH2O for 10seconds, soaked off and stained with 1% uranyl Acetate in water for 10 seconds and air-dried. A Tecnai 12 Spirit Bio TWIN transmission electron microscope (FEI Company, Eindhoven, Netherlands) at 100kV was used for the examination of the samples. A Veleta camera (Olympus Soft Imaging Solutions, GmbH, Munster, Germany) was used for capturing digital images.
Mass Spectrometry/Proteomics
3.
RESULTS
This section will be divided in two parts, since this study was done on a sequential fashion, with the first part addressing biomarkers for resistance to Docetaxel, and the second part for resistance to Abiraterone Acetate.
3.1. Exosomes originated from Docetaxel sensitive (DUS) and resistant (DUR cells)
DU145 cells
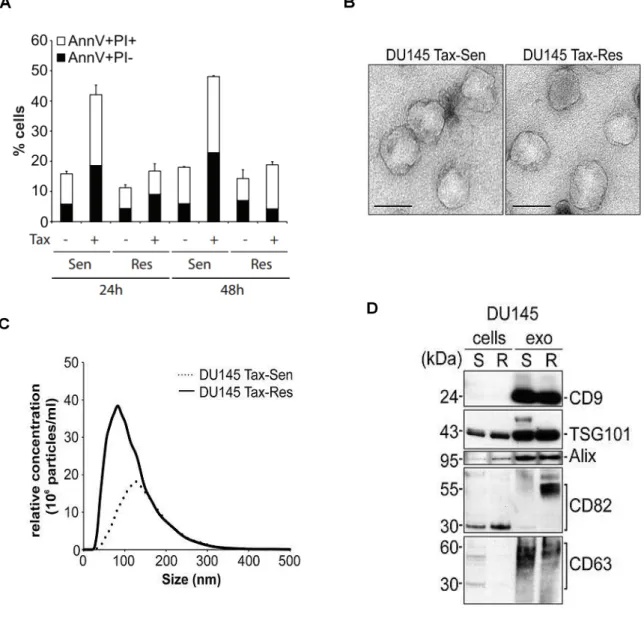
We have generated DU145 cells stably resistant to 500 ng/mL of Docetaxel (DUR cells). Figure 3.1A shows an Annexin V/PI staining comparing cell death profiles between DUS and DUR cells, after 24h and 48h treatment with 50 ng/mL Docetaxel. Results indicate that DUR cells do not undergo cell death after treatment, while there is a more than double percentage increase in terms of cell death in the DUS cells, both at 24h and 48h of treatment.
We have isolated exosomes from the supernatants of these 2 cells lines, DUS and DUR, and proceeded to their characterization.
3.1.1. Exosome Characterization
Transmission Electron Microscopy images, presented in Figure 3.1B, show that exosomes isolated from both DUS and DUR cell lines have an homogenous structure, with a median diameter of about 100 nm. Nanoparticle tracking analysis (NTA) provided a size distribution profile plus a relative concentration of the isolated exosomes, as shown in Figure 3.2C. Regarding particle size, most of the isolated vesicles are around 100 nm, with the DUS exosomes being slightly bigger than the DUR exosomes. Besides, NTA particle concentration values indicate that DUR cells secrete more exosomes than DUS cells.
Next we evaluated the presence of generic exosome markers by western blot analysis, represented in Figure 3.1D. Both DUS exosomes and DUR exosomes seem to be enriched in TSG101, CD9 and Alix, when compared to the cells that secrete those same exosomes. From the evaluated markers, only CD82 seems enriched specifically in DUR exosomes and not in DUS exosomes.
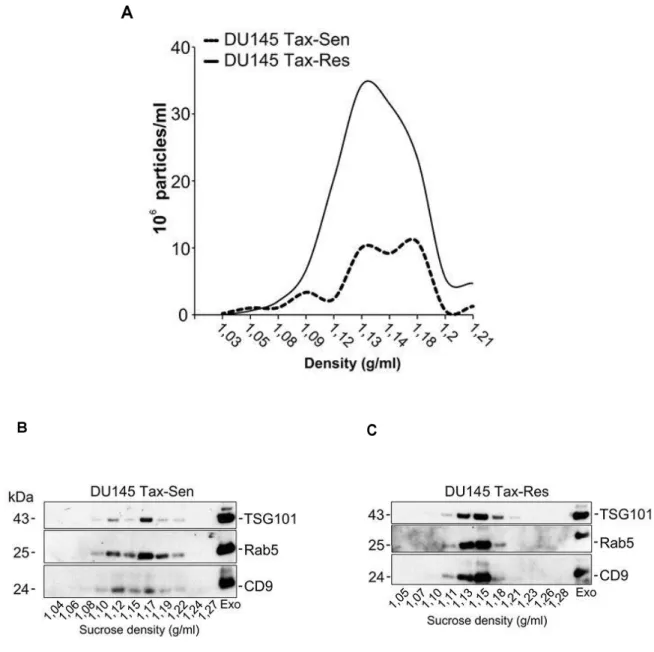
typically float at densities between 1.13 and 1.19 g/mL (Thery et al., 2006), and Figure 3.2A not only hints at a relatively good yield, since most particles isolated float at those densities (1.12 to 1.19 g/mL, seen by NTA), but also supports the hypothesis proposed in Figure 3.1C, that DUR cells secrete more exosomes than DUS cells. These sucrose gradient fractions were then analysed by western blot for the presence of classical exosomal markers, as seen in Figure 3.2B, C. Both DUS and DUR exosomes show enrichment in TSG101, Rab5 and CD9 in the characteristic exosome fractions. Interestingly, DUS exosomes present a broader density distribution, between 1.12 and 1.19 g/mL, when compared to DUR exosomes, between 1.13 and 1.18 g/mL.
3.1.2. Proteomics Profiling of exosomes
Proteomics analysis of DUS and DUR exosomes identified 914 proteins (criteria of at least 1 peptide
with an FDR ≤ 1%) by nLC-MS/MS (Kharaziha et al., 2015). As illustrated by the Venn diagram shown in Figure 3.3A, of these 914 proteins, 146 were unique for DUR exosomes, 417 were unique for DUS exosomes, and 351 were common for both.
The next step was to perform bioinformatics analysis, and using the Ingenuity software, we identified the top 12 pathways in which these proteins are involved, as shown in Figure 3.3B. With no major differences between DUS and DUR exosomes, 3 pathways were found to have slight differences - epithelial adherence junctions, remodelling of adherence junctions, and eIF2 signalling. We also did
additional classification of these proteins, using Gene Ontology (GO) annotations from PANTHER™,
in regards to biological processes, molecular functions, cellular component, and protein class, as shown in Figure 3.3C. DUR exosomal proteins seem to be more involved in processes such as metabolic activity and nucleic acid binding, while DUS exosomal proteins were more related to processes like biological adhesion, cellular organization, enzyme regulation and receptor activity.
Based on unsupervised hierarchical clustering of the total number of proteins, we then selected the top 100 proteins in terms of abundance in DUS and DUR exosomes. These top 100 proteins are represented in the form of a heat map in Figure 3.4A, which shows differences between DUS and DUR cells, between DUS and DUR exosomes, and between cells and exosomes of the same cell line.
3.1.3. Validation
Caveolin-1. Interestingly, MDR1 was enriched in DUR exosomes and found absent in DUS exosomes, with other proteins also showing differences between these two samples. TSG101 and Rab5 were used as exosomal markers, while AIF was used for quality control of the exosomal isolation. To further assess the validity of these results, we probed for MDR1 and MDR3 after loading DUS and DUR exosomes on a sucrose gradient, using TSG101 as an exosomal marker.
3.2. Exosomes originated from Abiraterone Acetate sensitive and resistant DU145 and
LNCaP cells
We have generated DU145 cells and LNCaP cells resistant to 30 and 20µM of Abiraterone Acetate (AA), respectively, DUAAR and LNAAR cells. Figure 3.5 shows cell death profiles of DU145-DUAAR and LNCaP-LNAAR cells after 48h treatment with 30 and 20µM of AA, respectively. Results indicate that the DUAAR cells have acquired some resistance to AA. LNCaP cells did not undergo cell death in response to AA but even in this setting there was a small decrease in the amount of dead cells in AA treated LNAAR cells. Further evidence for the acquisition of resistance to AA come from the iCELLigence studies (ACEA Biosciences). There is a considerable difference in the cell proliferation of LNAAR cells showing higher proliferation rates compared to LNCaP cells (Figure 3.6). DUAAR cells also show increased proliferation compared to DU145 cells, but to a lesser extent. Due to limitations in the usage of the iCELLigence equipment data we have not quantified the statistical significance of these data but these experiments are planned and ongoing. .
We have isolated exosomes from the supernatants of these 4 cells lines, DU14, DUAAR, LNCaP, and LNAAR, and proceeded to their characterization.
3.2.1. Exosome Characterization
Transmission Electron Microscopy (TEM) images, show that exosomes isolated from DUAAR and LNAAR cell lines present the characteristic exosomal structure (Figure 3.7A). The size measured in the TEM, indicate that these vesicles have diameters of approximately 100nm. Nanoparticle tracking analysis (NTA) provided a size distribution profile and a relative concentration of the isolated
exosomes, as shown in Figure 3.7B. All cell lines show a typical size distribution profile of isolated
Next, we evaluated the presence of generic EV markers by western blot analysis, represented in Figure 3.8A. All exosome populations seem to be highly enriched in both CD9 and CD81 when compared to the originating cells. From the evaluated markers, other observations that might be of value are the higher abundance of TSG101 and Alix in LNAAR exosomes when compared to all other samples. Rab5 was in lower abundance in both LNCaP and LNAAR exosomes when compared to all other samples, and also demonstrated different size and/or different sedimentation profile that Alix presents in whole cell lysates compared to exosomes.
Further characterization involved loading exosomes into linear sucrose gradients to evaluate the presence of exosome markers in the characteristic exosome densities, done by western blotting. Exosomes typically float at densities between 1.13 and 1.19 g/mL (Thery et al., 2006), and Figure 3.8B shows a western blot analysis of the DUAAR and LNAAR exosome sucrose fractions. This result points to a relatively good exosome yield in terms of purity, since the bands for the evaluated markers, Alix and CD9, show enrichment or higher abundance in the characteristic densities where exosomes tend to float (1.12 to 1.19 g/mL). Another observation is that DUAAR exosomes have a broader distribution when compared to LNAAR exosomes.
3.2.2. Proteomics Profiling of exosomes
Proteomics analysis of DU145, DUAAR, LNCaP and LNAAR exosomes identified several proteins
(criteria of at least 1 peptide with an FDR ≤ 1%) by nLC-MS/MS (data not shown).
We performed bioinformatics analysis, and we classified these proteins based on Gene Ontology (GO)
annotations (PANTHER™) in regards to biological processes, molecular functions, cellular
3.2.3. Validation
Bioinformatics analysis and validation is still ongoing. One interesting aspect is the enrichment of the AR in the exosomes. The efficacy of the AA is affected by the androgen receptor (AR) status, i.e. expression of the wild type isoform or alternative splice variants. We evaluated, by western blot, the presence of the AR it in our cell lines and exosomes. The uncut western blot image is shown in Figure 3.11, and only the LNCaP and LNAAR cells show a clear band characteristic of the full length
androgen receptor (AR-FL) at around 110 kDa. The LNCaP and LNAAR exosomes also seem to
Figure 3.1: Characterization of exosomes secreted from DUS and DUR cells, with prior cell death profiling of those same cells. (A) Quantitative analysis of Annexin V/PI positive DU145 and
DUR cells after 50 ng/mL Docetaxel treatment for 24h and 48h (means ± SD, n = 3); (B) Exosomes isolated from DUS and DUR cells were visualized by transmission electron microscopy (bar size: 100 nm); (C) Nanoparticle tracking analysis on an LM10 Nanosight demonstrating a mean size of 100 nm for DU145 Tax-Res and 120 nm for DU145 Tax-Sen exosomes. The size distribution and relative
concentration were calculated by the Nanosight software (n = 3); (D) Western blot analysis of 10 μg
Figure 3.2: Comparative biochemical characterization of exosomes isolated from DU145
Tax-Sen and DU145 Tax-Res cells. (A) Nanoparticle tracking analysis of sucrose gradient fractions with
Figure 3.3: Bioinformatics analysis of the DU145 Tax-Sen and DU145 Tax-Res exosomal
Figure 3.4: Proteomics profiling of exosomes isolated from DU145 and DUR cells. (A) Heat map
0% 10% 20% 30% 40% 50% 60% 70% 80% 90% 100% DU145 Ctrl DU145 treated DUAAR Ctrl DUAAR treated 0% 10% 20% 30% 40% 50% 60% 70% 80% 90% 100% LNCaP Ctrl LNCaP treated LNAAR Ctrl LNAAR treated
Figure 3.5: Cell death profiling of DU145, DUAAR, LNCaP and LNAAR cells by Annexin V/PI
Figure 3.6: Cell proliferation profiling of DU145, DUAAR, LNCaP and LNAAR cells by iCELLigence. (A) Cell proliferation assessment of DU145 cells compared to DUAAR cells after 72h
treatment with 30µM AA. Experiment was performed in duplicates, with DU145 cells represented in
red and green, and DUAAR cells represented in blue and pink; (B) Cell proliferation assessment of
LNCaP cells compared to LNAAR cells after 72h treatment with 20µM AA. Experiment was
0 5E+11 1E+12 1,5E+12 2E+12 2,5E+12 3E+12 3,5E+12 4E+12 4,5E+12 5E+12
0 200 400 600 800
R e lativ e C o n ce n tr ation o f Par ticl e s/ mL
Size Distribution (nm)
DU145
DUAAR
LNCaP
LNAAR
Figure 3.7: Characterization of exosomes secreted from DU145, DUAAR, LNCaP and LNAAR
Figure 3.8: Characterization of exosomes secreted from DU145, DUAAR, LNCaP and LNAAR
Figure 3.9: Bioinformatics analysis of the DUAAR and DU145 exosomal proteome. (A) Pie charts
AR-FL - 110 kDa
AR-SVs - 75 kDa
4. DISCUSSION
Exosome production and release is a systematic event that, in normal physiological conditions, is important for the maintenance of homeostasis in living organisms. On the other hand, cancer derived exosomes have received attention in past years for their clinical relevance and possible influence in practically every hallmark of cancer. They have been shown to promote cancer progression through tumour immune evasion, horizontal transfer of mutant oncogenic proteins and RNAs, and also by modulating the tumour microenvironment (Andaloussi et al., 2013, De Toro et al., 2015). However, the role of exosomes in resistance to therapy remains somewhat elusive, and understanding the inherent mechanisms could potentially lead to the discovery of novel biomarkers that predict response to therapy.