Vol-7, Special Issue3-April, 2016, pp1390-1402 http://www.bipublication.com
Case Report
Identification and management of different risks in
the design-build contractor- contracts and
providing a method to cover them
1
Ali Babania Bazgiri, 2Fereidoon Shirvani and 3Mahmood Harischian
1MA student, Construction Management,
Azad university science and research branch, Tehran, Iran 2Faculty member, Islamic Azad University,
Shoushtar Branch, Iran
3Faculty member, Islamic Azad University,
South Tehran Branch, Iran
ABSTRACTS
In recent years, due to the interest of employers to implement more quicklyand to reduce the employer risks inconstruction and industrial projects and subsequentlyreducing the project costs, the global approach to the transfer of projects was two-factor. The problem that thedesign-buildcontractor is confronting with is the risk amount in the projects. Specific and unique complexityof the construction projects indicates the fact that the current approaches of risk management can not be responsible for management problems and issues of these projects.
Correct operation of the projects requires the implementation of a risk management system to provide successful completion of the projects;thus in this study it is attempted to present a system to manage the risks of the construction project. With respect to the components causing the risk in these projects the contractor try to determinedifferent probabilities of risk acceptance to understand that by which probability the success risk or failure risk of the project implementation ishigher or lower than a certain level. This will be implemented by identifying the risks of the design-build contracts and determining their effect, probabilityand analysis. Collecting the events causing the risk is performed using the study of past researches;determining the effects and probability of these risks is conducted via questionnaires; and the risks are analyzed using the Monte Carlo simulation method. The result is the creation of a chart, indicating the acceptance possibility of the risk different percentages.
Keywords: contract risk, two-factor contracts, risk management, Monte Carlo simulation
INTRODUCTION
One of the systems ofproject implementation is thedesign-build method that the design and implementation servicesis assigned to contractor in the form of contract based on an agreement. According to the method, the employer attempted
to make a contract with a company for design and implementation of the construction works under only a design-build contract.
source is responsible for the work and introduced to the employer (Parchami Jalal, 2001). In Iran these methods are used to assign and conduct of various industrial and civil projects. Among the main features of the two-factor method are the proper,optimum cooperation and coordination, of threeparts of design, supply and implementation. Among the benefits of thesemethods the following ones can be mentioned: lowering the implementation procedure of projects by integrating the design and implementation stages; becoming more definitive the costs and schedule of the project.
Due to reduce the risk of employers and assign the risk to design-build contractors, the problem that the design-build contractor is confronting with is the risk amount in the projects. With respect to the components causing the risk in these projects the contractor try to determine different probabilities of risk acceptance to understand that by which probability the success risk or failure risk of the project implementation is higher or lower than a certain level.
Literature and previous study
The term risk is adapted from the Italian verb of "riscara", meaning "courage to do something" (Skorupka, 2008). A risk is defined as confronting with situations or different results that the probability of each situation can be estimated and can have a positive or negative effect (Emamjomehzadeh, 2005).
A Guide to the project management body of knowledge (PMBOK 2008) defined a risk as follow: a risk is an uncertain situation or event, which if it occurs, will affect at least one of the project objectives.
One way to reduce the risk is the –making of- contracts. Michael J. Bresnen (1991) in an article
entitled " Construction contracting in theory and practice: A case study" highlighted the importance of considering the contracts, and stated that, despite the attention paid to the effectiveness of conventional methods in the past several years, many problems still surround the construction industry.
Andi (2006) in an article entitled "The importance and allocation of risks in construction projects" stated that: to effective manage of risks in construction projects it is required that the important risks will be determined correctly and assigned to contract groupsproperly. Understanding the attitudes of the building contractors and employers in importance and allocation of the risks in construction projects is an important stage in the process. Lorance and Wendling (2001) proposed that the Monte Carlo risk analysis is a useful technique.
When the three points of a triangle distribution are recognized, usually the lowest price is the most probable price, and the highest price of an expected cost can be determined from the possible values. With the help of Monte Carlo simulation technique the combination of these distribution functions can be possible.
METHODOLOGY
The probability of accepted risk percentage in implementation ofdesign-build projects is determined in several stages:
Chart 1: there research methodology
The identified risks
Based on the studies –conducted- the following events were considered,
Risks related to construction/ build:
Change in work: one of the events that create the risk is the change in work. So that, changes cause that the resources necessary to carry out an activity, as well as time and others change, which affects the failure (lack of success) of the project.
Construction delays: one of the events that affect the failure (lack of success) of the project is the construction delays, which its occurrence probability is too high and if they
occur, they will have different effects on the project.
delays in access to the site: Whatever time of access to the site is high the start of the project will be delayed further and this delay can lead to project failure; and
Implementing the projects with delay: Whatever the project is prepared with grater delay, probability of failure of the project is high and by higher increase of the delay the project process will be affected greatly.
Incorrect design: incorrect design leading to mistakes in implementation and other parts of the project that according to the inaccuracy
Identification of events creating the risk in the design-build contractor- contracts
Determination of effect of the events
The minimum, the most probable, and the maximum effect
Determination of probability of the events
The minimum, the most probable, and the maximum probability
Determination of risk of the events (The minimumrisk, the maximum risk, the most probable risk)
Determination of risk of the events (is determined by multiplying the
riskprobability by the effect of the risks)
Determination ofthe probability distribution for the risks (Utilizing the triangular distribution with the minimum, the maximum, and the most probable risk)
Is determined by considering the density function triangular distribution of each risk)
The use of Monte Carlo simulation to determine the (acceptance) occurrence probability of different risks
level in the design will have a different effect on the project.
Cost of testing and sampling: If unexpected cases/issues are occurred,testing and sampling may be required thatwhatever the tests are professional the greater cost, and consequentlythe greater risk will be imposed on the project.
Incorrect estimation of the actual work amount: whatever the shortcomings of the estimation implemented on the work is high, the time and resources needed to solve it will be high and its failure will increase. Inaccurate estimation occurrence probability is high but its effect includes a wide range.
Access to human resources: lack of access to human resources causes that the project implementation process confronts with delays and with improper allocation of resources; as a result it will affect the success of the project. This criterionhas a greater effect on the construction process.
Economic factors:
Inflation: inflation affects the success or failure of any project. Since it is of high probability,it will be considered and its effects vary from very low to very high.
Financing: the possibility of financing the project by the contractor is important and in the case of the presence of problem during the financing process, the company may be affected.
increasing the cost: One of the main failure factors of the project is the increased costs, which its probability is high in construction projects and its effect vary from low to very high.Effect of the increased costs on the construction stage is higher than that on the design stage.
Operational risk:
Employee performance: Employee performance is one of the factors causing the risk;because employee performance can cause delays and the engineering mistakes. The
effectiveness levelcan be different in each project and conditions.
Performance and efficiency of equipment: equipment can affect the success or failure of the projects. Due to the equipment failures and damages, as well as their depreciation (amortization) theiroperation efficiency is decreased, which is deleterious/ harmful. This practice is more effective in the construction stage.
Change in design: Any change in design consequently affects the other parts including planning, adopted resources and required resources and thus affects the project conditions. This factor, depending on the stage and part in which it is occurred, can represent a different effect.
Shortcomings in the features and maps: -due to the presence of- shortcomings in the maps and requirements the project implementation will be confronted with the problems, thus affects the failure/success of the project.
Improper quality control: if the quality control of the project is considered with less intensity/precision, the different parts will confronted with problems. This factor can be more effective in the construction stage.
Incorrect project management: One of the main factorsaffecting the success or failure -of the project- is the project management. The use of efficient management systems andregular organizational structures can affect the success of the project. The project management is used in the implementation part and construction stage.
Incorrect cost estimation: cost estimation is one of the project activities that has a great impact on the success and failure of the project. In case of incorrect estimation, financing and supply of other resources will be confronted withproblem.
The possibility of incorrect implementation of the activity required is high and its effect has a wide range.
Labor disputes/ conflicts: very much labor and employee disputes can be seen in the construction related projects. The effect of these disputes at the lowest level can cause to slight interference in the project procedure and in severe cases can stop the project.
Site security: One of the issues that must be considered in construction projects is the site security. Because, the lack of safety resulted in occurrence of various events including the destruction of part of the project performed or the loss of some ones of the projects.
Contractual issues
Delay in ending the disputes: whatever more timespent to end the disputes and conflictsthe delays of other sectors is increased and consequentlyaffected the success of a project.
Change in the orders: Change in any part of the project process cause tointerferenceof the project implementation. Change in the orders is one of the changes.
Bankruptcy of the employer: always in the projects a situation arises that cause to the possible inadequate funding by the employer or in its acute form cause to bankruptcy of the employer. The possibility of the employer bankruptcy is low; however, in the case of occurrence, it will affect the failure of a project greatly.
Inadequate insurance coverage: Insurance is one of the essential issues for the success of the project. Since, in the case of occurrence of
unpredictableevents, the project will be under difficult conditions. Besides, the probability of timely completion of the project will be reduced.
External factors
Environmental issues: construction/civil projects are usually on a large scale and widely are in contact with the environment. Any negative effect on the environment can delay the projects process.
Regulations: conditions existing in the regulations will affect the implementation method of the projects and their misunderstanding and changing could lead to problems in implementing the projects.
Permissions: Permissions and privileges/scores are necessary to perform the projects. Slowness (delays) in the permission acquiring process can affect the project.
Determining the probability and effect of these risks
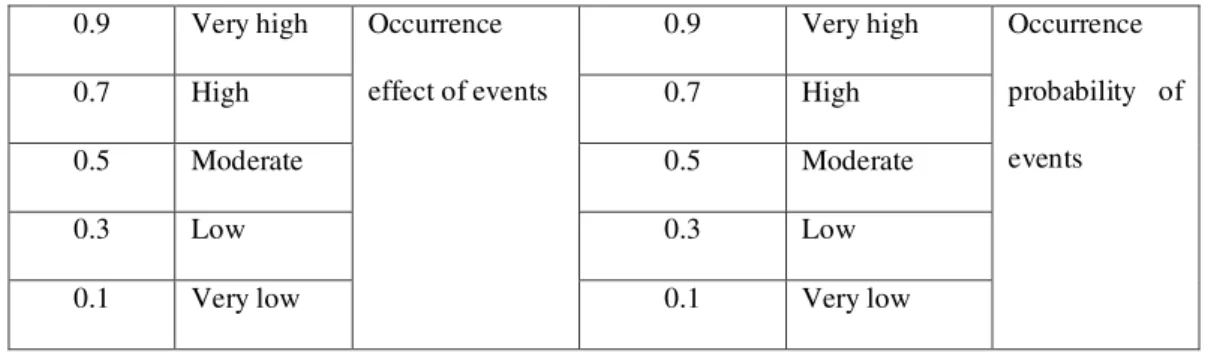
For this purpose, after the identification and classification of circumstances/events, which creates risk, the probability and effect of the circumstance/event occurrence is determined. To achieve this goal the numbers in table (1) are used for comparison.The risk is divided into two components of probability and the probability and effect/impact are determined for risks. This is referred to by the subjective scale of very low, low, medium, high and very high. According to the project cycle thedesign- build contracts are divided into two parts of design and build/construction and implementation.
Table 1: numbers considered to determine effect and probability of events creating risk
0.9 Very high Occurrence
effect of events
0.9 Very high Occurrence
probability of
events
0.7 High 0.7 High
0.5 Moderate 0.5 Moderate
0.3 Low 0.3 Low
Data analysis
Determining the distribution and density functions forrisks
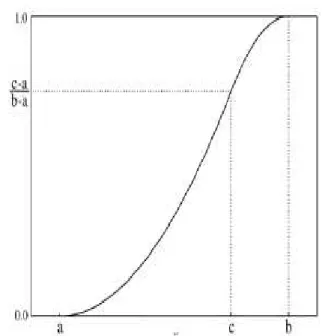
In probability theory, a probability density function or density of a continuous random variable is a function thatsaidthe relative probability for this random variable, which take a certain amount. In other words, the probability distribution function is a function that shows the probability that a random variable X is less than x or equal to x. likewise,the probability density function or PDF isa function that shows the probability that a random variable Xis exactly equal to x. In fact, the probability density function is thederivative of the probability distribution function. Density function represents an approximation of the spotprobability in acontinuous range. There are different functions for consideration of probability distribution. Among themthe uniform distribution, normal distribution, triangular distribution, betadistribution, Poisson distribution, and others can be referred. According to the available data, different functions can be used. In probability theory and statistics the triangular distribution is a continuous probability distribution, which its lower and upper limits are respectivelya andb and has a mode (repetition frequency) c (Figure (1) and Figure (2)). Triangular distribution is usually utilized for subjectivedescription of a population for which there islimited information. It is especially used for cases where the relationship between the variables is known but data are limited (probably due to the high cost of collection). This distribution is expressed based on knowledge of the minimum and maximum and an estimation of the mode amount. For these reasons, the triangular distribution has been called as "Distribution of lack of knowledge". This distribution is used in business simulations and other items. One of its usages is in project management. In this study, since the nature of the risk has three numbers/digits of minimum, maximum and is the most probable mode thetriangular distribution is used.
Figure 1: triangular density function
Figure 2: cumulative probability of triangular distribution
The combination of the density distribution functions:
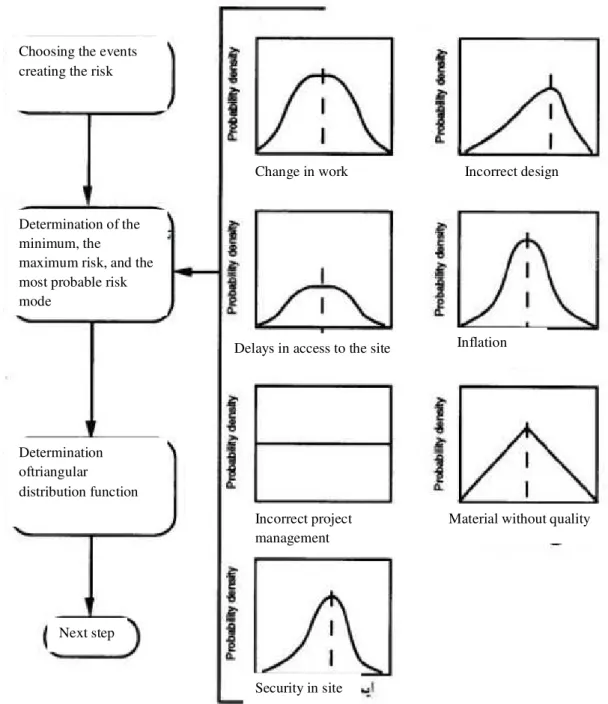
Figure 3:Combination of density functions in Monte Carlo simulation method
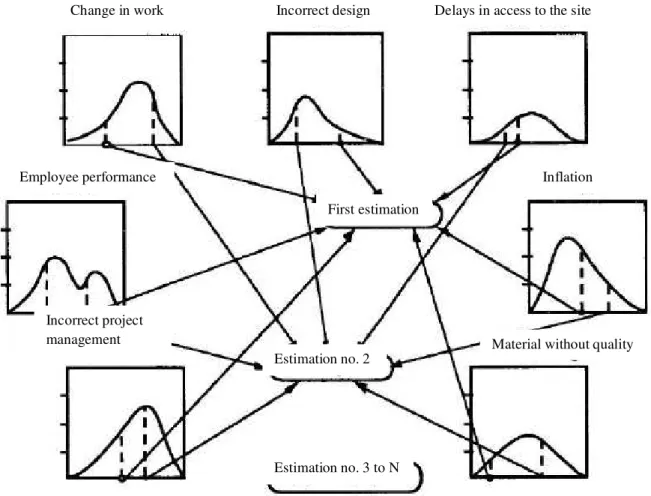
In the next stage, using Monte Carlo simulation, different combination scenarios of thesedensity functions is determined. Monte Carlo simulation method is in such way that a random number between acceptable numbers, which in our case the risk amount that is between 0 and 1, is selected. Then, for this random number the risk amountis obtained from every density function
and these values are collected and a combination of risks is determined. This stage is repeated, another random number is selected and another risk isobtained. This will be done in a sufficient number like 100, 500, etc. (Figure 4). From the pair of resulted numbers a chart is created which determines the probability of different risks.
Choosing the events creating the risk
Determination of the minimum, the
maximum risk, and the most probable risk mode
Incorrect design Change in work
Inflation Delays in access to the site
Material without quality Incorrect project
management Determination
oftriangular distribution function
Figure 4: performing the repetitive step in Monte Carlo method
Information/Data Analysis
Byidentifying the events causing the risk in design- build contracts and by studying the past researches these events were classified. In the next stage, to determine the effectand the probability of these events a questionnaire was designed and distributed between firms/ companies that implement design-build projects.
By averaging the results of the questionnaires the risks were determined. In the final stage, due to the random nature of the risks the Monte Carlo simulation was used to create a diagram of various risk conditions in the design-build projects. The respondents were selected among people who were working in companies that were performing thedesign-build projects, and hada several-year experience of these types of contract. A total of 45
questionnaires were distributed, and about 34 questionnaires have been received.
Some of the questionnaires were not answered correctly, so that finally, with 30 questionnaires analysis was done.
To determine the probability and effect of events causing the risk in the questionnaire the responders were questioned thateach of the following events has what probability in terms of occurrence, in the case of occurrence whateffect they have on the success and failure of projects? The numbers assigned to each eventinclude the minimum probable, the most probable, and the maximum probable.
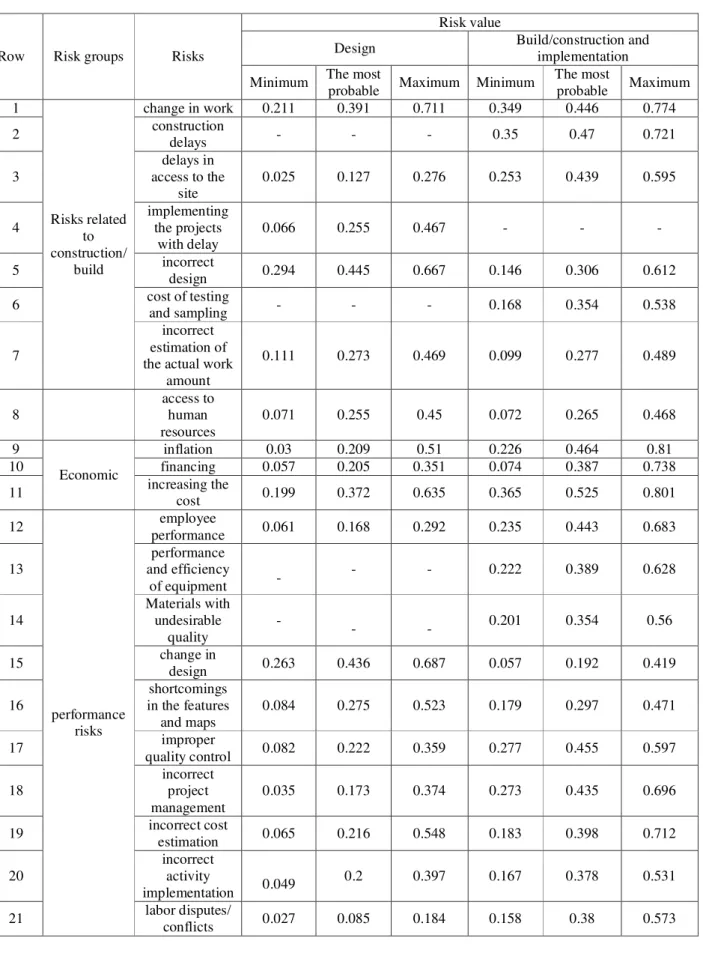
In table 2, the numbers resulted from the total questionnaires are shown.
Change in work Incorrect design Delays in access to the site
Inflation
First estimation
Estimation no. 2
Material without quality
Estimation no. 3 to N Employee performance
Table 2: numbers resulted from all respondents
Row Risk groups Risks
Risk value
Design Build/construction and
implementation
Minimum The most
probable Maximum Minimum
The most
probable Maximum
1
Risks related to construction/
build
change in work 0.211 0.391 0.711 0.349 0.446 0.774
2 construction
delays - - - 0.35 0.47 0.721
3
delays in access to the
site
0.025 0.127 0.276 0.253 0.439 0.595
4
implementing the projects
with delay
0.066 0.255 0.467 - - -
5 incorrect
design 0.294 0.445 0.667 0.146 0.306 0.612
6 cost of testing
and sampling - - - 0.168 0.354 0.538
7
incorrect estimation of the actual work
amount
0.111 0.273 0.469 0.099 0.277 0.489
8
access to human resources
0.071 0.255 0.45 0.072 0.265 0.468
9
Economic
inflation 0.03 0.209 0.51 0.226 0.464 0.81
10 financing 0.057 0.205 0.351 0.074 0.387 0.738
11 increasing the
cost 0.199 0.372 0.635 0.365 0.525 0.801
12
performance risks
employee
performance 0.061 0.168 0.292 0.235 0.443 0.683
13
performance and efficiency
of equipment -
- - 0.222 0.389 0.628
14
Materials with undesirable
quality
-
- - 0.201 0.354 0.56
15 change in
design 0.263 0.436 0.687 0.057 0.192 0.419
16
shortcomings in the features and maps
0.084 0.275 0.523 0.179 0.297 0.471
17 improper
quality control 0.082 0.222 0.359 0.277 0.455 0.597
18
incorrect project management
0.035 0.173 0.374 0.273 0.435 0.696
19 incorrect cost
estimation 0.065 0.216 0.548 0.183 0.398 0.712
20
incorrect activity
implementation 0.049
0.2 0.397 0.167 0.378 0.531
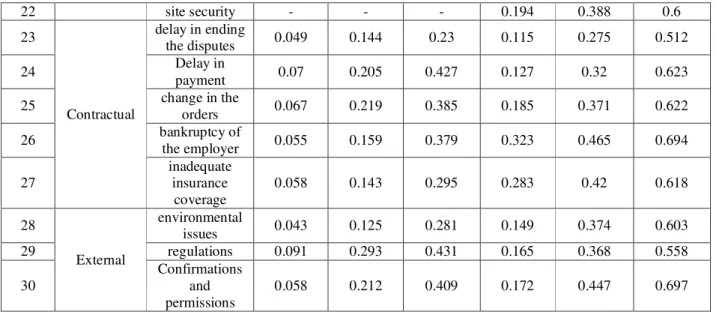
22 site security - - - 0.194 0.388 0.6
23
Contractual
delay in ending
the disputes 0.049 0.144 0.23 0.115 0.275 0.512
24 Delay in
payment 0.07 0.205 0.427 0.127 0.32 0.623
25 change in the
orders 0.067 0.219 0.385 0.185 0.371 0.622
26 bankruptcy of
the employer 0.055 0.159 0.379 0.323 0.465 0.694
27
inadequate insurance
coverage
0.058 0.143 0.295 0.283 0.42 0.618
28
External
environmental
issues 0.043 0.125 0.281 0.149 0.374 0.603
29 regulations 0.091 0.293 0.431 0.165 0.368 0.558
30
Confirmations and permissions
0.058 0.212 0.409 0.172 0.447 0.697
Analysis of the obtained risk density functions
Concerning the risk of "inflation", according to the diagram (2) it can be see that its risk is greater in the construction phase. Besides, in the risk phase it contains more efficiency; however this risk is more concentrated at the design stage.
Diagram 2: density function of inflation risk
Concerning the "Regulations", it can be see that its effect is greater in the construction phase. At the design stage, this risk in the case of occurrence will have a high effect (Figure 3).
Inflation
Design
Build/ construction
Diagram 3: density function of regulation
Analysis of the obtained risk functions
The method is in such way that from each density functions a number is selected randomly, and summed, showing the risk of the project. This (work/stage) is repeated several times.In this
study,this stage was repeated 500 times and the following results were obtained.
Risks pertaining to design phase
By doing a repetition of 500 times the frequency of risks is as diagram(4). It can be seen that the risk of 0.25 is repeated up to 90 times.
Diagram 4: Histogram of the risk in design step
Diagram (5),which is the final result of risk analysis at the design phase, shows the percentage
of risk acceptance in thedesign-build projects and in the design phase. This diagram shows the total
Design
Build/ construction
Risk value Regulations
Histogram of the design risk value
risk changes in a given and limited interval. This diagram shows that in the design-build in the field of design the minimal risk is 22 percent, but the
ultimate risk, which is possible in the design phase, is 33 percent.
Diagram 5: Probability of different risks in design step of the design-build projects
Risks pertaining to construction/build phase
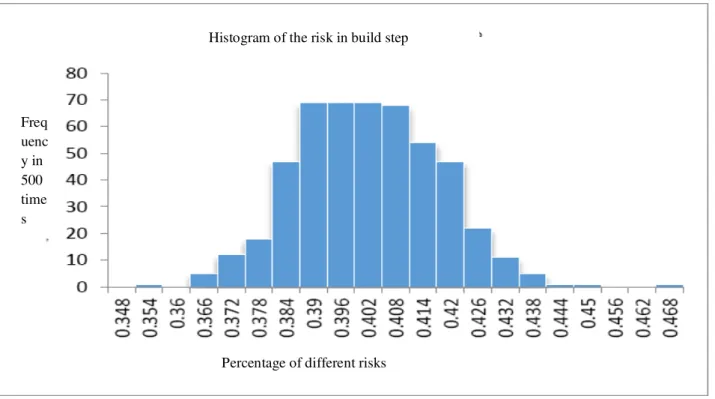
Concerning the construction phase the Monte Carlo simulation has also been done. By doing a repetition of 500 times the frequency of risks is as diagram (6). It can be seen that the risk of 0.38 to 0.41 is repeated up to 270 times.
Diagram 6: Histogram of the risk in build/ construction step Cumulative
probability
Probability value Probability of different risks in design step
Histogram of the risk in build step
Percentage of different risks Freq
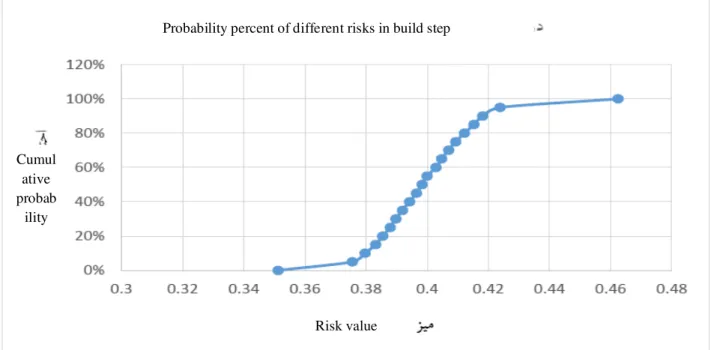
Diagram (7) shows the percent of risk acceptance in the design-build projects and in the construction/build phase, that in the design-build contracts in the construction phase the minimal risk is 35 percent, but the ultimate risk, which is possible in the design phase, is 45 percent.The conclusion that may be concluded from this diagram is that the percentage of the risk change in the usual status of the projects should be considered as 10percent.
Diagram 7: Probability percent of different risks in build/ construction step
REFERENCES
1. Emamjomehzadeh, Mohammad Hamed,
“pamphlet of strategic
management”,Engineering Faculty of Tehran University, 2004- 2005.
2. Parchami Jalal, Majid, a model to choose the most appropriate method of the project implementation, Proceedings of the Conference of the MahabGhods Consulting Engineering Company managers, 2001. 3. ANDI The importance and allocation of risks in
Indonesian construction projects, Construction Management and Economics (January
2006), 24, 69-80.
4. Lorance, R. B. &Wendling, R. V. (2001). Basic techniques for analyzing and presentation of
cost risk analysis. Cost Engineering, 43 (6), 25-31.
5. Michael J. Bresnen, Construction contracting in theory and practice: A case study, Construction Management and Economics, Volume 9, Issue 3, 1991.
6. PMI. (2008). A Guide to the project management body of knowledge (PMBOK Guide) (4 ed.). USA: Project Management Institute Inc.
7. Skorupka, D. (2008). Identification and Initial Risk Assessment of Construction Projects in Poland.ASCE Journal of Management in Engineering, 120- 127.
Probability percent of different risks in build step
Risk value Cumul
ative probab