66
! " # $ " %& '&
Centre for Sustainable Technologies, Indian Institute of Science (IISc), Bangalore, India.
The increasing levels of generation of nutrient rich waste water pose serious challenge. Conventional biological and chemical methods of waste water treatment have failed in meeting sustainability challenges. Naturally occurring mixed algal species reared in mixotrophic growth modes have been deployed to recover nutrients (N and P) from domestic wastewater after anaerobic digestion. In this paper, we present the results pertaining to growth and mixotrophy. Pilot scale operation shows that the cultivation methods adopted and the use of naturally selected species lead to a tendency among these species to clump at certain stages of growth that in turn float or settle rapidly making algal harvest and thereby the nutrient recovery processes energy efficient. The highest settling rate was found to be 6.37 ± 1.6 g/m2/d. Mixotrophy was seen to contribute 15 – 24 % across the various algal consortia in wastewater (polyculture).
(&
(&( ' ) Today nutrient removal and recovery are important aspects for sustainable
waste water processing. In the year 2010 2011, 66 lakh tons of urea and 131.8 lakh tons of other fertilizers were imported amounting to Indian Rs. 1,50,000 crore expenditure. Hence, even if half the nutrients are recovered, it would ease the situation tremendously. Conventionally, waste water treatment systems attempt to absorb and respire decomposable organic carbon removing the ‘polluting’ plant nutrients N and P by mineralization process, volatilisation and recover a part of these as cell biomass, typically in bacterial sludge. Algae on the other hand offer many advantages to be deployed as a treatment option for wastewaters rich in nitrogen and phosphorous. They provide dissolved oxygen (via photosynthesis) to the accompanying bacterial population without input of external energy *(+ ,-& Algae take up ammonia and nitrate *.-, facilitate phosphorous removal and recovery by uptake, adsorption and precipitation */+ 0-. They also contribute to removal of organic carbon by mixotrophic mode of nutrition, in the process often ridding the waste water of toxic and/or recalcitrant organics *1-&
Algae mediated waste water treatment system have been used as oxidation ponds, anaerobic lagoons etc. However, the processes that are currently deployed involve algae mediated treatment and mainly consider the treatment of such waste waters without options to harvest the algal biomass grown. This is often due to the absence of technology options for energy efficient harvesting, dewatering and drying of the algae raised by the system. This property becomes a physical limitation and makes the process of waste water treatment most often uneconomical and also unsustainable due to a variety of reasons.
' 234/ 5 20/1
67
Most of the domestic waste water in India is not treated adequately and flow into local water bodies causing eutrophication and loss of such water resources. Even when it is treated aerobically, the bigger challenge is to treat the large volumes produced every day and also the loss of plant nutrients namely nitrogen and phosphorous. The city of Bangalore alone produces about 800 MLD of waste water with high concentrations of N and P. As a result, aerobic treatment along with nutrient removal comes at an unaffordable cost.
In this research work, an attempt has been made to address this issue and develop strategies for the simultaneous waste water treatment and energy efficient harvesting of algae grown to enable further applications. Such a process is expected to recover the key plant nutrients of N and P from the waste water making the process sustainable.
) When the nitrogen cycle on our planet is considered, it is observed that biological N fixation is the primary source of reactive N (natural cycle) providing about 90 130 Tg N per year on the continents. Lightning is estimated to fix 10 Tg N/yr *4-. Human activities have resulted in the fixation of an additional 150 Tg N per year by energy production, fertilizer production and cultivation of leguminous crops *8-. Human activities that increase the nitrogen being fixed include production of nitrogen fertilizers and cultivation of nitrogen fixing legumes (together account 80 % of nitrogen added) and burning of fossil fuels (20 % *4+8-). The nitrogen being added is not spread evenly across the earth but there is no place on Earth that is unaffected. The effect is more so on the Indian subcontinent and Southeast Asia where crop production is more intense *3-. Though nitrogen is a nontoxic gas, its intermediates (as reactive nitrogen species) present in the atmosphere influences the oxidation capacity, the radiation balance and acidity. The nitrogen fertilizers are currently being used only with a plant uptake efficiency of 30 – 50 % *(2- and as a consequence it leaches into the aquatic systems nearby or are denitrified and lost to atmosphere. The economics are staggering as well, the total fertilise subsidy for the year 2008 2009 was INR Rs. 758,490 million. Production of one kg of urea would utilize 1.2l of gasoline equivalent energy *((-. All these reasons make it very necessary to recycle fixed Nr before it degrades into nitrogen and escapes into the atmosphere and make our existence more sustainable. Similarly, the energy involved in production of phosphorous as of 2003 was 132 million GJ per year the year in which worldwide phosphorous consumption was 31 million tons as P2O5 *(,-.
Phosphorous is mobilized by anthropogenic processes especially food production. Phosphorous mainly remains on land and then moves into the coastlines. Enrichment of water bodies by phosphorous would cause eutrophication which sometimes devastates the ecology of the water body. An excess of phosphorous would impact the environment negatively. Hence its recovery before discharge is very essential before it gets accumulated in a stagnant water body. The current approach to the nutrient problem of waste water is in general to remove N and P from the domestic and industrial waste water streams through a sequential process of nitrification denitrification process and precipitation. However it is now clear that, considering the above mentioned environmental and energy costs expended, N needs to be recovered and reused to remain sustainable.
68
coupled to energy recovery/efficiency is targeted. The greater the growth rates of dispersed micro algae (suspended growth), greater are the effort involved or energy sacrificed in algal harvest.
(&, ' Mixed algal consortia were
chosen as the treatment option based on the following reasons:
a) Aeration: Algae provide aeration by photosynthetically providing O2 to facilitate the
bacterial conversion of organic matter which corresponds to an increased efficiency in COD removal *(.+ ,-.
b) Adaptation to wastewater: As they are occur naturally in waste water their survival would not be a problem as they would have adapted themselves to thrive in these environments over a very long period.
c) Uptake of nitrogen: Algae are known to have mechanisms for the uptake of various forms of nitrogen namely ammonia, nitrate and amino acids and these phenomena are highly variable within the algal community *.-.
d) Uptake and removal of phosphorous: Algae are known to flourish in P rich waters as it is one of the main nutrients for its growth *0-. Alga also aids in the removal of phosphorous from waste waters by adsorbtion and precipitation as growth of algae generally leads to an increase in pH */-.
e) Uptake of carbon: Quite often modes of nutrition such as mixotrophy also aid in removal of organic carbon from the waste water and function simultaneously with bacterial degradation. Among algae, it is a process that can occur at night and therefore it results in the continuous removal of organic matter leading to a faster recovery of nutrients.
f) Ability to take up and degrade toxic organic compounds: Lin et al, *1- showed that the growth of some adapted algal species in the municipal solid waste leachate lead to the decrease in the toxicity of these waste waters.
g) Ability to form clumps that either float or settle: Most of the earlier treatment methods of waste waters have not been implementable at large scale as the energy required for harvesting of algae is prohibitive. In most cases the energetics of algal harvest decides the economy and sustainability of the overall process. Naturally clumping algae have not been studied in detail and hence their widespread implementation in waste waters is an alternative to improve energetics of algae recovery. The property of natural settling could make true gravity settling a possibility (sans coagulants).
There are several factors that affect an algal waste water treatment system’s performance like photosynthetic efficiency at different irradiance, photo inhibition, differences in adaptability and stability of culture, efficiency of uptake of nitrogen and factors affecting N uptake, rates of nitrification and de nitrification, rate of sedimentation of clumps, physical parameters of system like depth, density and retention time of system, mode of carbon assimilation like extent of mixotrophy, rate of grazer growth and heterotrophy and efficiency of clump formation.
In this work, we are trying to assess suitability of cultures in terms of adaptability and clump formation of mixed cultures in waste water and the contribution of mixotrophy in such systems. Some factors that are related to the growth of algal cultures are discussed below:
(&.& ! 7 Light saturation for planktonic algae is said to occur at light intensities of more than 15 to 20 K lux *(/-. Eukaryotic algae are reported to have half saturation constant of 12 60 FM *(0-. However most of the work done regarding compensation point in algae measures the same between pH 4 and 5 as CO2 equilibration between gas and liquid phase happens at this pH
69
reaching pH 9 at noon. Measuring concentration of inorganic C in water at this alkaline pH by using Infrared gas analyser is very difficult as gas concentrations of inorganic C at this pH is very low. Gas chromatography using FID can be used for this purpose (Birmingham and Colman, 1979 *(1-).
(&/& # There are two approaches to growing algae, mono cultures and
mixed cultures (also referred to as poly cultures). The strategy chosen depends on the media, end product in question, its market value and the relative ease of cultivation and economics of synthesis. However, for waste water treatment mixed species is most suitable as it would provide a robust system for handling the waste water through all seasons with species that have already adapted to the specific waste water conditions.
(&0& # 5 In a typical wastewater system, the
algae is adapted to uptake organic carbon along with inorganic forms of C. Such a mode of nutrition is known as mixotrophy where respiration and photosynthesis occur simultaneously *(4+ (8- where the species in question exhibits mixotrophic behaviour during the day and heterotrophic behaviour during night and as such continue to synthesize throughout the day.
The common modes of photoautotrophy and mixotrophy have been studied in detail. Though autotrophy is understood well in algae, it is only recently that the mechanism of carbon capture was sufficiently understood. It is widely believed that most algae and cyanobacteria have carbon concentrating mechanisms when growing in their natural habitats *(0+ (3-. There are many methods of carbon concentration observed in algae – carbon assimilating mechanisms (CAM), C4, active transport of H+ producing an acid compartment supplied with HCO3 which generates a high CO2
equilibrium concentration, active transport of HCO3, CO2 across membranes called as carbon
concentrating mechanisms (CCM) *,2-. There are reports of algae increasing the photosynthetic efficiency not just by CCM’s but also by altering the kinetic properties of RUBISCO. They show that RUBISCO enzymes from algae have developed a higher affinity for CO2in cases where the alga
has adopted a strategy for CO2 fixing that does not utilize a CCM.
(&1& 9 There are a few recent studies that have worked
on the role of mixotrophy in wastewater *,(7,0- have looked at whether the algae isolated from the wastewaters are indeed better at mixotrophic mode of nutrition. They report ten times more biomass in mixotrophy compared to autotrophy. However, this estimation of autotrophy is done in BG 11 media.
,& # #
,&( Many algal consortia were isolated from
various locations in Karnataka (Table A in supplementing material). Such algae were maintained in minimal salt media in 500 ml plastic bottles as per standard methods.
,&, : In order to obtain a domestic wastewater of consistent composition, it
70
Table 1: Composition of the two synthetic wastewater media Synthetic wastewater composition
Compound WW1 conc mg/l WW2 conc mg/l
Arrowroot powder 500
Urea 92 92
KH2PO4 66 66
MgSO4.7H20 80 80
NaCl 86 86
Na2CO3 109 109
,&.& ! : The procedure involved screening for adaptability to
wastewaterand clumping. The algal consortia existing as clumps during isolation were inoculated in WW1 and WW2 on a wet weight basis at (measured at 100% humidity) 1g, 2g and 3g. For the consortia that existed in suspension, the inoculation was done at the concentrations of 104, 0.5× (105) and 1.5×10⁵ cells/ml. After a growth phase of 7 days, the consortia which were capable of forming clumps that either settle and/or float in a particular wastewater were selected.
,&/ :
,&/&(& : ; The two wastewaters prepared were poured into 0.1 m2 transparent
plastic reactors with 15 cm depth and 10 cm of the working depth (Figure 1). Each reactor had a working volume of 10 litres of the synthetic wastewater, WW1 and WW2 respectively. Four mixed consortia selected from the screening process were tested for their biomass productivity in these wastewaters. The four different mixed consortia of algae were inoculated in each. Control maintained was the synthetic wastewater with organic carbon as well as that without the algal inoculation kept away from the inoculated tubs to avoid cross contamination. Two replicates were maintained for each. (Inoculum volume was such that the initial concentration of the total number of cells in the reactor was 1.5×10⁵ cells/ml). The batch mode cultivation was taken up from 23rd to 29th December 2011.
,&/&, : Reactors which were treating WW1 in batch mode was then
set for operation in a continuous mode for 3 weeks for the 3 mixed species that were found to have significant advantage.The hydraulic retention time in the continuous mode was maintained based on the time required to achieve the maximum number of cells in suspension in the tubs. Hydraulic retention time was maintained by controlling the flow rate (HRT = Volume/Flow rate). This was determinedby monitoring the cell count of cells in suspension. The continuous mode was adopted till 28th January 2012.
35 cm
Figure 1: Dimensions of the continuous reactor 10 cm 35 cm
15 cm
71
,&/&. The number of sunlight hour’s data was obtained from the Department of Meterology at University of Agricultural Sciences, Bangalore and the intensity data was calculated from the total sunshine hours data obtained using the Angstrom Prescott equation: , where Q is the daily global radiation observed at a site, Q0 the daily extra terrestrial radiation (the radiation
received by a horizontal plane at the top of the atmosphere), n the recorded sunshine duration (in hours), N the, day length (in hours), aand b are empirical coefficients, estimated through a regression procedure where a=0.25 and b=0.5. The monthly average values for extraterrestrial radiation in the northern hemisphere latitudes were considered for the calculation of intensity in these months for the respective year *,1-.
,&0 ) : Three techniques were employed to quantify the biomass
produced to ensure understanding of different processes occurring in the system.
,&0&(& The growing cells existed mainly in 2 zones i.e. in suspension
and settled matter. The cell count from suspension was carried out to analyse the dynamics of number of cells in suspension and the period after which the cells settle.It was also carried out to assess the growth and settling pattern of individual species in media with and without added organic carbon, a surrogate to domestic wastewater to predict autotrophic and mixotrophic growth patterns. The cells were counted once dailyusing a haemo cytometer approach. Two samples (5 mL each) from each replicate reactor were counted. From the above two samples, a volume of 0.05 ml was spread on slides for counting. These were sampled at 11:00 am to coincide with the high algal dispersion. Loss in total volume due to evaporation, although small, was compensated while correcting for daily evaporation losses.
,&0&,& : This method was aimed to obtain an estimate of total biomass (cells
in suspension and cells that have settled) in the reactor on a continuous basis. This method could be carried out on a reactor running in continuous mode non destructively without removing a large number of cells. A known volume of thoroughly stirred culture was centrifuged (4000 rpm) for 20 min and the pellet was treated with methanol and kept in water bath for 30 min at 60ºC. Absorbance of the pooled extracts was measured at 652 and 665 nm and chlorophyll (a + b) was estimated using Lichtenthaler equations *,4-.Also a known amount of wet biomass of each mixed consortia was tested for chlorophyll to determine the percentage of chlorophyll in the biomass.
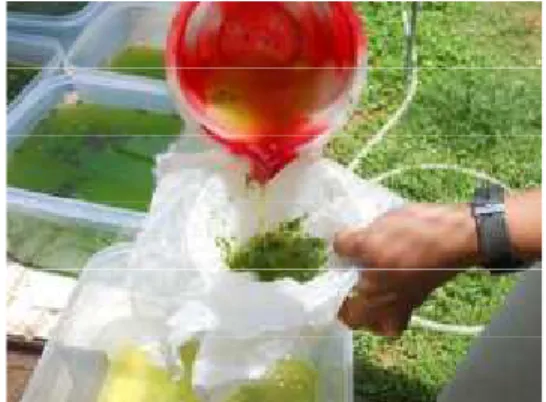
,&0&.& < This parameter was expected to give the value of harvestable dry weight by a low energy harvesting system namely by filtering out the floating clumps. At the end of the growth period in batch mode, biomass was harvested using a 50F nylon mesh (Figure 2) and dried on an aluminium foil (Figure 3) at 90ºC till it reached a constant weight. When the reactor was operated on a continuous basis, the biomass was harvested in the same manner as above every 4 days.
72
Figure 3: The harvested biomass smeared on aluminium foil to be dried and after drying
.&
.&(& As mentioned in section 2.3, after a
preliminary pilot scale screening for growth and clumping, the following four mixed consortia (MC1 MC4) were chosen for the study on the domestic wastewaters because they gave the high productivity and showed clumping in the pilot studies&The four mixed consortia are represented as columns and the constituent algal species are represented as rows in Table 2.
Table 2: The constituent species of the four mixed consortia tested for studies on domestic wastewater.
Mixed consortia 1 (MC1)
Mixed consortia 2 (MC2)
Mixed consortia 3 (MC3)
Mixed consortia 4 (MC4) Species 1
(sp1) '( ( ( ) *
Species 2 (sp2)
'( (' (
'( (' (
'(
(' ( '(
Species 3
(sp3) % + , + , - .
Species 4
(sp4) / / /
Others (ot)
'( 0( ( 0( (
1 (
('
( 2 ( 2 /
Figure 4.1.1 and 4.1.2: '( ) * in autotrophic culture –MC1 (100x).
73
Figure 4.2.1 '( (' ( and '( ( ( 3 ! ' , *
Figure 4.2.2: Other species of '( in MC1
Figure 4.3.14 '( , + , and C in MC2
Figure 4.3.2: (' in MC2
= /&/&( = /&/&,
= = /&,&,
74
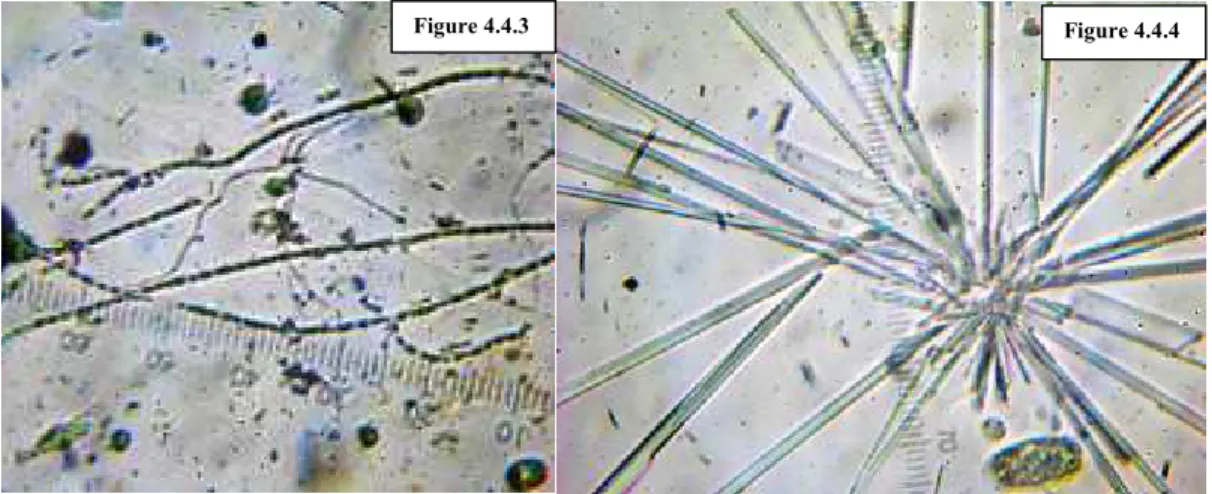
Figures4.4.1 and 4.4.2: ) * 3 5 (45x); Figure 4.4.3: + , found in MC 3 (45x) Figure 4.4.4: One of the sporadic algal species which appeared only on 1 day in large numbers MC
3 (45x, to be identified)
Figure 4.54 - . in mixed consortia 4 (45x)
.&,& ; ) :
.&,&(& Figure 4.1.1 to 4.5 depict the species that occurred while the growth patterns of these mixed consortia in WW1(mixotrophic) and WW2 (autotrophic) are presented in Figure 5.1.1 to 5.4.2. This study captures the extent of mixotrophy (depicted by solid lines) in WW1 and autotrophy (dashed lines) in WW2 by monitoring the growth patterns.It should however, be noted that the cell count here represents the extent of cells in suspension and is as such not completely indicative of the total number of cells in the system. The number of cells in suspension was taken as a parameter where its rapid decrease was indicative of significant settling. It was found by observation that this decrease in cell numbers coincided with the phenomenon of settling. This process predominantly selected and amplified the natural algal phenomena of flocculation by floating to surface in the late afternoon and settling to the bottom at late evening due to vacuolar buoyancy management in the chosen consortia*,8-.It was concluded that the rapid decreases in cell count was mostly attributable to the cell settling processes.The number of days taken to achieve maximum observed settling was therefore taken to be the ideal hydraulic retention time (HRT) and in continuous operation, mean cell residence time (MCRT).Table 3 is the key used to represent growth with and without organic carbon is as follows
75
Table 3: Key for differentiating species in their respective consortia in WW1 and WW2 (To be read along with Table 2)
sp1+ species 1 in WW1 sp1 species 1 in WW2
sp2+ species2 in WW1 sp2 species2 in WW2
sp3+ species 3 in WW1 sp3 species 3 in WW2
sp4+ species 4 in WW1 sp4 species 4 in WW2
Others+ other species in WW1 Others other species in WW2 Total+ Total of all species in WW1 Total Total of all species in WW2
Figure 5.1.1 and 5.1.2: Growth rates of species in mixed consortia 1
76
Figure 5.3.1, 4.8.2 and 4.8.3: Growth rates of species in mixed consortia 3
!"#$$%&$
77
It may be observed that the same species in different consortia reach their peak cell number on different
days in the batch culture. Eg: species 2 which is '( (' ( in MC1, MC2 and MC3
reaches its peak cell concentration on days 6, 3 and 7, respectively. Hence, the composition of the consortia appears to be important in deciding the growth rate and peak cell density for the individual species that the consortia comprise of. Thereforeas the sum of the growth rates of individual species in pure culture is unlikely to be the total growth rate of consortia (Table C in supplemental material), the growth rate analysis of individual species in a consortium becomes very necessary if the aim is to harvest a high fraction of a particular species within the consortia due to a specific advantage that it may offer (eg: high lipid content or a commercially sought after pigment). There is also a challenge to get various individual cells to clump based on the requirement of harvesting with low energy inputs (discussed later in the section on clumping).
.&,&,& Thealgal sampling was done after thorough stirringand hence the reported total biomass yield in batch is the sum of both algae in suspension as well as that which has settled. Chlorophyll is known to vary between 1 2% of the total dry biomass *,3-.Results shown above also conform to this understanding.
The chlorophyll concentration in mixotrophic reactors in all the selected consortia was higher compared to reactors raised in autotrophy until 7 days. The chlorophyll content subsequently reached a plateau and remained largely constant till 11 days (Figure 6). Subsequently, the chlorophyll content began to fall gradually. Not enough data was collected to determine the cause although there was visible increase in grazer population and it could only be one of the causes of fall in volumetric chlorophyll content as also itcould be that the chlorophyll was not replenished. This sediment upon microscopic examination after 15 day did not exhibit intact cell walls and suggested death and decay of algal species in the preceding period and accounting for the falling rate of total chlorophyll.
On the other hand, the autotrophic cultures reached the same peak chlorophyll concentrations as that of mixotrophic a week later, i.e. by 15 days. Though the cell number in WW2 (autotrophy)was higher when compared to WW1 (mixotrophy) in suspension in some cases, it did not translate into higher biomass as the chlorophyll and dry weight harvested clearly confirm that the biomass formed in the WW2(autotrophic) system is less than that of WW1 (Table 4.4 and Figure 6 ). The reasons could be their smaller size and the low mass of each cell *.2+ .(-
Key:
MC1+ MC2+ MC3+ MC1 MC2 MC3
Mixed consortia 1 in WW1
Mixed consortia 2 in WW1 Mixed consortia 3 in WW1 Mixed consortia 1 in WW2 Mixed consortia 2 in WW2 Mixed consortia 3 in
WW2
!"#$$%&$
78
Figure 6: Chlorophyll concentration in batch reactors containing with and without added organic carbon (mixotrophy and autotrophy)
Figure 7: Chlorophyll content in continuous reactors with organic carbon
.&,&.& < > ? While the chlorophyll content and cell count were recorded
on a daily basis as a surrogate for biomass yields on a daily basis, the dry weights of harvested biomass were recorded at the end of a specified growth period (batch studies). The dry weight of the algal biomass harvested after a 7 day growth in batch mode and the algal biomass in the effluent (effluent is the resulting filtrate after 50 F filtration) are reported in Table 4.
!"#$$%&$
79
the chlorophyll content in biomass from WW1 and WW2 are indicative of mixotrophic conditions in WW1. If we ascribe the additional biomass produced by mixotrophically grown algal biomass compared to the biomass produced by autotrophy to the uptake of organic carbon from the effluent then we can estimate the percentage contribution of autotrophy and mixotrophy to the final biomass (Table 4). This method estimates the contribution of autotrophy to be between 76 82% and mixotrophy to contribute 15 24% for the various consortia in wastewater. The values obtained in this study follow the same trend as presented by Yang et al, 2000 who havereported that light energy contributes 63.1% and the organic carbon contributes 36.9% towards glucose production under mixotrophic conditions. The variation of the values obtained in the current study compared to the work done by Yang et al, 2000 *.,- couldbe because of their usage of glucose at a concentration of 5000 mg/l. The organic carbon in our study however was more complex as it was from wastewater. The percentage of harvestable dry weight with respect to the total biomass is also presented in Figure10.
Figure 8: Operation of reactor in continuous mode using clumping or settling type of algal consortia.
Table 4: Sedimentation rate in continuous operation and biomass in effluent
Continuous
Avg biomass settling rate (dry)g/m2/d
Avg biomass in effluent mg/l
MC1 4.79± 1.1 31.3± 8.69
MC2 5.74± 1.8 85.71± 6.64
MC3 6.37± 1.6 30.29± 7.28
*Standard deviation values computed from 5 harvests , 2 replicates each
Table 5: Nitrogen in harvested biomass
%N in biomass
MC1 0.04
MC2 0.035
MC3 0.033
.&.& : Most of the species recorded and presented in Figure 4.6 to 4.9 show
10 20% higher growth in the presence of added organic matter (mixotrophy). Only two species showed a higher growth rate in the wastewater without organic carbon (WW2) as in the case of species 1 of
mixed consortia 1(Figure 5.1.1, '( ( ( andFig 4.9, - . ). This phenomenon of
'( ( ( producing higher cell numbers under autotrophy when compared to mixotrophy has
FILTRATION
Harvestable Algae Filtrate
% not harvestable
!"#$$%&$
80
been reported earlier *..- and is the possible cause for such an observation. These increased growth rates in the presence of organic matter suggest the prevalence of mixotrophy among the most species of the consortia with only few exceptions. From a wastewater treatment point of view, such an occurrence of mixotrophy enables faster removal of organic carbon from wastewater and therefore effecting rapid wastewater treatment as well. It also aids the bacterial degradation of organic carbon as the algae function as aerators.
When cell sizes of species grown independently in WW1 and WW2 was observed, it was seen that the cell size of the mixotrophically grown cells were larger than that of autotrophically grown cells (Figure
4.1, 4.2). The cell size of '( in WW1 (mixotrophic) system was found to be 8.2Fm (dia) ×
8.2Fm (h). In autotrophically grown cells two typical cells sizes were found. Of these the smaller autotrophic cells totalling about 60% measured of the measured cells were 2 X 1.4 and 40% were 4.1 X 4.1Fm in size (diameter× height). Among ) * , mixotrophic cells were 5.7Fm×4.1Fm (elliptical, long × short diameter) whereas in autotrophy most of the ) * , cells had a dimension of 4.1Fm ×1.6Fm (elliptical, long X short diameter).
The occurrence of larger cell size under conditions of high nutrients especially when consuming organic carbon has been reported earlier *.2+.(+ ./- further proved that cultures having bigger cell size leads to a higher yield of dry biomass. Though this was true in the case of the first three mixed consortia, mixed consortia 4 behaved differently. A few species such as - . are known to have higher growth rate in mixotrophy *.0- but the - . found in mixed consortia studied here showed better growth rate in autotrophy and could not be explained with the collected data. Capability and advantage of mixotrophy varies even within taxon; this phenomena might explain the observed differences from that in literature. It is also possible that - exhibitshigher growth rates on simple carbon substrates like glucose and not complex starch as is found in their study *.0-. The impact of other algal species in the consortia in changing the known mixotrophic behavior of - . was not determined and could offer an explanation to the observed mode above. As the yield was low in mixotrophic conditions, mixed consortia 4 (MC4) was not used in the subsequent studies on growth in synthetic waste water.
Table 6 shows the variation in chlorophyll content expressed as a percentage of the total dry biomass. The chlorophyll content was higher in the biomass obtained from autotrophy (WW2) compared to biomass from mixotrophy (WW1). This firstly establishesthe occurrence of mixotrophic conditions prevailing in these algae trials while using organic carbon laden waste water.
Table 6: Chlorophyllas a fraction of biomass harvested.
Chlorophyll % of biomass from WW1
Chlorophyll % of biomass from WW2
MC1 1.32 1.61
MC2 1.4 1.65
!"#$$%&$
81
Table 7: Biomass yield in autotrophic and mixotrophic domestic wastewater
Batch Culture results of 7 days Avg total Biomass yield in WW2 (Autotrophic growth) g/m2 Avg Total biomass yield in WW1 (Mixotrophic growth) g/m2 (WW1 WW2) Difference g/m2 % biomass from autotrophy in WW1
% org C responsible for biomass in WW1 Harvestable biomass in WW1 g/m2
MC 1 16.15± 0.21 19.6 ± 3.4 3.45 82.39 17.6 11.5±0.7
MC 2 31.75 ± 3.8 37.35± 5.16 5.6 85 14.99 28.8±1.6
MC 3 41.5 ± 4.9 54.5± 3.4 13 76.07 23.92 33±5.6
MC 4 12.5 ± .7 7.4±1.1 5.1 Na Na 5.2±0.42
From the analysis of all the parameters of growth it is clear that monitoring cell count is essential for designing the wastewater treatment plant in terms of
a) Retention time
b) Prediction of onset of settling
Chlorophyll is useful in monitoring the system under continuous mode of operation while the harvested dry weight gives us the realistic value of harvestable biomass.
.&/& ! It may be seen from the results of the observed cell count reported under
section 3.2.1 (batch production) that there is a drop of cell concentration after day 6 for mixed consortia 1, 2 and 4, whereas for set 3 it was from day 7. This can be clearly attributed to the rapid phenomena of clumping of cells to form a biomass that either settles or floats and the rate of fall of concentration of cells cannot be attributed to any sudden activity of grazers and the magnitude of change is most likely to be caused by clumping of algal cells and their exiting from suspended form (from cell count). Figure 9.1 to 9.4 are photomicrographs of the particles that have settled. This is an indication of extra cellular polysaccharide (EPS).The formation of such flocs was observed from day 5 in mixed consortia 2 and 3. As the formation of flocs and the settling behaviour occur at an interval of a day, settling could be attributed to the formation of these flocs. The algal biomass then needs to be harvested as soon as settling and/or floating is observed. When left unharvested the grazers were observed to devour algal biomass.
!"#$$%&$
82
Amongst the mixed consortia, a particular species could be more desired than the others. In such cases, the retention time could be adjusted in such a way that a higherfraction of the desired species settles. Here, it is necessary to induce the consortium members to form EPS in sufficient quantities so that the phenomena of clumping is initiated rapidly. It is reported that one of the triggers to the occurrence of clumping is the presence of grazers in sufficient numbers. Clumping is believed to be a defence mechanism by algae to protect themselves from grazers *.1-. Grazers are also reported to be inhibited at higher concentrations ofammonia, and hence flourish when the ammonia concentration decreases further (Oswald, 1988). In this study this trend of clumping occurring has almost always coincided with a low ammonium concentration (<3mg/L to undetectable levels).Therefore with a little modification in design by bringing the ammonia concentration to ≥3 mg/l up to the time the desired algae needs to be harvested, clumping could probably be triggered. This phenomenon needs to be investigated in depth in order to be engineered as per need. However care is needed to ensure that the algae needs to be harvested immediately after clumping or else a large portion of the algal biomass could be lost due to grazer consumption or decay.
Thus for large scale wastewater treatment it will be desirable that cell concentration as well as harvestable biomass reach an acceptable level (among the consortia chosen) before clumping and threshold grazer populations are reached. From Figure 10 it is seen that between 80 94% of the algal biomass is harvested by clump formation (on dry weight basis; 75 80% on cell count basis). It therefore appears this phenomenon of clumping and settling followed by harvest leads to a reduction in algal biomass in suspension. In continuous culture, the cells that are settling would be harvested and the cells remaining in suspension would act as cells in the growth stage to maintain the continuous nature of the reactor.
Figure 9.1: Floc formation in MC1(45x) Figure 9.2: Floc formation in MC 2 (45x)
Figure 9.3: Formation of flocs in MC 3(45x); Figure 9.4: Formation of flocs in MC3 (45x)
Figure 9.1 Figure 9.2
!"#$$%&$
83
! " # $ % %&
'( '( '(
!
Figure 10: Percentage of harvestable biomass in the reactor with mixed consortia
Figure 11: Settled particles highlighted in the reactor
Figure 12: View of settled particles after siphoning the reactor liquid Figure 13: Microscopic image of the settled particle at 5x
Figure 14: Method of harvesting
Earlier studies in pure culture and equal day:night photoperiods suggested loss of weight in photosynthetically derived biomass due to respiration by cultures at night *.4+ .8-). Several strategies and attempts have been made to reduce this by providing artificial light to the cultures during night (from an energy perspective, use of artificial lighting for increased biomass yields would be inefficient
*.3+ /2-). Significant loss in weight of biomass at night was not expected to occur as the cultures were
Figure 11 Figure 12
!"#$$%&$
84
soon established to be mixotrophic */(+ /,-). The extent of loss of weight by respiration etc however needs to be quantified and the efficiency advantage of mixotrophy confirmed by further work.
[1] Humenik, F. J. “Respiratory Relationships of a Symbiotic Algal Bacterial Culture for Wastewater Nutrient Removal.” Biotechnology and Bioengineering.12 (1970) 541 560.
[2] Escher, A. and Characklis, W. G. “Algal Bacterial Interactions in Aggregates.” Biotechnology and Bioengineering. 24 (1982) 2283 2290.
[3] Dortch, Q. “The Interaction between Ammonium And Nitrate Uptake In Phytoplankton.” Marine
Ecology Progress Series. 61 (1990) 183 201.
[4] Fitzgerald, G. P. and Rohlich, G. A “An Evaluation of Stabilization Pond Literature,” Sewage and Industrial Waste. 30 (1958) 1213 1224
[5] Powell, N., Shilton, A. N., Pratt, S. and Chisti, Y. “Factors Influencing Luxury Uptake of Phosphorous by Microalgae in Waste Stabilization Ponds.” Environmental Science and Technology. 42/16 (2008) 5958 5962.
[6) Lin, L., Chan, G. Y. S., Jiang, B. L. and Lan, C.Y. “Use of Ammoniacal Nitrogen Tolerant Microalgae in Landfill Leachate Treatment.” Waste Management. 27 (2007) 1376 1382.
[7] Galloway J. N., Schlesinger W. H., Levy H, Michaels A, Schnoo J. L. “Nitrogen fixation: Anthropogenic enhancement environmental response,” Global Biogeochemical Cycles. 9/2 (1995) 235 252.
[8] Galloway J. N. “The global nitrogen cycle: changes and consequences,” Environmental Pollution. 102 (1998) 15 24.
[9] Galloway J. N., Townsend A. R., Erisman J. W., Bekunda M, Cai Z, Freney J. R., Martinelli L. A., Seitzinger S. P. and Sutton M. A.”Transformation of the Nitrogen Cycle: Recent Trends, Questions, and Potential Solutions”. Science. 320 (2008). 889 892.
[10] Smil V. ‘Nitrogen in crop production.” Biogeochemical Cycles.13.(1999) 647 662.
[11] Herdt, R .W. and Stangel, P. J. Population, “Rice Production and Fertilizer Outlook.” In Ponnamperuma ED, Editor, Organic Matter And Rice. Manila (Phillipines). International Rice Research Institute. . (1984) 1 34.
[12] Jenssen, T. K. and G. Kongshaug (2003). “Energy Consumption and Greenhouse Gas Emissions
in fertiliser production.” Proceedings No. 509. International fertiliser society, York, U.K. (2003) 1 28.
[13] Humenik, F. J. “Respiratory Relationships of a Symbiotic Algal Bacterial Culture for Wastewater Nutrient Removal.” Biotechnology and Bioengineering.12 (1970) 541 560.
[14] Larcher, W. “Physiological Plant Ecology, Corrected Printing Of The Second Printing.” Springer Verlag, New York, (1983) 303
[15] Badger, M. R., Whitney, S. M., Ludwig, M., Yellowlees, D. C., Leggat, W., and Price, G. D. “The Diversity and Coevolution of Rubisco, Plastids, Pyrenoids, and Chloroplast Based CO2
Concentrating Mechanisms In Algae.” Canadian Journal of Botany. 76 (1998). 1052–1071.
[16] Birmingham, B. C.and Colman, B. “Measurement of Carbon Dioxide Compensation Points of
Freshwater Algae.” Plant Physiology. 64/5, (1979) 892–895.
[17] Kaplan, D., Richmond, A. E., Dubinsky, Z. and Aaronson, S. “Algal Nutrition. In: Richmond, A. (Ed.), Handbook for Microalgal Mass Culture.” CRC Press, Boca Raton, FL., USA. (1986). 147 198.
!"#$$%&$
85
[19] Kaplan, A. and Reinhold, L. “CO2 Concentrating Mechanisms in Photosynthetic
Microorganisms.” Annual Review Plant Physiology and Plant Molecular Biology. 50 (1999) 539–570.
[20] Rai L.C and Gaur J. P. “Algal adaptation to environmental stresses”. ISBN:978 3. (2001) 642 63996 8 (Print)
[21] Garcıa, J. R., Mujeriego and Hern´Andez Marin´E. M “High Rate Algal Pond Operating Strategies for Urban Wastewater Nitrogen Removal”.Journal of Applied Phycology. 12 (2000) 331–339.
[22] Min, Min “Mutual influence of light and CO2 on carbon sequestration via cultivating
mixotrophic alga Auxenochlorella protothecoides UMN280 in an organic carbon rich wastewater.” Journal of Applied Phycology. (2011) 1 7.
[23] Kong, W. B., Song, H., Hua, S. F., Yang, H., Yang, Q. and Xia, C.G. Enhancement of Biomass
and Hydrocarbon Productivities of Botryococcus braunii by Mixotrophic Cultivation and Its Application in Brewery Wastewater Treatment. African Journal of Microbiology Research. 6/7 (2011) 1489 1496. DOI: 10.5897/AJMR11.1349.
[24) Li, Y., Zhou, W., Hu, B., Min, M., Chen, P. and Ruan, R. R. “Effect of Light Intensity on Algal Biomass Accumulation and Biodiesel Production for Mixotrophic Strains Chlorella kessleri and Chlorella protothecoide Cultivated in Highly Concentrated Municipal Wastewater.” Biotechnology and Bioengineering. 109/9 (2012) 2222–2229. DOI: 10.1002/Bit.24491.
[25] Bhatnagar, A., Chinnasamy, S., Singh, M. and Das, K. “Renewable Biomass Production by Mixotrophic Algae in The Presence of Various Carbon Sources and Wastewaters.” Applied Energy. 88, (2011) 3425 3431.
[26] Yang K and Koike T. “A general model to estimate hourly and daily solar radiation for hydrological studies.” Water resources research. 41 (2005) 13.
[27] Lichtenthaler H. K. “Chlorophylls and carotenoids: Pigments of photosynthetic biomembranes.” Methods in Enzymology, 148 (1987) 350 382
[28] Reynolds C. S, Oliver R. L. and Walsby A .E. “Cyanobacterial dominance: The role of buoyancy regulation in dynamic lake environments.” New Zealand journal of marine and freshwater research. 21/ 3 (1987) 379 390.
[29] APHA. “Standard methods for the examination of water and wastewater.” 20th edition, American Public Health Association, Washington DC (1999)..
[30] Martinez, F., Ascaso, C. and Orus, M. I. “Morphometric and stereologic analysis of Chlorella vulgaris under heterotrophic growth conditions. “Annals of Botany. 67 (1991) 239 245.
[31] Schmidt, R. A., Wiebe, M. G. and Eriksen, N. T. “Heterotrophic high cell density fed batch cultures of the phycocyanin producing red alga Galdieria sulphuraria. Biotechnology and Bioengineering. 90/1 (2005) 77 84
[32] Yang C, Hua Q and Shimizu K “Energetics and carbon metabolism during growth of autotrophic
cells under photoautotrophic, mixotrophic and cyclic light/dark heterotrophic conditions.” Biochemical engineering journal 6, (2000) 87 100.
[33] Ogawa, T. and Aiba, S., “Bioenergetic analysis of mixotrophic growth in Chlorella vulgaris and Scenedesmus acutus.” Biotechnology and .Bioengineering. 23 (1981) 1121 1132.
[34] Agusti, S., Duarte C. M. and Kalff, J. “Algal cell size and the maximum density and biomass of phytoplankton.” Limnology and Oceanography. 32/4 (1987) 983 986.
[35] Hellebust, J. A. and Lewin, J. Heterotrophic Nutrition. In Werner, (Ed.) The Biology of Diatoms. University Of California Press, Berkeley, (1977) 169–197.
*.1- Yang Z. and Kong F. “Enhanced growth and esterase activity of Chlorella pyrenoidosa (Chlorophyta) in response to short term direct grazing and grazing associated infochemicals from Daphnia carinata”. Journal of Freshwater Ecology. 26/ 4 (2011) 553.
!"#$$%&$
86
[38] Ogbonna, J.C. and Tanaka, H. “Light Requirement and Photosynthetic Cell Cultivation – Development of Processes for Efficient Light Utilization in Photobioreactors.” Journal of Applied Phycology. 12 (2000) 207–218.
[39] Brennan, L. and Owende, P. “Biofuels from microalgae A review of technologies for production, processing and extractions of biofuels and co products.” Renewable and Sustainable Energy Reviews. 14/2 (2010) 557 577.
[40] Ma, Jian. Techno economic analysis and engineering design consideration of algal biofuel in southern Nevada. Faculty Publications (ME).Paper 8 (2011).
http://digitalscholarship.unlv.edu/me_fac_articles/8.
[41] Chen, F., Zhang, Y. and Guo, S. “Growth and Phycocyanin Formation of Spirulina Platensis in
Photoheterotrophic Culture.” Biotechnology Letters. 18/5 (1996) 603–608
[42] Chojnacka, K. and Noworyta, A. “Evaluation of Spirulina Sp. Growth in Photoautotrophic, Heterotrophic and Mixotrophic Cultures.” Enzyme and Microbial Technology. 34/5 (2004) 461– 465.
*****