________________________________
1 Profa. Doutora, UTFPR/Medianeira, [email protected].
2 Profa. Associada, CCET - Universidade Estadual do Oeste do Paraná (UNIOESTE), Cascavel - PR, [email protected]. 3 Prof. Associado, CCET- Universidade Estadual do Oeste do Paraná (UNIOESTE), Cascavel - PR, [email protected]. 4 Prof. Associado, CCET- Universidade Estadual do Oeste do Paraná (UNIOESTE), Cascavel - PR, [email protected]. 5 Engo Sanitarista, Prof. Doutor, Coordenação de Enga Ambiental, UTFPR-CM, Campo Mourão - PR, [email protected].
WASTEWATER IN A SEQUENTIAL BATCH REACTOR
JULIANA B. R. MEES1, SIMONE D. GOMES2, MÁRCIO A. VILAS BOAS3, BENEDITO M. GOMES4, FERNANDO H. PASSIG5
ABSTRACT: A sequential batch reactor with suspended biomass and useful volume of 5 L was used in the removal of nutrients and organic matter in workbench scale under optimal conditions obtained by central composite rotational design (CCRD), with cycle time (CT) of 16 h (10.15 h, aerobic phase, and 4.35 h, anoxic phase) and carbon: nitrogen ratio (COD/NO2--N+NO3--N) equal
to 6. Complete cycles (20), nitrification followed by denitrification, were evaluated to investigate the kinetic behavior of degradation of organic (COD) and nitrogenated (NH4+-N, NO2--N and NO3-
-N) matter present in the effluent from a bird slaughterhouse and industrial processing facility, as well as to evaluate the stability of the reactor using Shewhart control charts of individual measures. The results indicate means total inorganic nitrogen (NH4+-N+NO2--N+NO3--N) removal of
84.32±1.59% and organic matter (COD) of 53.65±8.48% in the complete process (nitrification-denitrification) with the process under statistical control. The nitrifying activity during the aerobic phase estimated from the determination of the kinetic parameters had mean K1 and K2 values of
0.00381±0.00043 min-1 and 0.00381±0.00043 min-1, respectively. The evaluation of the kinetic behavior of the conversion of nitrogen indicated a possible reduction of CT in the anoxic phase, since removals of NO2--N and NO3--N higher than 90% were obtained with only 1 h of
denitrification.
KEYWORDS: nitrifying activity, kinetic constants, nutrient removal, quality control, processing capacity.
COMPORTAMENTO CINÉTICO DA NITRIFICAÇÃO EM UM REATOR EM BATELADAS SEQUENCIAIS USADO NO PÓS-TRATAMENTO DE EFLUENTE
AVÍCOLA
RESUMO: Um reator em bateladas sequenciais com biomassa em suspensão e volume útil de 5L, aplicado para remoção de nutrientes e matéria orgânica, foi operado em escala de bancada, nas condições ótimas obtidas a partir de um delineamento composto central rotacional (DCCR), tempo de ciclo (TC) de 16 h (10h15 fase aeróbia e 4h35 fase anóxica) e relação carbono:nitrogênio (DQO/N-NO2
-+N-NO3-) de 6. Avaliaram-se 20 ciclos completos, nitrificação seguida de desnitrificação, com o
objetivo de efetuar o estudo do comportamento cinético de degradação da matéria orgânica (DQO) e nitrogenada (N-NH4+, N-NO2- e N-NO3-) presentes no efluente proveniente do abate e industrialização
de aves, bem como avaliar a estabilidade do reator através de gráficos de controle Shewhart para medidas individuais. Os resultados apontaram valores médios de remoção de nitrogênio inorgânico total (N-NH4++N-NO2-+N-NO3-) de 84,32±1,59% (C.V.=1,89%) e de matéria orgânica (DQO) de
53,65±8,48% (CV= 15,81%), no processo completo (nitrificação-desnitrificação), estando o processo sob controle estatístico. A atividade nitrificante estimada, durante a fase aeróbia, pela determinação dos parâmetros cinéticos, apresentou valores médios para K1 e K2, de 0,00381±0,00043 min-1 e
0,00249±0,00056 min-1, respectivamente. A avaliação do comportamento cinético de conversão do nitrogênio indicou possível redução no TC da fase anóxica, uma vez que foram alcançadas remoções de N-NO2- e N-NO3-, superiores a 90%, em apenas uma hora de desnitrificação.
INTRODUCTION
Nitrogen occurs as many compounds due to its various oxidation states, allied to the fact that many changes can be provoked by living organisms. In the environment, nitrogen is found more frequently as ammonia (NH3), ammonium ion (NH4+), nitrate (NO3-), or gaseous nitrogen (N2). The
ammonia-ammonium equilibrium equation is NH4+↔ NH3 + H+. According to WIESMANN et al.
(2007), for acid pH values, the concentration of H+ increases and at pH below 7, ion ammonium predominates. At basic pH, the concentration of H+ decreases and at pH over 11, practically all ammoniacal nitrogen occurs as gaseous ammonia.
Traditionally, the elimination of nitrogen from wastewaters is performed by biological processes involving nitrification followed by denitrification. In nitrification, according to LI & IRVIN (2007), ammonia or ammonium ion is oxidized to nitrite by ammonia oxidizing autotrophic bacteria, during nitritification; next, nitrite is oxidized to nitrate during nitratification. During denitrification, nitrate is converted to gaseous nitrogen, with nitric oxide (NO) and nitrous oxide as possible intermediates (N2O). According to JULIASTUTI et al. (2003), nitrification is the most
sensitive process among the processes of biological removal of nutrients from residual waters. The autotrophic mass is approximately 10-fold more sensitive than the heterotrophic biomass.
The nitrifying process is carried out by two groups of bacteria. The first group belongs mainly to the Nitrosomonas genus, being responsible for nitritation, and the second group, responsible for
nitration, belongs mainly to the Nitrobacter genus (HAMMER & HAMMER, 2007). According to
GRUNDITZ & DALHAMMAR (2001), because the bacteria responsible for nitrification are limited to a few genera with slow cell growth, this process is more susceptible to inhibition.
Biochemically, the nitrification process involves more than the sequential oxidation of NH4+/NH3 to NH4+/NH3 by Nitrosomonas and NO2- to NH4+/NH3 by Nitrobacter. Several
intermediate reactions, enzymes, and coenzymes are involved in the process (GRADY et al., 1999). Furthermore, the responses of the nitrifying bacteria to a series of factors, such as temperature, pH, oxygen concentration, and substrate concentration, must be considered (FONTENOT et al., 2007; SEIXO et al., 2004). This information is important for the design of nitrification systems and to ensure that the nitrifying microorganisms are capable of presenting efficient metabolic activity (FERREIRA, 2000). Knowledge of the kinetics of the nitrification and denitrification reactions is essential for the design of reactors for the removal of nutrients from wastewaters, and so is the choice of the type of process to be used, its particularities, and treatment characteristics.
The kinetic study of reactors, such as sequential batch reactors (SBR) can be done based on the velocity of growth of the microorganisms, the consumption of the substrate, and the formation of products, or by relating all these intrinsically related factors.
To evaluate the stability of the processes, MONTGOMERY (2004) suggests the use of statistical control of quality to identify the problem points that hinder the process, in addition to evaluate the behavior of the variability of the process. The variability can be controlled by means of statistical tools, such as the Shewhart control charts for individual measures (WERKEMA, 1995).
This research aimed to investigate the kinetic behavior of degradation of carbonaceous organic matter and nitrogenated matter present in the wastewater from a bird slaughterhouse and processing industrial facility using an SBR and to evaluate the stability of the reactor using Shewhart control charts for individual measures, and the kinetic profile of nitrification by calculating the apparent kinetic constants K1 and K2.
MATERIAL AND METHODS
Sequential batch reactor and operating conditions
reactor (SBR) was constructed using a polyethylene cylinder. The substrate used was wastewater from a bird slaughterhouse and processing facility and cassava wastewater from a cassava meal company. Initially, the reactor was inoculated with active sludge with a volatile solids suspended (VSS) concentration of 2000 mg.L-1 from another SBR. The system was kept in an acclimatized room at 25 °C (±1 ºC), operating in cycles of loading, reaction (aerobic/anoxic), sedimentation, unloading, rest.
In the aerobic phase, air was supplied by using air stones and a Big-Air pump, model A-420, coupled to a flow meter for control of the air flow, set at 3 L.min-1 for an effluent volume of 5 L. The alkalinity and pH were initially corrected in this phase with sodium bicarbonate at the proportion of 0.61 mg NaHCO3 per mg of oxidized NH4+-N (JANG et al., 2004). A mechanical
agitator running at 25 rpm was used in the anoxic phase.
During the cycles, the concentration of volatile suspended solids dispersed in the liquid mass of the reactor (MLSSV) was kept at 2600.07±6.84 mg L-1. The dispersed MLSSV concentration was fitted with a methodology based on optical density, which was determined with a 700-nm spectrophotometer and with periodical sludge unloading at the end of each batch. A volume of 1.25 L of sludge was left in the reactor as an inoculant for the following stages, after the sedimentation and unloading stages.
Analysis of the stability of the reactor with Shewhart control charts for individual measures The process of biological removal of nutrients from the effluent from a bird processing slaughterhouse was optimized using a star-type (α = 45°) central composite rotational design (CCRD) that comprised a factorial design (22) with levels (-1 and +1), axial points (-√2 and √2), and five repetitions at the central point (0), giving the optimal condition with cycle time (CT) of 16 h and C/N ratio of 6.
Data were collected in 20 16-h cycles of treatment (960 min) using instantaneous loading and CT of 10.15 h (610 min) for the aerobic phase, 4.35 h (260 min) for the anoxic phase, 1 h (60 min) for the sedimentation phase, 0.1 h (6 min) for the unloading phase, and 0.4 h (24 min) for the rest phase. The carbon:nitrogen ratio (COD/NO2--N+NO3--N) was fitted to 6 in the beginning of the
anoxic phase by adding 560 mL of cassava wastewater with a COD of 6581.25±569.66 mL.
The stability of the process was evaluated through the removal of total inorganic nitrogen (NH4+-N+NO2--N+NO3--N) and of organic matter (COD) in the complete process
(nitrification-denitrification). Evaluation was carried out with the Shewhart control charts for individual measures and software MINITAB 15.0 and the mean values and amplitude obtained in the 20 assays that were preformed. The lower control limit (LCL), the upper control limit (UCL), and the mean line (X) were calculated for plotting the graphs with the methodology cited by MONTGOMERY
(2004).
Kinetics of removal of organic matter and nitrogen conversion
During the 16-h assays for the estimation of organic matter consumption and nitrogen conversion in the SBR, samples were collected every hour with an 80-mL syringe. The samples were centrifuged at 5000 rpm for 10 min (FONTENOT et al., 2007) to determine the chemical demand of oxygen (COD) and the forms of nitrogen NH4+-N, NO2--N, and NO3--N. Besides these
parameters, the pH, redox potential, the salinity and the temperature were also monitored.
The procedures described in the Standard Methods (APHA, 1998) were followed for total
Determination of the nitrifying activity
The conversion of ammoniacal nitrogen to nitrite and nitrate was determined by first-order kinetic reaction in series with a single intermediate, according to the model described by LEVENSPIEL (2000)
ammoniacalN
k1
NO2N
k2
NO3 N
, based on the hypothesis that inorganic carbon and oxygen are in excess and nitrogen is the only limiting factor.
The nitrifying activity was estimated by determining the kinetic parameters K1 and K2, based
on the fitting of the kinetic models represented by the equations of consumption of the substrate N-NH4+ (Eq. 2) as a function of the production of the oxidized forms (NO2--N and NO3--N) in the
nitrification stages (Eq. 3) and nitratation (Eq. 4).
k te N ammoniacal N
ammoniacal 1
0 (2)
2 1 1 2 1 0 2 2 1 . k k e k k e k N ammoniacal N NO t k t k (3)
k t k t
e k k k e k k k k N ammoniacal N
NO 1 2
1 2 1 2 1 2 1 0
3 . 1 (4)
RESULTS AND DISCUSSION
Characterization of the effluent treated in the studied SBR
Table 1 presents the results of organic matter consumption evaluated by the COD and the removal of nitrogen evaluated by determination of the forms of nitrogen NH4+-N, NO2--N, and
NO3--N, as well as the mean values obtained for the other monitored parameters during the
experimental procedure, pH, temperature, redox potential, and salinity.
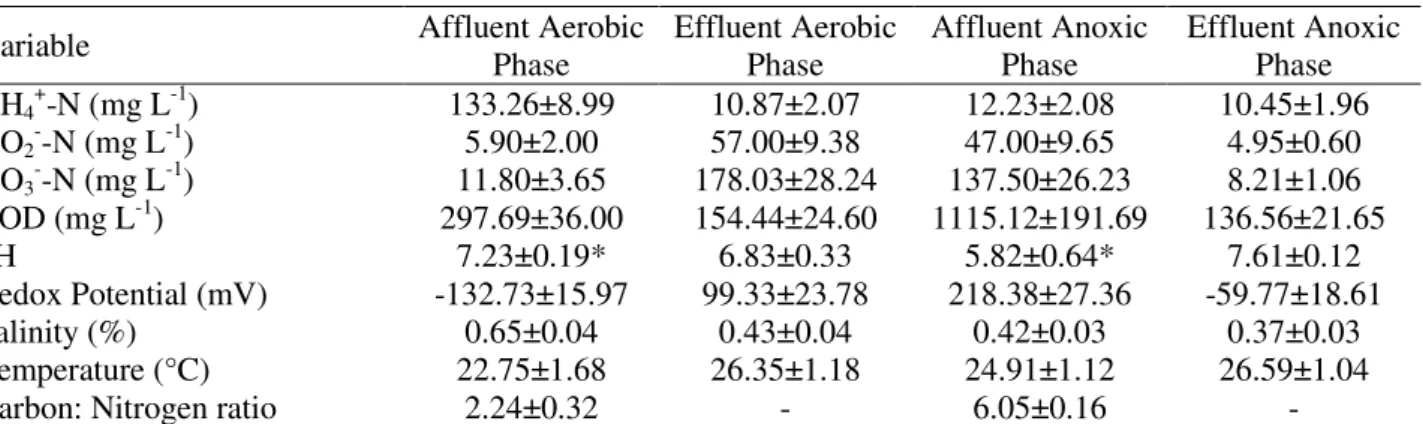
TABLE 1.Mean results obtained for the monitored parameters during the experimental procedure.
Variable Affluent Aerobic Phase Effluent Aerobic Phase Affluent Anoxic Phase Effluent Anoxic Phase NH4+-N (mg L-1) 133.26±8.99 10.87±2.07 12.23±2.08 10.45±1.96 NO2--N (mg L-1) 5.90±2.00 57.00±9.38 47.00±9.65 4.95±0.60 NO3--N (mg L-1) 11.80±3.65 178.03±28.24 137.50±26.23 8.21±1.06 COD (mg L-1) 297.69±36.00 154.44±24.60 1115.12±191.69 136.56±21.65 pH 7.23±0.19* 6.83±0.33 5.82±0.64* 7.61±0.12 Redox Potential (mV) -132.73±15.97 99.33±23.78 218.38±27.36 -59.77±18.61 Salinity (%) 0.65±0.04 0.43±0.04 0.42±0.03 0.37±0.03 Temperature (°C) 22.75±1.68 26.35±1.18 24.91±1.12 26.59±1.04 Carbon: Nitrogen ratio 2.24±0.32 - 6.05±0.16 -
Arithmetical means of 20 16-h cycles ± standard deviation.*Uncorrected pH values, later correction kept pH in the range 7.5-8.0 in the aerobic phase (nitrification) and at approximately 6.5 in the anoxic phase (denitrification).
From the results in Table 1, it can be conclude that the efficiency of removal of NH4+-N
during the nitrification stage varied from 89.51% to 93.71%, with a mean value of removal of 91.85±1.50% for CT of 10.15 h in the aerobic phase.
SEIXO et al. (2004) used an SBR to treat synthetic effluent and obtained a removal value lower than the present value of 69.8% obtained for a Corg/N ratio adjusted to 3; however, the CT, 9 h, was shorter in the aerobic phase.
The C/N ratio (COD/NH4+-N) remained at 2.24±0.32 in the beginning of the nitrification
Likewise, CARVALLO et al. (2002), found removal rates of NH4+-N of 65 and 99% for
different values of COD/NTK ratios between 1 and 8. For COD/NTK ratios lower than 3, they obtained an N-NH4+ removal value of 99.4%.
The effect of the C/N ratio, in which the carbon is the biodegradable fraction of the organic load, is one of the factors that affect the nitrification systems (FERREIRA, 2000). High concentrations of organic matter afford favorable conditions for the development of heterotrophic microorganisms, which compete with the autotrophic nitrifying organisms for oxygen and nutrients (FIGUEROA & SILVERSTEIN, 1992).
ANDRADE et al. (2010) evaluated the factors air flow and concentration of ammoniacal N in the nitrification of the effluent of a fish processing plant using SBR with HRT of 24 h, and concluded through monitoring of nitrogen forms that 16 h was sufficient for nitrification to occur in the best conditions that were evaluated.
The efficiency of removal of NO2--Nand NO3--N in the denitrification stage had mean values
of 88.93±3.09% and 93±3.09%, respectively, for the C/N ratio of 6.05 (±0.16) and a CT of 4.35 h in the anoxic phase.
KUMMER (2008) used cassava wastewater as a carbon source in the denitrification of the effluent of a fish processing facility in an SBR with CT of 24 h. Tests of different COD/NO3
-(0.1;1.0;3.2;5.4 and 6.3) gave mean nitrite and nitrate removal rates of 66.7% and 85.6%, respectively, for a COD/NO3- of 6.3.
The removal of total inorganic nitrogen (NH4+-N+NO2--N+NO3--N) in the complete cycle
treatment (nitrification-denitrification) with CT of 16 h ranged from 81.05% to 87.29%.
During the essays, parameters such as temperature, pH, redox potential, and salinity, were also monitored, because they can influence the nitrification and denitrification processes.
The temperature of the wastewater in the reactor during the treatment cycles ranged from 22.75±1.68 to 226.59±1.04 °C, which favored the development of the nitrifying microorganisms. According to BAE et al. (2002), the optimum temperature for the growth of nitrifying microorganisms ranges from 30 to 35 °C. However, investigation of the treatment of shrimp aquaculture effluent by FONTENOT et al. (2007) using an SBR at different temperatures (22; 28; 37 and 45 ºC) showed a similar performance for a wide range of temperatures, 22-37 °C, and reductions over 89% of all species of nitrogen evaluated (nitrite, nitrate, and ammoniacal nitrogen). High temperatures result in a high consumption of oxygen and high alkalinity, which are necessary for nitrification; in contrast, low temperatures reduce the nitrifying activity.
In relation to the pH, according to WIESMANN et al. (2007), the microorganisms responsible for nitrification develop better in slightly alkaline conditions, in the range from 7.2 to 8.0. To obtain these conditions, the pH was adjusted in the beginning of the aerobic phase to values between 7.5 and 8.0. According to FERREIRA (2000), the nitrification rate can drop significantly for pH value below the neutral zone. The recommended pH value for the nitrification process is in the range 6.5-8.0.
It can be seen in Table 1 that the effluent of the aerobic phase presented a mean pH value of 6.83±0.33, which is a consequence of the consumption of the alkalinity in the nitrification stage. Relative to the redox potential (ORP), it was observed an increase in the aerobic phase (nitrification), reaching a mean value of 99.33±23.78 mV, which is close to the optimum value recommended by WANNER (1991) for nitrification, 100-300 mV.
The initial concentration of salts was lower than 0.7% for all the treatment cycles. Studies by UYGUR & KARGI (2004) evaluated the influence of salinit6y (0-6%) on the reduction of nutrients in synthetic effluent treated in an SBR. It was observed that the removal rate of NH4+ was not
significantly affected by saline concentrations below 1%, attaining removal percentages over 80%. The percent removal of NH4+ decreased sharply, from 96 to 39%, when the saline concentration
ranged from 0 to 6%, a reduction of over 50%.
GROMMEN et al. (2005) reported that salinity is known to decrease the diversity of the nitrifying microorganism population.
Analysis of the stability of the reactor
Figure 1 shows the Shewhart control chart for individual measures of removal of total inorganic nitrogen over 20 assays.
20 19 18 17 16 15 14 13 12 11 10 9 8 7 6 5 4 3 2 1 89
88
87
86
85
84
83
82
81
80
Assays
R
e
m
o
v
a
l
o
f
to
ta
l
in
o
rg
a
n
ic
n
it
ro
g
e
n
(
%
)
_ X=84.32
LCL=80.57 UCL=88.08
FIGURE 1. Shewhart control chart of individual measures for the removal of total inorganic nitrogen (NH4+-N +NO2--N +NO3--N) in the complete process
(nitrification-denitrification).
In Figure 1, one can see that the efficiency of global removal of inorganic nitrogen had a mean value of 84.32±1.59% with a coefficient of variation (CV) of 1.89%, which was confirmed by the reproducibility of the biological treatment process, determined by the low coefficient of variation, which indicates the homogeneity of the experimental data obtained. The lower control limit (LCL) was 80.57% and the upper control limit (UCL) was 88.08%, without any point outside the limits. This fact indicates that the results are statistically satisfactory and that the process is under statistical control.
20 19 18 17 16 15 14 13 12 11 10 9 8 7 6 5 4 3 2 1 80
70
60
50
40
30
Assays
R
e
m
o
v
a
l
o
f
C
O
D
(
%
)
_ X=53.65 UCL=75.05
LCL=32.25
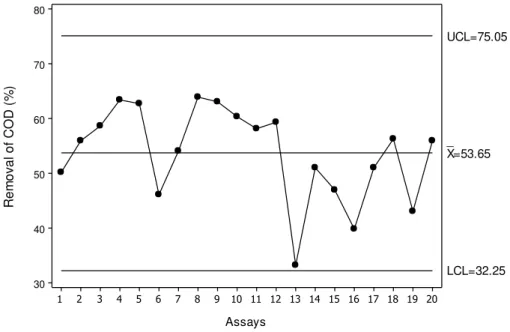
FIGURE 2. Shewhart chart for the removal of COD in the complete process (nitrification-denitrification).
Kinetics of conversion of nitrogen and removal of organic matter
Figures 3 and 4 display the nitrogen substrate and organic matter consumption profiles for an SBR with CT of 16 h.
0,00 50,00 100,00 150,00 200,00 250,00
1 2 3 4 5 6 7 8 9 10 11 12 13 14 15 16
C
o
n
ce
n
tr
a
ti
o
n
(
m
g
N
.L
-1 )
Cycle (hours)
FIGURE 3. Nitrogen substrate consumption (NH4+-N, NO2--N,and NO3--N)
The analysis of Figure 3 reveals that the consumption of ammoniacal nitrogen (NH4+-N) was
more pronounced in the first 7 h and that it was nearly equimolar. In this same period, there was a gradual increase in the concentration of nitrate (NO3--N), from 6.2 to 157.0 mg.L-1.
The concentration of the nitrogen forms (NO2--N and NO3--N) along the anoxic phase
decreased for NO3--N, from 157.50 to 10.00 mg L-1 in only 1 h of denitrification, that is, a removal
of 93.65% from 11 to 12 h. The concentration of NO2--Nalso decreased more than 90% in the same
0,00 200,00 400,00 600,00 800,00 1000,00 1200,00
1 2 3 4 5 6 7 8 9 10 11 12 13 14 15 16 17
C
oncent
rat
ion
(m
gC
O
D
.L
-1)
Cycle (hours)
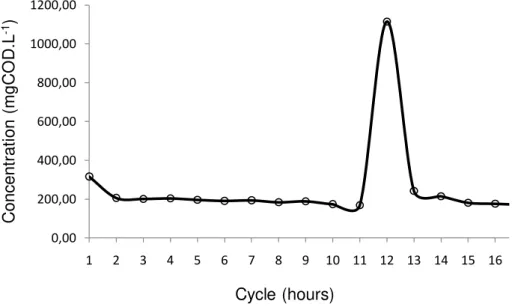
FIGURE 4. Organic matter consumption (COD) profile.
In Figure 4, It can be seen that the concentration of organic matter during the aerobic phase, total CT of 10.15 h, decreased by approximately 50%, falling from 316.25 to 168.74 mg L-1. With the addition of cassava wastewater in the beginning of the anoxic phase to adjust the (COD/NO2--N
+NO3--N) ratio to 6, the concentration of organic matter reached a mean maximum value of
1115.12 mg L-1, rapidly decreasing to 242.50 mg L-1 in the first hour of anoxic reaction,reaching 157.50 mg L-1 in the end of the anoxic phase, with a total CT of 4.35 h.
An organic matter residue was observed 1 h after the addition of cassava wastewater with a concentration similar to that found in the end of the aerobic phase.
Kinetic study of the nitrifying activity
The nitrifying activity was estimated by determining the kinetic parameters based on the fitting of the kinetic models represented by the equations of consumption of the ammoniacal nitrogen substrate (Eq. 2), Nitration (Eq. 3), and nitratation, (Eq. 4). Table 2 displays the mean estimated values of constants K1 andK2.
TABLE 2. Estimated values of K1 and K2.
Nitrification UNIT K1 K2 K2/K1
CT 10.15 h min-1 0.00381±0.00043 0.00249±0.00056 0.65
For the conversion of nitrogen, the initial values of ammoniacal nitrogen varied from 121.70 to 147.42 mg L-1. The fitting for the kinetic model of the first-order series reactions described by LEVENSPIEL (2000) gave mean values of 0.00381±0.00043 and 0.00249±0.00056 min-1 for K1
and K2, respectively, with a K2/K1 ratio of 0.65, indicating that the conversion of ammoniacal
nitrogen to nitrite is not the limiting stage of the process. LEVENSPIEL (2000) found that the more positive this value is in relation to the unit, the smaller the velocity of reaction of formation of the intermediate, which in this case is NO2--N.
In incomplete nitrification conditions, the nitrite produced during the nitritation by
Nitrosomonas becomes an inhibitor of the nitrification process. Nitrite inhibits Nitrobacter in the
nitration because of the reaction of this compound with the enzymes involved in its oxidation process (WILD et al., 1995).
In an investigation of the influence of aeration and reaction time on the nitrification process of the effluent of a Fish slaughterhouse effluent using an SBR with immobilized biomass in workbench scale, ZENATTI (2007) estimated the kinetic parameters of nitrification, obtaining K1
and K2 mean values of 0.00300±0.00030 and 0.00298±0.00024 min-1, respectively, with a K2/K1
ratio of approximately 1, when the reactor was operated with air flow of 6 L.min-1 and with an effluent volume of 2.5 L and reaction time of 12 h. These values are similar to the present ones; however, for a higher air flow.
FAZOLO et al. (2001) evaluated the performance of an aerobic fixed bed reactor in workbench scale in the post-treatment of anaerobic sewage effluent. They found mean values of kinetic constants, K1 and K2, of 0.00419±0.00095 and 0.1104±0.01105 min-1, respectively,
operating with air flows varying from 2 to 15 L min-1, for an effluent volume of 10 L in 4.0, 6.0, and 8.0 h, values which are higher than those of the present study in both stages of the nitrification reaction (nitritation and nitration). This is possibly due to factors such as the reactor configuration, the aeration system utilized, the immobilization of the biomass, and others.
For WEF et al. (2005), several factors, such as the temperature, the pH, oxygen concentration, the type of substrate, and the presence of inhibiting substances affect the growth of microorganisms. Therefore, they influence the velocity of consumption of the substrate and the formation of products of the biochemical reactions.
CONCLUSIONS
The study of the stability of an SBR using Shewhart charts applied to the global removal of inorganic nitrogen and organic matter revealed that the process is under statistical control. The removal of total inorganic nitrogen (NH4+-N+NO2--N+NO3--N) reached mean values of
84.32±1.59% (C.V.=1.89%) and removal of organic matter (CDO) of 53.65±8.48% (C.V.=15.81%) in the complete process (nitrification-denitrification) during the 20 cycles that were evaluated.
The nitrifying activity estimated from the determination of the first-order kinetic parameters had mean values of K1 and K2 of 0.00381±0.00043 and 0.00381±0.00043 min-1, respectively. The
evaluation of the kinetic behavior of the removal of organic matter, and mainly the conversion of nitrogen, indicated a possible reduction of CT in the anoxic phase, since removal rates of NO2--N
and NO3--N higher than 90% were obtained with only 1 h of denitrification.
ACKNOWLEDGEMENTS
We thank CNPq for financial support.
REFERENCES
AKIN, B.S.; UGURLU, A. Monitoring and control of biological nutrient removal in a sequencing batch reactor. Process Biochemistry, London, v.40, n.8, p.2873-2878, 2005.
ANDRADE, L.; KUMMER, A.C.B.; FAZOLO, A.; DAMASCENO, S.; HASAN, S.D. Influência de nitrogênio amoniacal e vazão de ar no processo de nitrificação, etapa de tratamento de efluente de abatedouro de peixe. Engenharia Agrícola, Jaboticabal, v.30, n.1, p.160-167, 2010.
APHA. AMERICAN PUBLIC HEALTH ASSOCIATION. Standard methods for the examination of water and wastewater. 20nd ed. Washington, 1998, 1.193 p.
CARVALLO, L.; POIRRIER, P.; CHAMY, R. Nitrifying activity monitoring and kinetic parameters determination in a biofilm airlift reactor by respirometry. Biotechnology Letters,
Dordrecht, v.24, n.24, p.2063-2066, 2002.
FAZOLO, A.; VIEIRA, G.T.L.; FORESTI, E.; ZAIAT, M. Estimativa dos parâmetros cinéticos e de transferência de massa em um reator aeróbio de leito fixo utilizado no pós-tratamento de efluente anaeróbio. In: Chernicharo, C. A. de L. (Org.). Pós-tratamento de reatores anaeróbios. Belo
Horizonte: Segrac Editora e Gráfica, 2001. v.2.
FERREIRA, E.S.Cinética química e fundamentos dos processos de nitrificação e denitrificação biológica. In: CONGRESSO INTERAMERICANO DE ENGENHARIA SANITÁRIA E
AMBIENTAL, 27., 2000, Porto Alegre. Anais... Porto Alegre: Universidade Federal do Rio Grande
do Sul, 2000.
FIGUEROA, L.A.; SILVERSTEIN, J. The effect of particulate organic matter on biofilm nitrification. Water Environment Research, Alexandria, v.64, n.5, p.728-733, 1992.
FONTENOT, Q.; BONVILLAIN, C.; KILGEN, M.; BOOPATHY, R. Effects of temperature, salinity, and carbon: nitrogen ratio on sequencing batch reactor treating shrimp aquaculture wastewater. Bioresource Technology, Essex, n.98, p.1700-1703, 2007.
GRADY, C.P.L.; DAIGGER, G.T.; LIM, H.C. Biological wastewater treatment. 2nd ed. New York:
Marcel Dekker, 1999. 1076 p.
GROMMEN, R.; DAUW, L.; VERSTRAETE, W. Elevated salinity selects for a less diverse ammonia-oxidizing population in aquarium biofilters. FEMS Microbiology Ecology, Amsterdam,
v.52, n.1, p.1-11, 2005.
GRUNDITZ, C.; DALHAMMAR, G. Development of nitrification inhibition assays using pure cultures of Nitrosomonas and Nitrobacter. Water Research, New York, v.35, n.2, p.433-440, 2001.
HAMMER, M.J.; HAMMER, M.J. Water and Wastewater Technology. 6th ed. New Jersey: Prentice
Hall International, 2007.
JANG, J.D.; BARFORD, J.P.; LINDAWATI; RENNEBERG, R. Application of biochemical oxygen demand (BOD) biosensor for optimization of biological carbon and nitrogen removal from synthetic wastewater in a sequencing batch reactor system. Biosensors and Bioelectronics, Essex,
v.19, p.805-812, 2004.
JULIASTUTI, S.R.; BAEYENS, J.; CREEMERS, C.; BIXIO B.; LODEWYCKX, E. The inhibitory effects of heavy metals and organic compounds on the net maximum specific growth rate of the autotrophic biomass in activated sludge. Journal of Hazardous Materials, Amsterdam, v.100, n.1,
p.271-283, 2003.
KUMMER, A.C.B. Desnitrificação de efluente de abatedouro de tilápia utilizando manipueira como fonte de carbono. 2008. 53 f. Dissertação (Mestrado em Engenharia Agrícola) - Universidade
Estadual do Oeste do Paraná, Cascavel, 2008.
LEVENSPIEL, O. Engenharia das reações químicas. São Paulo: Editora Edgard Blücher, 2000.
584 p.
LI, B.; IRVIN, S. The comparison of alkalinity and ORP as indicators for nitrification as
denitrification in a sequencing bacth reactor (SBR). Biochemical Engineering Journal, Amsterdam,
n.34, p.248-255, 2007.
MARTIENSSEN, M.; SCHÖPS, R. Population dynamics of denitrifying bacteria in a model biocommunity. Water Research, New York, v.33, n.3, p.639-646, 1999.
METCALF & EDDY. Wastewwater engineering: treatment, disposal and reuse. 3.ed. New York:
MONTGOMERY, D.C. Introdução ao controle estatístico da qualidade.4.ed. Rio de Janeiro: LTC,
2004. 513 p.
SEIXO, J.; VARELA M. H.; COUTINHO, J.A.P.; COELHO, M.A.Z. Influence of C/N ratio on autotrophic biomass development in a sequencing batch reactor. Biochemical Engineering Journal,
Amsterdam, n.21, p.131-139, 2004.
ZENATTI, D.C. Avaliação da nitrificação de efluente de abatedouro de tilápia em reator em batelada sequencial com biomassa imobilizada. 2007. 90 f. Dissertação (Mestrado em Engenharia
Agrícola) - Universidade Estadual do Oeste do Paraná, Cascavel, 2007.
UYGUR, A.; KARGI, F. Salt inhibition on biological nutrient removal from saline wastewater in a sequencing batch reactor. Enzyme and Microbial Technology, New York, v.34, n.3-4, p.313-318,
2004.
WANNER, J. Use of the routine biological analysis to check the performance of sewage treatment plants. In: INTERNATIONAL SYMPOSIUM BIOLOGICAL APPROACH TO SEWAGE
TREATMENT PROCESS: CURRENT STATUS AND PERSPECTIVES, 1991, Perugia. Anais…
Perudia: ed. Paolo Madoni, 1991. p.199-210.
WERKEMA, M.C.C. Ferramentas estatísticas básicas para o gerenciamento de processos. Belo
Horizonte: Fundação Cristiano Ottoni, Escola de Engenharia da UFMG, 1995. 404 p. Water Environment Federation - WEF; American Society of Civil Engineers - ASCE;
Environmental Water Resources Institute - EWRI. Biological nutrient removal (BNR) operation in wastewater treatment plants (Asce Manual and Reports on Engineering Practice). New York:
McGraw-Hill, 2005.
WIESMANN, U.; CHOI, I.S.; DOMBROWSK, E.M. Fundamentals of biological wastewater treatment. Weinheim: WILEY-VCH Verlang GmbH & Co KGaA, 2007. 362 p.
WILD, D.; SCHULTHESS, R.; GUJER, W. Structured modeling of denitrification intermediates.