Original Article http:// ijp.mums.ac.ir
The Incidence of Low Birth Weight (LBW) and Small- for-
Gestational Age (SGA) and its Related Factors in Neonates,
Sabzevar, Iran
Nasrin Hashemian Nejad1, Akbar Pejhan2, Mohammad Hassan Rakhshani 3,
Bibi Leila Hoseini4
1
Neonatalogist, Assisstant Professor, Faculty of Medicine, Sabzevar University of Medical Sciences, Sabzevar, Iran.
2
Associate Professor, Physiology Department, Faculty of Medicine, Sabzevar University of Medical Sciences, Sabzevar, Iran.
3
Assisstant Professor, Biostatistics Department, Faculty of Public Health, Sabzevar University of Medical Sciences, Sabzevar, Iran.
4
Midwifery MSc, Insructor, Faculty of Nursing and Midwifery, Sabzevar University of Medical Sciences, Sabzevar, Iran.
Abstract Introduction
Low birth weight (LBW) is a high risk for children's health and a problem of public health in under developing countries. SGA increases neonatal and infant death, and neonatal and adult morbidity. So the present study aimed to assess the incidence of LBW, SGA and their related factors in Sabzevar, Iran.
Materials and Methods
This prospective descriptive-analytic study was conducted on 481 low birth weight neonates born in Mobini Academic Hospital of Sabzevar, Iran, in 2011 to 2012. Neonates who their BW was <2500g entered the study. Study tool was a researcher-made checklist. It was confirmed by content validity and internal consistency (Cronbach's alpha (α=0.81)) reliability. Data were analyzed by descriptive- analytic statistics and using SPSS 11.5.
Results
480 (6.33%) of participating newborns were LBW (out of 7599). Mean weight of LBW neonates was (2039.1±9.6) g. Among LBW neonates, 62 (12.7%) and 24 (5%) of neonates were Very low birth weight (VLBW) and Extremely low birth weight (ELBW), respectively. 162 (34.1%) of neonates were SGA (out of LBW neonates). SGA rate was 2.2% (out of total newborns). Family income (p =0.026) and mother's education (p =0.004) were significantly lower in SGA neonates rather than LBW neonates. The incidence of mothers' urinary infection in VLBW neonates was significantly higher than non-VLBW neonates (p <0.001).
Conclusion
Findings showed that LBW and SGA incidence were similar to these statistics in developed countries and also other cities of Iran. But most types of growth retardation were asymmetric, in reverse to the reference books.
Keywords: Low Birth Weight (LBW), Small for Gestational Age (SGA), Related Factors.
*
Corresponding Author:
Bibi Leila Hosein, Midwifery MSc, Insructor, Nursing and Midwifery Faculty, Sabzevar University of Medical Sciences, Sabzevar, Iran.
E-mail: Hoseinil871@gmail.com
International Journal of Pediatrics (Supplement 6), Vol.2, N.4-2, Serial No.11, November 2014 74 Introduction
Low birth weight (LBW) is a high risk for children's health and also an indicator of a public-health problem in under developing countries. LBW is defined as a birth weight of a live born infant less than 2,500 g, regardless of gestational age. LBW is either caused by preterm birth (which is defined as younger than 37 weeks of gestational age) or the infant being small for gestational age, or a combination of both. Subcategories of preterm birth include early preterm (24 0/7– 33 6/7 weeks of gestation) and late preterm (34 0/7–36 6/7 weeks of gestation) (1-5). SGA is defined as growth at the 10th or less percentile for weight of all fetuses at that gestational age (6). Prematurity and SGA are associated with neonatal and infant mortality and morbidity, and some disorders such as dysfunction of immune system in adulthood (6, 7). LBW reflects not only situation of health and nutrition, but also indicates survival rate, psychosocial and health growth and development. Intrauterine malnutrition sometimes sustains in all life time by causing hypotonicity. It also increases higher incidence of diabetes and heart disease, cognitive disorders and Intelligence quotient (IQ) (7) in adulthood. LBW incidence ranges from 8.1%lower in developed countries and 30-60% in under developing countries. The incidence of SGA neonates is one third of LBW neonates (6). Subcategories of LBW include Very low birth weight (VLBW) which is less than 1500 g, and Extremely low birth weight (ELBW) which is less than 1000 g. VLBW is a precise index for predicting neonatal death. It includes more than 50% of neonatal death rate and 50% of morbidities and neurological disabilities (8).
Previous studies have been assessed different factors like smoking, socio-economic situation, and consuming chlorinated water in induction of LBW and SGA neonates (9, 10). Since we have not found any study about the incidence rate of LBW, SGA and VLBW and their relationship with family's socio-economical
situation in Sabzevar, the present study aimed to assess the incidence of LBW and SGA and their related factors in Sabzevar, Iran, in 2011 to 2012.
Materials and Methods
This prospective descriptive-analytic study was conducted on low birth weight neonates born in Mobini Academic Hospital in Sabzevar, Iran, 2011 to 2012. Participants were 481 LBW neonates by consensus sampling. The research was confirmed by Ethics Research Committee of Sabzevar University of Medical Sciences. Informed consents were obtained from parents of admitted neonates. Then data were gathered by 2 expert nurses who occupied in Neonatal intensive-care unit (NICU) by using a researcher-made checklist. The checklist was confirmed by content validity and internal consistency (Cronbach's alpha (α=0.81)) reliability. The checklist includes some neonatal characteristics such as: weight, gender, Apgar score, birth priority, anomaly in neonate, multiple pregnancy, delivery type, gestational age, etc.; and maternal information like perinatal problems (diabetes, preeclampsia, heart disease, renal disease, etc.), drug history, addiction, smoking, prenatal nutrition, and socioeconomic status.
Weight (W), height (H) and head circumference of neonates were measured initially at birth. Neonates' weight was measured by a Seca scale with an accuracy of 5 g. Anthropometric indices (weight, height, head and abdomen circumference) were charted on standard curves of neonatal growth according to gestational age. Neonatal percentiles <10% were classified as SGA (small for gestational age) and percentiles 10-90% were classified as appropriate for gestational age (AGA). Gestational age was calculated first according to Last menstrual period (LMP) if it was valid and then sonography, especially if it was done before 20 w of GA. Ponderal index (PI)1 was calculated for each neonate
1
and its percentile was determined according to standard curves mentioned in text books. The checklists were completed by one of nurses before discharge of the neonates. Data were coded and analyzed by descriptive and analytic (one-way analysis of variance (ANOVA), t-test) statistics and confidence interval 95% by SPSS-11.5. P < 0.05 was considered significant.
Results
480 (6.33%) newborns were LBW (out of 7599 births). 275 neonates (57.4%) were female (Table.1).
Table 1: Frequency of maternal demographic
and socio-economical situation
Variable N (percent)
Neonates
gender male
female ambiguous genitalia 203(42.3%) 275(57.4%) 1(0.2%) Birth priority The first Second third 4≤ 201(41.9%) 134(27.9%) 82(17.1%) 63(13.1%) Delivery type C.S
N.D 238(49.8%)
240(50.2%)
Multi-pregnancy Yes
No 112(23.5%)
365(76.5%)
Cord diameter Thin Not thin 22(4.6%) 454(95.4%) Mothers Mother's education Illiterate Primary
Junior high school High school Academic 42(8.9%) 138(29.2%) 86(18.2%) 149(31.5%) 58(12.3%) Place of residence City Village 282(59.7%) 190(40.3%)
Prenatal care Yes No 450(95.1%) 23(4.9%) Pregnancy nutrition Suitable Unsuitable 423(88.9%) 53(11.1%) Preconception nutrition Suitable Unsuitable 459(95.6%) 11(2.3%) Heavy work Yes No 44(9.3%) 428(90.7%) Mother's addiction Opium addiction Smoke, hookah Opium addiction, Smoke, hookah 22(4.6%) 3(0.6%) 1(0.2%)
Mean weight of LBW neonates was 2039.1±9.6 g (Table. 2). The lowest weight of neonates was 440 g and the most weight was 2490 g. The least and the most gestational age was 23 w vs. 40 w.
Table 2: Mean of Demographic Variables in
mothers and neonates
Variables Mean ± SD
Neonates
Weight (g) 2039.1±9.6
Height (cm) 45±0.16
Head circumstance (cm) 31.5±0.10
Abdominal circumstance (cm) 25.4±0.11
Gestational age (w) 35.5±0.16
Mothers
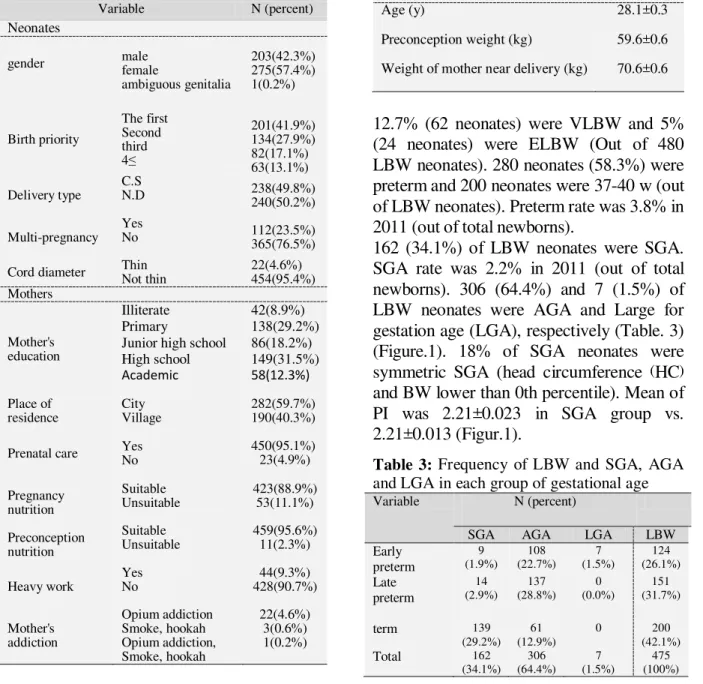
Age (y) 28.1±0.3
Preconception weight (kg) 59.6±0.6
Weight of mother near delivery (kg) 70.6±0.6
12.7% (62 neonates) were VLBW and 5% (24 neonates) were ELBW (Out of 480 LBW neonates). 280 neonates (58.3%) were preterm and 200 neonates were 37-40 w (out of LBW neonates). Preterm rate was 3.8% in 2011 (out of total newborns).
162 (34.1%) of LBW neonates were SGA. SGA rate was 2.2% in 2011 (out of total newborns). 306 (64.4%) and 7 (1.5%) of LBW neonates were AGA and Large for gestation age (LGA), respectively (Table. 3) (Figure.1). 18% of SGA neonates were symmetric SGA (head circumference (HC) and BW lower than 0th percentile). Mean of PI was 2.21±0.023 in SGA group vs. 2.21±0.013 (Figur.1).
Table 3: Frequency of LBW and SGA, AGA
and LGA in each group of gestational age
Variable N (percent)
SGA AGA LGA LBW
Early preterm 9 (1.9%) 108 (22.7%) 7 (1.5%) 124 (26.1%) Late preterm 14 (2.9%) 137 (28.8%) 0 (0.0%) 151 (31.7%)
term 139
(29.2%) 61 (12.9%)
0 200
(42.1%)
Total 162
International Journal of Pediatrics (Supplement 6), Vol.2, N.4-2, Serial No.11, November 2014 76 Mean weight of neonates was respectively
(1174.4±36.8) and (2182.2±12.9) in <1500 g (VLBW) and >1500 g groups. There was not a significant difference between mother's age and weight in these two groups (Table. 4).
Table 4: Mean of some variables in two
groups of neonatal weight
Variables Mean ± SD
P-value <1500 g >1500 g
Weight (g) 1174.4±36.
8
2182.2±12. 9
<0.00 1
Height (cm) 38.7±.4 46.1±.1 <0.00
1 Head
circumstance (cm)
27.7±.3 32.2±.1 <0.00
1
Abdominal circumstance (cm)
21.3±.4 25.8±.1 <0.00
1
Gestational age (w)
30.1±.4 36.3±.1 <0.00
1
Mother age (y)
27.9±.9 28 ±.3 0.825
Preconceptio n weight of mother (kg)
60.9±2.4 59.3±.6 0.811
Weight of mother near delivery (kg)
69.1±2.5 71.2±.7 0.123
Mothers' urinary infection incidence was
18.3% in VLBW neonates vs. 4.4% in non-
VLBW neonates.
Family income (p=0.026) and mother's education (p=0.004) were significantly lower in SGA neonates in comparison with the other LBW neonates. The incidence of mothers' urinary infection in VLBW neonates was significantly higher than non-VLBW neonates (p<0.001). Inadequate nutrition and low BMI of mothers were more in SGA neonates, but there was no significant relationship (p>0.05). There was not a significant relationship between neonatal gender and birth priority with VLBW and ELBW; but there was a significant relationship between gender (p =0.024) with weight percentile. Female neonates had lower percentiles.
There was not a significant relationship between VLBW with deformity of organs, cord diameter, multi-pregnancy, mother's addiction, mother's education, place of residence, prenatal care, and heavy work during pregnancy; but there was a siginificant relationship between VLBW with prenatal difficulties (p<0.001), maternal problrms (p <0.001) and neontal apgar (p<0.001). Among mentioned variables, there was just a significant relationship between ELBW with cord diameter (p <0.001), prenatal difficulties (p-value=0.002), maternal problems (p<0.001) and neonatal apgar (p<0.001).
There was a significant relationship between GA with neonatal apgar (p<0.001).
Chart 1:Percentiles of participants’ anthropometric indices
0 20 40 60 80 100 120 140 160 180 200
F
re
q
u
e
n
cy
Percentile of Anthropometric indices
Percentile of Anthropometric indices
W
H
HC
Discussion
The incidence of LBW is a good criterion in order to assess condition of mother's nutrition and health (7). LBW incidence was 6.3% in the present study. It is lower than Asian (19.7%), but it was similar to European (6.5%), North American (6.8%) and some other studies in different cities of Iran.
Preterm is one of important reasons for LBW (6, 8, 11). Preterm rate was 58.3% among LBW neonates, which was 3.8% out of total newborns in one year. The incidence of SGA was 34% in the present study which is similar to developed countries (6). SGA was 2.2% out of total newborns in one year. Mosayebi et al. showed that more than half of LBW neonates were preterm and the rest were IUGR (12). SGA incidence was 8.6% among preterm neonates in the present study. This result was in accordance with some statistics from NICHD Neonatal Research Network (NRN) in which SGA incidence was 9% in a 20'000 VLBW population of 25-30 w neonates; vs. 22% in a 4438 VLBW population of neonates (13).
In the present study, female gender was associated with LBW; so that 57.4% of LBW and 62.3% of SGA neonates were female. This finding is in consistent with some studies in Japan and Canada in which female gender was associated with a higher risk of LBW (14, 15).
20.4% of LBW neonates were due to multi-pregnancy in the present study. Zahed Pasha et al. concluded that preterm labor and multi-pregnancy increased LBW significantly (16).
In the present study, there was a significant relationship between VLBW and ELBW with prenatal difficulties, maternal problems and neonatal Apgar. But in contrast to Valero et al. who showed several factors like tobacco products consumption, alcohol and socio-economic level as effective factors in
inducing pregnancy complications such as LBW, Intrauterine growth restriction (IUGR) and preterm labor (5), we did not find any significant relationship between LBW and these factors. However, in our study, mother's education and family income in SGA neonates was significantly lower than non-SGA neonates which is on accordance with mentioned study.
Conclusion
Findings showed that LBW and SGA incidence were similar to these statistics in developed countries and also other cities of Iran. But most types of growth retardation were asymmetric, in reverse to the reference books. So, we recommend educating caregivers for precise prenatal care and encouraging mothers for regular referral in order to have decrease LBW and SGA neonates.
Conflict of Interest: None.
Acknowledgment
The researchers would like to appreciate dear participants in this study and the cooperation of Vice Presidency of Sabzevar University of Medical Sciences.
References
1. Cunningham, F. Gary, Whitridge J. Williams obstetrics. 22nd ed. New York : McGraw-Hill, Medical Pub. Division, c2005, 2010.
2. Hoseini BL, Saeidi M, Vakili R, Kiani MA, Rabiei M, Khakshour A, et al. Assessment the Relationship between Parents' Literacy Level with Children
Growth in Mashhad: An Analytic
Descriptive Study. International J of Pediatrics 2014; 2(2.1): 59.
International Journal of Pediatrics (Supplement 6), Vol.2, N.4-2, Serial No.11, November 2014 78
4. Saeidi M, Ajilian M, Farhangi H, Khodaei GH. Rights of Children and Parents in Holy Quran. International J of Pediatrics 2014; 2(3.2): 103-13.
5. Ghazizade Hashemi SA, Bayyenat S, Purbafrani A, Taghizade Moghaddam H, Saeidi M. Comparison of Immunization in Iran and Turkey between Years 1980- 2013. International J of Pediatrics 2014; 2(3.3): 75-83.
6. Michael G Ross; Roy Zion Mansano. Fetal Growth Restriction. Available at : http://emedicine.medscape.com/article/261 226-overview .
7. UNICEF, ChildInfo- Monitoring the Situation of Children and Women, “Under-five Mortality (U5MR)”, URL: http://www.childinfo.org/mortality_underf ive.php
8. Nelson Textbook of Pediatrics: 16th Edition. Richard E. Behrman MD, Robert M. Kliegman MD, Hal B. Jenson MD ;2000: p.451-2 p479-85.
9. Valero De Bernabé J, Soriano T, Albaladejo R, Juarranz M, Calle ME, Martínez D,et al. Risk factor for low birth weight ;a review.eur.j obstet coynecal reprod boil 2004,116(1):3-15.
10. Moser K, Power C. Social inequalities in low birth weight in England and wales:treads and implications for future population health.j epidemiol community health 2003,57(9):687-91.
11. Morbidity and Mortality Weekly
Report (MMWR). URL:
http://www.cdc.gov/mmwr/. (Accessed: 7 July 2013).
12. Mosayebi Z, Fakhraei SH, Movahedian AH. Prevalence and risk factors of low birth weight infants in Mahdieh Hospital in, Tehran. FEYZ J 2004; 30(8):58-67.
13. Mandy GT. Small for gestational age infant. Available from: URL: http://www.uptodate.com/contents/small-for-gestational-age-infant. Accessed: 21 May 2013.
14. Takimoto H, Yokoyama T, Yoshiike N, Fukuoka H. Increase in LBW infants in Japoan and associated risk factors. J Obstet Gynecol Res 2005; 31(4):314-22. 15. Tough SE, Svenson LW, Jonston DW, et al. Characteristics of preterm delivery and LBW among infants in Alberta. Can J Public Health. 2001; 92(4):276-80.