www.epjournal.net – 2014. 12(1): 148-166 ¯ ¯ ¯ ¯ ¯ ¯ ¯ ¯ ¯ ¯ ¯ ¯ ¯ ¯ ¯ ¯ ¯ ¯ ¯ ¯ ¯ ¯ ¯ ¯ ¯ ¯ ¯ ¯
Original Article
Self-Reported Availability of Kinship Cues During Childhood is Associated
with Kin-Directed Behavior to Parents in Adulthood
Jan Antfolk, Department of Psychology and Logopedics, Åbo Akademi University, Turku, Finland. Email:
[email protected] (Corresponding author).
Helena Lindqvist, Department of Psychology and Logopedics, Åbo Akademi University, Turku, Finland.
Anna Albrecht, Department of Psychology and Logopedics, Åbo Akademi University, Turku, Finland.
Pekka Santtila, Department of Psychology and Logopedics, Åbo Akademi University, Turku, Finland.
Abstract: Reliable recognition of kin is an important factor in modulating kin-directed
behaviors. For example, in selectively directing cooperative behavior to kin and diverting sexual interest away from them, kin first need to be recognized as such. Although an increasing number of studies have examined what information is employed in recognizing siblings and children, less is known about the information children employ in identifying their parents. In a web-based survey, we asked 702 Finnish undergraduate and graduate students to report the availability of a number of possible kinship cues during their childhood and youth. After factorization of the responses, we found that the reported amount of parental support, phenotypic similarity, and behavioral similarity generally predicted subjective certainty in relatedness and kin-directed behavior (i.e., cooperative behavior and inbreeding aversion) to parents in adulthood. Although the data suffer from their retrospective nature, the present study provides potentially useful information about kin-recognition of parents.
Keywords: kin recognition, kin selection, inclusive fitness, inbreeding avoidance,
evolutionary family psychology
¯ ¯ ¯ ¯ ¯ ¯ ¯ ¯ ¯ ¯ ¯ ¯ ¯ ¯ ¯ ¯ ¯ ¯ ¯ ¯ ¯ ¯ ¯ ¯ ¯ ¯ ¯ ¯ ¯ ¯ ¯ ¯ ¯ ¯ ¯ ¯ ¯ ¯ ¯ ¯ ¯ ¯ ¯ ¯ ¯ ¯ ¯ ¯ ¯ ¯ ¯ ¯ ¯ ¯ ¯ ¯ ¯ ¯ ¯ ¯ ¯ ¯ ¯ ¯ ¯ ¯ ¯ ¯ ¯ ¯ ¯ ¯ ¯ ¯ ¯ ¯ ¯ ¯ ¯ ¯ ¯ ¯ ¯ ¯ ¯ ¯ ¯ ¯
Introduction
Evolutionary Psychology – ISSN 1474-7049 – Volume 12(1). 2014. -149-
number of allele copies that is passed on, either via direct descendants or via offspring of related individuals. Relatedness between two individuals can be defined as the relative increase in the probability of two individuals sharing a certain allele compared to the average probability of two individuals from the population sharing the same allele (Grafen, 1985).
Inclusive-fitness theory is important for understanding the ultimate evolutionary cause of kin selection, such as cooperative behavior and other social behaviors that have fitness consequences to the recipient (e.g., West, El Mouden, and Gardner, 2011; West, Griffin, and Gardner, 2007). As kin have an increased probability of sharing copies of the alleles underlying kin selection, alleles increasing the investment in the well-being and reproductive success of our kin furthers the likelihood that these alleles will be transmitted down the generations. Conversely, by harming the reproductive success of our kin (e.g., by engaging in inbreeding), we harm our own inclusive fitness, and alleles counteracting such behaviors should be selected for. However, kin selection implies that kin need to be discriminated from non-kin. Although kin recognition (i.e., the ability to identify another
individual as kin) is not necessary for a behavior to affect inclusive fitness, kin recognition is thought to be a proximate mechanism of paramount importance in the evolution of kin-discriminant social and sexual behavior in humans (e.g., Krupp, DeBruine, and Jones, 2011; Penn and Frommen, 2010).
As single-gene recognition, so called green-beard effect, is believed to be rare in humans (e.g., Qirko, 2011), human kin recognition is assumed to rely largely on environmental information. Environmental information underlying kin-recognition can be either indirect and contextual or direct (e.g., Penn and Frommen, 2010). An example of indirect, contextual kin recognition in humans is early co-residence (Westermarck, 1891), where individuals co-residing in childhood conceptualize each other as kin. Direct kin-recognition in humans consists of, for example, phenotype matching, where another individual’s phenotypic characteristics are compared to psychological kin templates that, in turn, can be either other-referent (i.e., based on information from already recognized kin) or self-referent (i.e., based on information about oneself) (Krupp, DeBruine, and Jones, 2011).
Phenotype matching may function to recognize kin of all types (e.g., siblings, children, and parents). Indeed, studies have found support for phenotype matching in recognizing siblings (e.g., DeBruine et al., 2011; Marcinkowska, Moore, and Rantala, 2013) and children (e.g., Alvergne, Faurie, and Raymond, 2007, 2009, 2010; DeBruine, 2004; Dubas, Heijkoop, and van Aken, 2009; Platek, Burch, Panyavin, Wasserman, and Gallup Jr, 2002; Platek et al., 2003). Less is known about the role of phenotype matching in recognizing parents, but some studies indicate that both facial (DeBruine, 2005; Marcinkowska and Rantala, 2012) and olfactory (Cernoch and Porter, 1985; Weisfeld, Czilli, Phillips, Gall, and Lichtman, 2003) phenotype matching may be used.
sibling in a durable, maternal perinatal association with a woman already recognized as one’s mother also serves as an important cue of kinship and that this cue moderates the effect of co-residence. For older siblings, who, contrary to younger, can rely on maternal perinatal association, there is a less pronounced effect of co-residence on kin-directed behavior. From a child’s perspective, co-residence–or, more specifically, being nurtured and cared for by an adult–could be a cue that provides reliable information about being related to an adult. This cue had a central role in attachment theory, which initially was evolutionarily informed (Bowlby, 1969). Indeed, it is likely that identifying primary and early caretakers as parents is a heuristic that likely would have provided reliable information about relatedness during the course of evolution.
Aims of the present study
Reliable recognition of parents has likely had evolutionary value. It has been shown that compared to biologically related care-takers, unrelated care-takers are markedly more likely to abuse or even kill a child (e.g., Daly and Wilson, 1988; Sariola and Uutela, 1996; Tooley, Karakis, Stokes, and Ozanne-Smith, 2006). Moreover, the increased interest a biologically related parent has in a child’s well-being, survival, and reproduction may make biological parents a better and more reliable source of advice and investment than non-biological parents.
Thus, the first aim of the present study was to gain a better understanding of the kinship cues used by children to recognize their parents, as research in this field is limited, by creating an instrument with which some of these cues can be measured.
As a kin recognition mechanism must influence behavior to be the subject of selection, the second aim of the present study was to use the individually reported availability of the cues reported in the first part of the study to predict subjective certainty in relatedness and kin-directed behavior (i.e., cooperative behavior and strength of inbreeding aversion) to the individuals recognized as parents. We expected that the presence of kinship cues would be positively associated with increased subjective certainty in relatedness, cooperative behavior, and the strength of inbreeding aversion towards parents.
Materials and Methods
Our sample consisted of 702 participants: 552 women (mean age = 26.13, SD =
6.65) and 150 men (mean age = 27.75, SD = 6.39). Of the 739 individuals completing the
Evolutionary Psychology – ISSN 1474-7049 – Volume 12(1). 2014. -151-
Department of Psychology and Logopedics approved the study in April 2012.
Items measuring children’s kinship cues for identifying parents
This part of the questionnaire consisted of items expected to measure kin-recognition cues to each of the participant’s parents regarding looks, behavior, and received investment from the male and female individuals the participants identified as their parents. The questionnaire’s items measuring parental identification from the child’s perspective were created as a result of brainstorming on the basis of relevant background literature regarding possible indirect, contextual information or direct information that may provide information about relatedness to a parent. The list of items contained, for example, received support (e.g., “How much did your mother/father talk to you when you were a child?”), time spent together (e.g., “How much time did your mother/father spend together with you and others (e.g., siblings, other adults) when you were 5-12 years old?”), phenotypic similarity (e.g., “How much have your mother’s/father’s relatives said you and your mother/father resemble each other regarding looks?”), and behavioral similarity (e.g.,
“How much have non-relatives said that you and your mother/father resemble each other regarding behavior?”). The participants responded to the 32 items on Likert-type scales rating them from 1 to 9 (1 = “Not at all,” 9 = “Very much/Very many/Very often”).
Items measuring the amount of time a parent spent working
Participants were asked “How many hours a day did your mother/father work when you were a child (including business trips) when you were 0-5 years old/5-12 years old/12-18 years old?” Another item measuring parental negligence asked “How often have you felt that your mother/father ignored you or your needs?” Results for these questions were inverted prior to analyses.
Items measuring children’s subjective certainty in relatedness to parents
We asked the participants to rate their subjective certainty in biological relatedness to each parent on a Likert-type scale from 1 to 9 (1 = “Completely certain,” 9 = “Not at all certain”). Specifically, they were asked “How certain are you that your mother/father is your biological mother/father?” Before analyses, we inverted the scale.
Items measuring children’s cooperative behavior directed towards parents
The questionnaire also included items regarding cooperative behavior directed towards each parent, in the form of how willing they are to contact their parents (e.g.,
“How often do you call your mother?”), which the participants rated on a Likert-type scale from 1 to 9 (1 = “Not at all,” 9 = “Daily”).
Items measuring children’s inbreeding aversion towards parents
first-person (e.g., “you and your father”) and third-person (e.g., “someone and their father”) descriptions of incestuous encounters. In both cases, participants were asked to report the level of disgust elicited by these descriptions on a Likert-type scale from 1 to 9 (1 = “Not at all,” 9 = “Extremely”). Responses to first-person descriptions suffered from a strong ceiling effect and were excluded. Thus, we included only third-person inbreeding aversion in the analyses. Assuming that in evaluating third-person scenarios an egocentric empathic
process (e.g., Antfolk, Marcinkowska, Lieberman, and Santtila, submitted; Fessler and Navarrete, 2004), by which an individual places themself in the position of the described persons and react as if they themselves would be they engaging in the described behavior, third-person incest scenarios have previously been used to measure variations in inbreeding aversion influenced by the responding person’s own experiences (Antfolk et al., 2012; Lieberman, Tooby, and Cosmides, 2003; Royzman, Leeman, and Sabini, 2008).
The factor structure of the items assumed to measure kinship cues toward each parent were first subjected to an exploratory factor analysis (EFA) in SPSS 18.0. Out of the 1,342 responses, we randomly selected roughly 50% of the cases (644) to the EFA, leaving the rest of the cases (698) to confirmatory factor analyses (CFA). For the CFA, AMOS Graphics 7.0 was used. Due to the fairly large sample size influencing the χ2 test (West, Finch, and Curran, 1995), we chose to report and consider three additional measures of model fit for the CFA: the root-mean-square error of approximation (RMSEA), the goodness-of-fit index (GFI), and comparative fit index (CFI). Then, we examined the loading invariance between an unconstrained model, in which factor loadings for mothers and fathers were not constrained, and a constrained model, in which factor loadings for mothers and fathers were constrained. If factor loadings between different groups are invariant, the relative strength of each indicator can be constrained to be the same in both groups without significant reduction in model fit, allowing for comparing measurements between mothers and factors (Little, 2013).
Results
We started by analyzing the kinship cues reported by participants to each parent using factor analytic procedures to reduce the items to a smaller number of scales that would be more manageable in the following analyses. After this, we tested if these scales were associated with the three validation criteria included in the study: subjective certainty in relatedness to the parent, cooperative behavior directed toward the parent, and incest aversion.
For the exploratory factor analysis, we chose approximately 50% of responses concerning the individual identified as father and 50% of the responses concerning the individual identified as mother. The other 50% of the responses were left for a cross-validation using CFA. By conducting a factor analysis on all 32 items measuring kinship cues for both mothers and fathers, co-varying groups of items were identified. An adequate common variance between the individual items for this analysis was demonstrated first in an analysis that included simultaneously responses regarding both mothers and fathers with the Kaiser-Meyer-Olkin measure having a value of .914 (p < .001). Also, separate analyses
Evolutionary Psychology – ISSN 1474-7049 – Volume 12(1). 2014. -153-
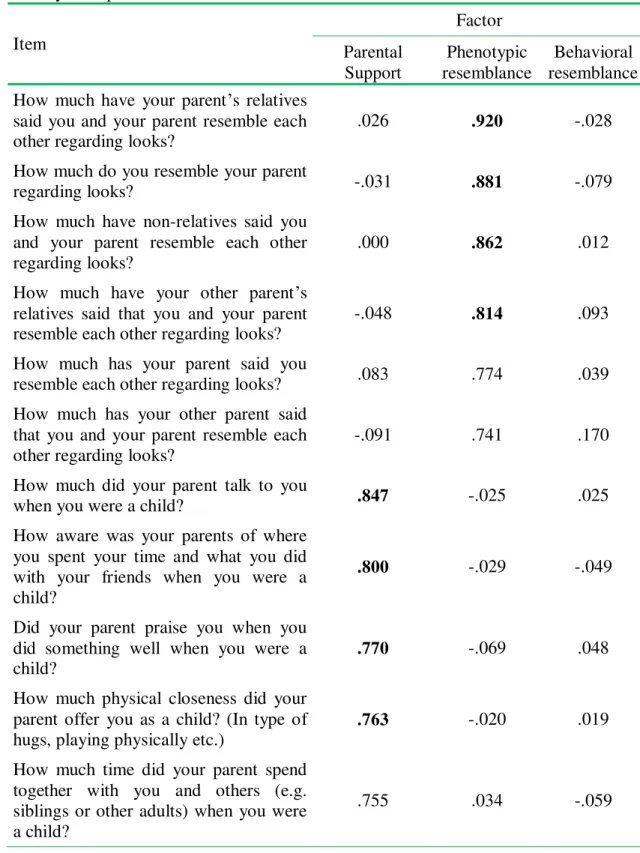
factorability. In the joint analysis of responses regarding both mothers and fathers, the initial 10 eigenvalues were 10.06, 4.77, 2.35, 1.49, 1.45, 1.19, 0.94, 0.84 0.76 and 0.70. As a visual examination of the scree-plot indicated that a three-factor solution seemed appropriate, we extracted three factors using a Direct Oblimin Rotation with a Maximum Likelihood extraction method. Direct Oblimin Rotation was used as we expected that valid kinship cues would be intercorrelated, as they reflect actual relatedness.
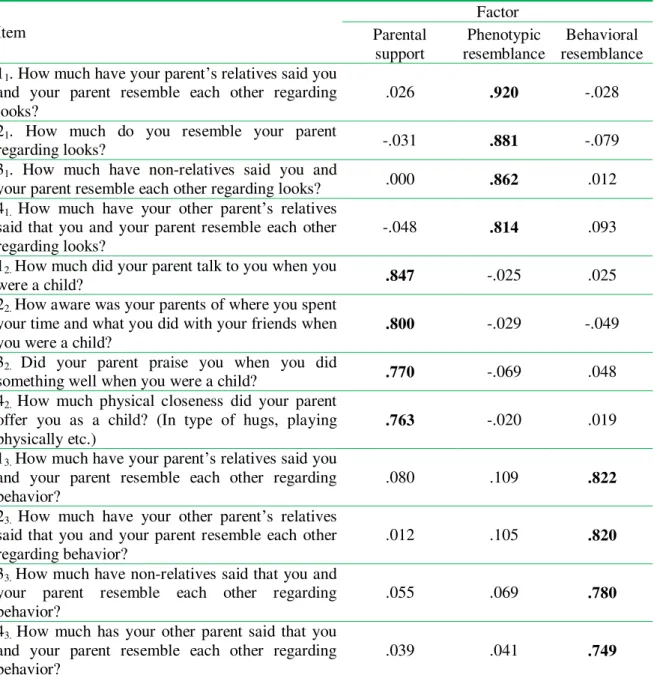
Table 1. Three factor solution of the items measuring kinship cues used by children to
identify their parents
Item
Factor Parental
support resemblance Phenotypic resemblance Behavioral 11. How much have your parent’s relatives said you
and your parent resemble each other regarding
looks? .026 .920 -.028
21. How much do you resemble your parent
regarding looks? -.031 .881 -.079
31. How much have non-relatives said you and
your parent resemble each other regarding looks? .000 .862 .012 41. How much have your other parent’s relatives
said that you and your parent resemble each other
regarding looks? -.048 .814 .093
12. How much did your parent talk to you when you
were a child? .847 -.025 .025
22. How aware was your parents of where you spent
your time and what you did with your friends when
you were a child? .800 -.029 -.049
32. Did your parent praise you when you did
something well when you were a child? .770 -.069 .048 42. How much physical closeness did your parent
offer you as a child? (In type of hugs, playing
physically etc.) .763 -.020 .019
13. How much have your parent’s relatives said you
and your parent resemble each other regarding
behavior? .080 .109 .822
23. How much have your other parent’s relatives
said that you and your parent resemble each other
regarding behavior? .012 .105 .820
33. How much have non-relatives said that you and
your parent resemble each other regarding
behavior? .055 .069 .780
43. How much has your other parent said that you
and your parent resemble each other regarding
behavior? .039 .041 .749
Notes: Only the four items having the highest factor loadings on each factor are included in the table. See
Appendix for the factor loadings for all original items. 11– 43 denote variable names and are also used in
These separate factors were conceptualized as parental support, phenotypic similarity, and behavioral similarity (See Table 1). For further analyses, we chose to create three scales measuring each factor. To obtain short scales that would be feasible to use in further studies while maintaining high internal reliability, we chose to include the four items with the highest factor loadings on each scale. All included items had high loadings on their respective factors (above .749), and all scales had high internal reliability (α > .842). (See Appendix for additional scale construction details).
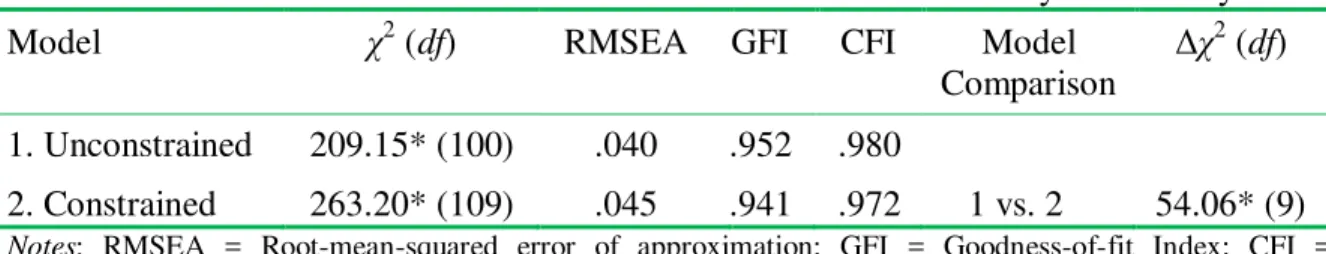
In the CFA, we tested the model fit of an unconstrained model where factor loadings for responses regarding mothers and fathers were estimated separately, and a constrained model where factor loadings for responses regarding mothers and fathers were estimated simultaneously. We found that also in the constrained model, the three-factor solution suggested in the EFA showed good fit in the CFA. (See Table 2 for model fit indicators and Appendix for additional statistical details).
Table 2. Model fit indicators of the two models used in the confirmatory factor analysis
Model χ2 (
df) RMSEA GFI CFI Model
Comparison Δχ 2 (
df)
1. Unconstrained 209.15* (100) .040 .952 .980
2. Constrained 263.20* (109) .045 .941 .972 1 vs. 2 54.06* (9)
Notes: RMSEA = Root-mean-squared error of approximation; GFI = Goodness-of-fit Index; CFI =
Comparative fit index; *p < .001
In order to test whether the three-factor solution was structurally invariant regarding the two parents, we compared the decrease of model-fit indicators between the unconstrained and constrained models. If the relative change in model-fit indicators in the constrained model is low compared to the unconstrained model, this would suggest that the same constructs are measured in the different models. Both models showed a good fit, and a comparison between the models showed no significant reduction in model fit between the unconstrained and constrained models. (For details on model comparisons see Appendix.) Thus, we chose to create six individual scale values (one value for mothers and one value for fathers for each scale), summing the values of the items included based on the constrained model.
We then tested these three scales measuring different aspects of kinship cues against criteria expected to be associated with kin-recognition. We expected kin-recognition cues to be positively associated with subjective certainty in relatedness to the parent, cooperative behaviors directed towards the parent, and inbreeding aversion (i.e., disgust felt at the thought of having sex with the parent). First, we calculated the means for each factor for all participants. In the whole sample the factors parental support (α = .873), phenotypic similarity (α = .920), and behavioral similarity (α = .898) showed high internal reliability. We then examined the distributions of the criterion variables for mothers and fathers separately.
Evolutionary Psychology – ISSN 1474-7049 – Volume 12(1). 2014. -155-
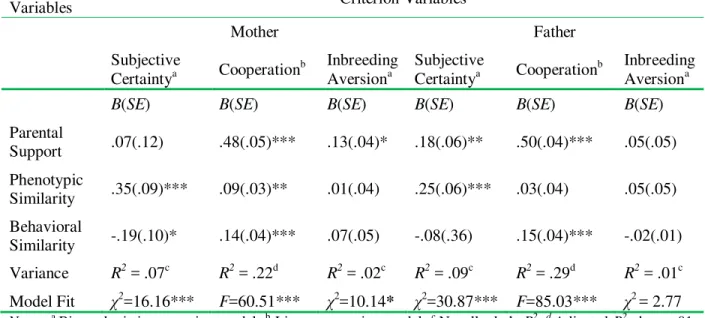
aversion to each parent) using the scale scores of parental support, phenotypic similarity, and behavioral similarity as predictors. Due to low variation in the responses concerning subjective certainty in relatedness and inbreeding aversion, we dichotomized these variables. For subjective certainty in relatedness, all responses but the anchor response 9 (“Completely certain”) were coded into one group, and the anchor response 9 into one group. For inbreeding aversion, all responses but the anchor responses 9 (“Extremely disgusting”) were coded into one group, and the anchor response 9 was coded into one group. For the dichotomized variables, we used binary logistic regression, and for cooperation, we used a linear regression. In all regression analyses, the predictor variables parental support, phenotypic similarity, and behavioral similarity were entered simultaneously. We found support for our prediction that the presence of kinship cues would be positively associated with increased subjective certainty in relatedness, cooperative behavior, and the strength of inbreeding aversion towards parents. The binary logistic regression models for cooperation with both mother and father, as well as the linear regression models for subjective certainty in relatedness to both mother and father, were significant, explaining up to almost 30% of the variation in the dependent variables. The binary logistic regression model for inbreeding aversion was, however, significant for mothers only (see Table 3).
Table 3. Six separate regression analyses with the dependent variables subjective certainty
in relatedness, cooperation, and inbreeding aversion towards mothers (for male respondents) and fathers (for female respondents), with the predictor variables parental support, phenotypic similarity, and behavioral similarity
Predictor
Variables Criterion Variables
Mother Father
Subjective
Certaintya Cooperationb Inbreeding Aversiona Subjective Certaintya Cooperationb Inbreeding Aversiona
B(SE) B(SE) B(SE) B(SE) B(SE) B(SE)
Parental
Support .07(.12) .48(.05)*** .13(.04)* .18(.06)** .50(.04)*** .05(.05) Phenotypic
Similarity .35(.09)*** .09(.03)** .01(.04) .25(.06)*** .03(.04) .05(.05) Behavioral
Similarity -.19(.10)* .14(.04)*** .07(.05) -.08(.36) .15(.04)*** -.02(.01) Variance R2 = .07c R2 = .22d R2 = .02c R2 = .09c R2 = .29d R2 = .01c Model Fit χ2=16.16***
F=60.51*** χ2=10.14* χ2=30.87*** F=85.03*** χ2 = 2.77
Discussion
In the present study, 702 participants were asked to report the availability of a number of possible cues that may have provided information about relatedness to their parents during their childhood and adolescence. A factorization of the responses suggested a three-factor solution with the factors parental support, phenotypic similarity, and behavioral similarity. The three-factor solution of the items measuring availability of kinship cues during childhood was confirmed using a confirmatory factor analysis. After choosing the four items with the highest factor loadings for each factor, we calculated individual scale values for each participant. In line with our expectations, the scale values were generally associated with subjective certainty in relatedness, cooperative behavior with both mothers and fathers and inbreeding aversion to mothers. Contrary to our prediction, the strength of inbreeding avoidance to fathers was not predicted by the reported availability of kinship cues.
More specifically, out of the 18 predictor values, 15 were in the expected positive direction. Parental support independently predicted cooperation with mothers and fathers, inbreeding aversion to mothers, and subjective certainty in relatedness with fathers. Parental support did not independently predict subjective certainty regarding relatedness to mothers and inbreeding aversion to fathers, although the associations were in the expected direction. Parental support can be understood as an indirect, contextual kinship cue, which may provide reliable information of relatedness since biological parents typically invest more effort in their children than do non-biological parents (e.g., Anderson, Kaplan, Lam, and Lancaster, 1999; Zvoch, 1999). It is, however, possible that the positive association between received parental support in childhood and cooperative behavior with parents in adulthood described more general reciprocal behavior and not specifically kin-directed behavior. However, as parental support also predicted subjective certainty in relatedness to fathers and inbreeding aversion to mothers, this supports the assumption that received parental support is a kinship cue that affects kin-directed behavior and thus may have been the object of selection.
Phenotypic similarity independently predicted subjective certainty in relatedness to mothers and fathers, cooperation, and inbreeding aversion to mothers. Phenotypic similarity did not independently predict cooperation with and inbreeding aversion to fathers, although the association again was in the expected direction. In line with a number of previous studies (e.g., Dolinska, 2013; Volk and Quinsey, 2007), phenotypic similarity was associated with cooperative behavior. Phenotypic similarity correlates with genetic similarity and is therefore a reliable indicator of kinship between two individuals. As phenotypic similarity was, in general, associated with kin-directed behavior, the results of the present study add to the assumption that phenotypic similarity plays an important role in kin-recognition. Contrary to our predictions, phenotypic similarity had a less pronounced effect on kin-directed behavior to fathers. The weak association may be due to limited variation in the responses.
Evolutionary Psychology – ISSN 1474-7049 – Volume 12(1). 2014. -157-
more alike participants were with their parents, the less certain they were regarding their relatedness to their parents. As there seems to be no available parsimonious theory to explain this effect, it is possible that this is the result of a suppressor effect, where the true effect of a predictor is observable only when other predictors are held constant.
It is important to note that there is no need for the measured cues to operate independently. Firstly, as they must be honest signals of relatedness to be the subject of selection, they are expected to be correlated in each dyad. Secondly, both phenotypic and behavioral similarity can be conceptualized as direct kin-recognition, but it should be noted that a number of the items included in the scales measured the degree to which other individuals had pointed out similarity between the focal individual and the parent. The importance of such third-party information has been illuminated earlier (e.g., Daly and Wilson, 1982; Mclain, Setters, Moulton, and Pratt, 2000). Information obtained from others could play a role in the developmental aspect of phenotype matching, where third-party information is internalized to create psychological kin templates. Unfortunately, the design of the present study does not allow for an examination of this possibility, but studies in which the availability of such third-party information is correlated with the precision in phenotype matching to other persons could potentially give valuable insight into the development of kin-templates. Moreover, as a study by Bressan and Martello (2002) showed that believing that two individuals were related increased the perceived resemblance between them, it is also possible that matching appearance and behavior between oneself and a parent is affected by the presence of prior cues about relatedness. In all, the developmental pattern of kin-recognition may be complex, and recognizing one type of kin may rely on successful recognition of other types of kin. For instance, the effect of maternal perinatal association (Lieberman, Tooby, and Cosmides, 2007) necessitates that this female has been reliably identified as a related individual. These examples underline the importance of understanding the kin-recognition used by children to identify their parents.
Kin selection does not necessitate a subjective belief in relatedness between two individuals. However, a number of studies, primarily on fathers (e.g., Alvergne, Faurie, and Raymond, 2009, 2010), have shown that the subjective belief about certainty predicts kin-directed behavior. Yet, it is possible that not all of the association between kinship cues and behavior is mediated consciously. Examining our regression analyses, the measured kinship cues explained more of the variance in cooperation than in subjective belief about relatedness. This suggests that at least some of the effect of kin-recognition may operate without conscious mediation. More studies are however needed to properly investigate this possibility.
the strength of the observed associations. A final concern is that in measuring inbreeding aversion, we relied on reactions to third-person descriptions of incest. Such descriptions have been used in a number of earlier studies (e.g., Antfolk et al., 2012; Fessler and Navarrete, 2004; Lieberman, Tooby, and Cosmides, 2003; Royzman, Leeman, and Sabini, 2008) under the assumption that they are analogous to first-person measurements. Yet, a recent study (Antfolk, Lieberman, Albrecht, and Santtila, submitted) showed that third-person measurements are less sensitive to fertility variations across the menstrual cycle than are first-person measurements. As this study suggests that the assumption of analogy between first- and third-person measurements of inbreeding aversion does not hold under all circumstances, this limits the generalization of the results to first-person inbreeding aversion. Furthermore, as parent-child incest is perceived as more aversive than sibling incest (Antfolk et al., 2012), the variation in responses to third-person measurements was also low, limiting statistical power. Lastly, regarding the measurement of inbreeding aversion, the wording employed in the third-person description was “someone with their
mother/father.” This formulation allowed participants to freely imagine this “someone” as
either female or male, creating a situation either concordant or not with their own sexual preference. It is possible that in a number of cases participants may have imagined situations that did not apply perfectly to their own sexual preference.
Bearing these limitations in mind, we point out that children’s kin-recognition of their parents is hitherto a somewhat understudied and neglected area of research. The present study is an attempt to examine the association between self-reported availability of indirect, contextual (i.e., parental support), and direct cues (i.e., phenotypic and behavioral similarity) that, during the course of human evolution, may have provided reliable information of relatedness and kin-directed behaviors. To further investigate the effect of the kinship cues measured in the present study, studies using other samples (e.g., adopted or foster children) and/or other validation criteria (e.g., behavioral measures of cooperative or altruistic behavior) would provide additional knowledge in the area.
Acknowledgements: This study was founded by the Academy of Finland (260298). The
first and third authors also received funding from the MiKADO project, funded by the German Federal Ministry of Family Affairs, Senior Citizens, Women and Youth. We thank the anonymous reviewers, whose suggestions helped to improve the manuscript.
Received 24 June 2013; First revision submitted 08 October 2013; Second revision submitted 12 November 2013; Accepted 03 December 2013.
References
Ackerman, J. M., Kenrick, D. T, and Schaller, M. (2007). Is friendship akin to kinship?
Evolution and Human Behavior,28, 365-374.
Alvergne, A., Faurie, C., and Raymond, M. (2007). Differential facial resemblance of young children to their parents: Who do children look like more? Evolution and
Human Behavior,28, 135-144.
Evolutionary Psychology – ISSN 1474-7049 – Volume 12(1). 2014. -159-
paternal investment in humans. Animal Behaviour,78, 61-69.
Alvergne, A., Faurie, C., and Raymond, M. (2010). Are parents’ perceptions of offspring facial resemblance consistent with actual resemblance? Effects on parental investment. Evolution and Human Behavior,31, 7-15.
Anderson, K. G., Kaplan, H., Lam, D., and Lancaster, J. (1999). Paternal care by genetic fathers and stepfathers II: Reports by Xhosa high school students. Evolution and
Human Behavior,451, 433-451.
Antfolk, J., Karlsson, M., Bäckström, A., and Santtila, P. (2012). Disgust elicited by third-party incest: The roles of biological relatedness, co-residence, and family relationship. Evolution and Human Behavior,33, 217-223.
Antfolk, J., Lieberman, D., and Santtila, P. (2012). Fitness costs predict inbreeding aversion irrespective of self-involvement: Support for hypotheses derived from evolutionary theory. PLoS ONE,7, e50613.
Antfolk, J., Lieberman, D., Albrecht A., and Santtila, P. (2014). The effect of fertility status on inbreeding aversion: Disgust is more increased when reading first- than
third-party descriptions. Manuscript submitted for publication.
Antfolk, J., Marcinkowska, U. M., Lieberman, D., and Santtila, P. (2014). The role of disgust in evaluating the behavior of others: Support for egocentric empathy in
reactions to third-party incest. Manuscript submitted for publication.
Bentler, P. M. (1990). Comparative fit indexes in structural models. Psychological Bulletin, 107, 238-246.
Bevc, I., and Silverman, I. (1993). Early proximity and intimacy between siblings and incestuous behavior: A test of the Westermarck Hypothesis. Ethology and
Sociobiology, 14, 171-181.
Bowlby, J. (1969). Attachment and loss: Attachment. New York: Basic.
Bressan, P., and Martello, M. F. D. (2002). Perceived resemblance and the belief in genetic relatedness. Psychological Science, 13, 213-218.
Browne, M. W., and Cudeck, R. (1993). Alternative ways of assessing model fit. In K. A. Bollen and J. S. Long (Eds.), Testing structural equation models (pp. 136-162).
Beverly Hills, CA: Sage.
Cernoch, J. M., and Porter, R. H. (1985). Recognition of maternal axillary odors by infants.
Child Development,56, 1593-1598.
Cheung, G. W., and Rensvold, R. B. (2002). Evaluating goodness-of-fit indexes for testing measurement invariances. Structural Equation Modeling, 9, 233-255.
Daly, M., and Wilson, M. (1988). Homicide. Hawthorne, NY: Aldine de Gruyter.
Daly, M., and Wilson, M. I. (1982). Whom are newborn babies said to resemble? Ethology
and Sociobiology,3, 69-78.
DeBruine, L. M. (2004). Resemblance to self increases the appeal of child faces to both men and women. Evolution and Human Behavior,25, 142-154.
DeBruine, L. M. (2005). Trustworthy but not lust-worthy: Context-specific effects of facial resemblance. Proceedings of the Royal Society B, Biological Sciences, 272,
919-922.
attributions, to self-resembling opposite-sex faces. Proceedings of the National
Academy of Science, 108, 11710-11714.
Dolinska, B. (2013). Resemblance and investment in children. International Journal of
Psychology,48, 285-290.
Dubas, J. S., Heijkoop, M., and van Aken, M. A. G. (2009). A Preliminary investigation of parent – progeny olfactory recognition and parental Investment. Human Nature,20,
80-92.
Fessler, D. M. T., and Navarrete, C. D. (2004). Third-party attitudes toward sibling incest: Evidence for Westermarck’s hypotheses. Evolution and Human Behavior, 25,
277-294.
Grafen, A. (1985). A geometric view of relatedness. In R. Dawkins and M. Ridley (Eds.),
Oxford Surveys in Evolutionary Biology, Vol. 2 (pp. 28-90). Oxford: Oxford
University Press.
Hamilton, W. D. (1964). The genetical evolution of social behaviour I. Journal of
Theoretical Biology, 7, 1-16.
Hu, L., and Bentler, P. M. (1999). Cutoff criteria for fit indexes in covariance structure analysis: Conventional criteria versus new alternatives. Structural Equation
Modeling: A Multidisciplinary Journal,6, 1-55.
Krupp, D. B., DeBruine, L. M., and Jones, B. C. (2011). Cooperation and conflict in the light of kin recognition systems. In C. Salmon and T. K. Shackelford (Eds.), The
Oxford Handbook of Evolutionary Family Psychology (pp. 345-362). New York:
Oxford University Press.
Lieberman, D., and Lobel, T. (2011). Kinship on the Kibbutz: Coresidence duration predicts altruism, personal sexual aversions and moral attitudes among communally reared peers. Evolution and Human Behavior, 33, 26-34.
Lieberman, D., Tooby, J., and Cosmides, L. (2003). Does morality have a biological basis? An empirical test of the factors governing moral sentiments relating to incest.
Proceedings of the Royal Society B, Biological Sciences, 270, 819-26.
Lieberman, D., Tooby, J., and Cosmides, L. (2007). The architecture of human kin detection. Nature, 445, 727-731.
Little, T. D. (2013). Longitudinal structural equation modeling. New York: The Guilford
Press.
Marcinkowska, U. M., and Rantala, M. J. (2012). Sexual imprinting on facial traits of opposite-sex parents in humans. Evolutionary Psychology,10, 621-630.
Marcinkowska, U. M., Moore, F. R., and Rantala, M. J. (2013). An experimental test of the Westermarck effect: Sex differences in inbreeding avoidance. Behavioral Ecology, 24, 842-845.
Mclain, D. K., Setters, D., Moulton, M. P., and Pratt, A. E. (2000). Ascription of resemblance of newborns by parents and nonrelatives. Evolution and Human
Behavior, 21, 11-23.
Penn, D. J., and Frommen, J. G. (2010). Kin recognition: An overview of conceptual issues, mechanisms and evolutionary theory. In P. Kappeler (Ed.), Animal
Behaviour: Evolution and Mechanisms (pp. 55-85). Heidelberg: Springer.
Evolutionary Psychology – ISSN 1474-7049 – Volume 12(1). 2014. -161-
Reactions to children’s faces: Resemblance affects males more than females.
Evolution and Human Behavior,23, 159-166.
Platek, S. M., Critton, S. R., Burch, R. L., Frederick, D. A., Myers, T. E., and Gallup Jr, G. G. (2003). How much paternal resemblance is enough? Sex differences in hypothetical investment decisions but not in the detection of resemblance. Evolution
and Human Behavior,24, 81-87.
Qirko, H. N. (2011). Fictive kinship and induced altruism. In C. Salmon and T. K. Shackelford (Eds.), The Oxford Handbook of Evolutionary Family Psychology (pp.
310-328). New York: Oxford University Press.
Royzman, E. B., Leeman, R. F., and Sabini, J. (2008). “You make me sick”: Moral
dyspepsia as a reaction to third-party sibling incest. Motivation and Emotion, 32,
100-108.
Sariola, H., and Uutela, A. (1996). The prevalence and context of incest abuse in Finland.
Child Abuse and Neglect, 20, 843-50.
Spiro, M. F. (1958). Children of the Kibbutz. Cambridge: Harvard University Press.
Tooley, G., Karakis, M., Stokes, M., and Ozanne-Smith, J. (2006). Generalizing the Cinderella Effect to unintentional childhood fatalities. Evolution and Human
Behavior, 27, 224-230.
Volk, A. A., and Quinsey, V. L. (2007). Parental investment and resemblance: Replications, refinements, and revisions. Evolutionary Psychology,5, 1-14.
Weisfeld, G., Czilli, T., Phillips, K. A., Gall, J. A., and Lichtman, C. M. (2003). Possible olfaction-based mechanisms in human kin recognition and inbreeding avoidance.
Journal of Experimental Child Psychology, 85, 279-295.
West, S. A., El Mouden, C., and Gardner, A. (2011). Sixteen common misconceptions about the evolution of cooperation in humans. Evolution and Human Behavior, 32,
231-262.
West, S. A., Griffin, A. S., and Gardner, A. (2007). Social semantics: Altruism, cooperation, mutualism, strong reciprocity and group selection. Journal of
Evolutionary Biology,20, 415-432.
West, S. G., Finch, J. F., and Curran, P. J. (1995). Structural equation models with non-normal variables: Problems and Remedies. In R. H. Hoyle (Ed.), Structural
Equation Modeling (Vol. 9) (pp.56-75). Thousand Oaks CA: Sage Publications.
Westermarck, E. (1891). The history of human marriage. London: Macmillan.
Wolf, A. P. (1970). Childhood association and sexual attraction: A further test of the Westermarck hypothesis. American Anthropologist,72, 503-515.
Appendix
Scale construction details
Factor loadings and internal reliability. For the parental support scale, all four
items had factor loadings above .763 and the scale had high internal reliability (α = .876). For the phenotypic similarity scale, all four items had factor loadings above .814 and had high internal reliability (α = .919). For the behavioral similarity scale, all four items had factor loadings above .749 and had high internal reliability (α = .903). A separate factor analysis for each parent showed that, regarding both mothers and fathers, the four items for each scale showed adequate factor loadings and had moderate to high internal reliability. For parental support, all items had a factor loading > .611 (α = .842) regarding mothers. For phenotypic similarity, all items had a factor loading > .721 (α = .857), and for behavioral similarity, all items had a factor loading > .703 (α = .893) regarding mothers. Regarding fathers, all parental support items had factor loadings > .727 (α = .868), all phenotypic similarity items had factor loadings > .845 (α = .933), and all behavioral similarity items had factor loadings > .697 (α = .912).
Model fit indicators and model comparison. Browne and Cudeck (1993) suggested
that values of the RMSEA of .05 or less indicate a close fit. The CFI (Bentler, 1990) ranges from .00 (poor fit) to 1.00 (perfect fit), and a value above .95 has been suggested as a criterion for adequate fit (Hu and Bentler, 1999). In the constrained model, we further allowed the error variance between two items (42:“How much have your other parent’s relatives said that you and your parent resemble each other regarding looks?”, and 23:“How much have your other parent’s relatives said that you and your parent resemble each other
regarding behavior?”) to co-vary. The error variance of these two items may have correlated due to them having the same informational source, provided by the relatives of the other parent regarding the parent in question.
Evolutionary Psychology – ISSN 1474-7049 – Volume 12(1). 2014. -163- Table 4. Means, standard deviations, and intercorrelations of the criterion variables
subjective certainty in relatedness, cooperation, and inbreeding aversion toward mothers and fathers
Scale M (SD) Intercorrelations (n)
Mothers
1. Subjective Certainty 1.05 (.36) 1
2. Cooperation 5.79 (2.00) .067 (628)† 1
3. Inbreeding Aversion 8.14 (1.58) .098 (616)* .204 (625)*** 1 Fathers
1. Subjective Certainty 1.21 (.91) 1
2. Cooperation 4.24 (2.05) .005 (590) 1
3. Inbreeding Aversion 8.39 (1.43) .095 (581)* .076 (597)† 1
Notes: The anchors for each variable were 9 (“Not at all certain”) and 9 (“Completely certain”) for Subjective
Certainty in Relatedness, 1 (“Not at all”) and 9 (“Daily”) for Cooperation, and 1 (“Not at all”) and 9 (“Extremely”) for Inbreeding Aversion; † p < .01; * p < .05; ** p < .01; *** p < .001
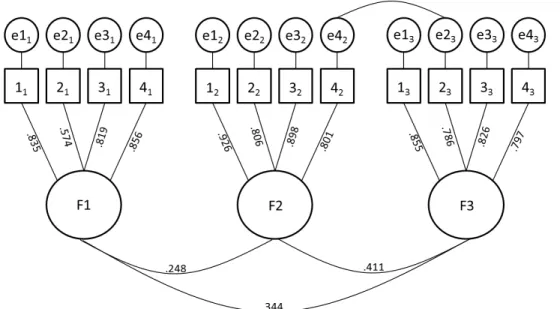
Figure 1. Factor loadings in the constrained model; Factor loadings of each item for the
factors parental support (F1), phenotypic similarity (F2), and behavioral similarity (F3)
Notes: The two items 42 and 23 were allowed to co-vary; For descriptions of items 11 – 43,
see Table 1
Table 5. Three factor solution of the items measuring kinship cues used by children to
identify their parents
Item
Factor Parental
Support
Phenotypic resemblance
Behavioral resemblance How much have your parent’s relatives
said you and your parent resemble each
other regarding looks? .026 .920 -.028
How much do you resemble your parent
regarding looks? -.031 .881 -.079
How much have non-relatives said you and your parent resemble each other
regarding looks? .000 .862 .012
How much have your other parent’s relatives said that you and your parent
resemble each other regarding looks? -.048 .814 .093 How much has your parent said you
resemble each other regarding looks? .083 .774 .039 How much has your other parent said
that you and your parent resemble each other regarding looks?
-.091 .741 .170
How much did your parent talk to you
when you were a child? .847 -.025 .025
How aware was your parents of where you spent your time and what you did with your friends when you were a child?
.800 -.029 -.049
Did your parent praise you when you did something well when you were a
child? .770
-.069 .048
How much physical closeness did your parent offer you as a child? (In type of
hugs, playing physically etc.) .763 -.020 .019
How much time did your parent spend together with you and others (e.g. siblings or other adults) when you were a child?
Evolutionary Psychology – ISSN 1474-7049 – Volume 12(1). 2014. -165-
How much did your parent support you
regarding school/education? .736 -.007 .071
How much time a week did your parent spend with you alone when you were a child?
.694 .046 .001
Did your parent encourage you to do
homework when you were a child? .680 -.064 .079
How much did your parent read for you
as a child? .670 .025 .004
How often did your parent cook food for
you? .637 -.003 -.148
Have you heard your parent telling stories about your time together from before you were 4 years old?
.614 .126 .064
How often have you felt that your parent
ignored you or your needs? .586 -.061 .080
Have you seen pictures of you and your parent from when you were under 4
years old? .549 .136 .003
How often did your parent attend family
dinners? .526 -.098 -.040
Did your parent put up boundaries and
limitations for you as a child? .517 -.039 .042
How much has your parent supported you economically? (e.g. bought clothes,
given allowance) .421 .010 .034
Have you heard your other parent telling stories about you and your parent time together from before you were 4 years old?
.365 .075 .194
How many hours a week day did your mother work when you were a child
(including business trips)? .264 .073 -.255
Have you seen films of you and your parent from when you were under 4
How much did your parent reprimand/scold you when you were a
child? .169 .013 .021
How much have your parent’s relatives said you and your parent resemble each
other regarding behavior? .080 .109 .822
How much have your other parent’s relatives said that you and your parent
resemble each other regarding behavior? .012 .105 .820 How much have non-relatives said that
you and your parent resemble each other
regarding behavior? .055 .069 .780
How much has your other parent said that you and your parent resemble each other regarding behavior?
.039 .041 .749
How much has your parent said that you
resemble each other regarding behavior? .217 .077 .666 How much do you resemble your parent
regarding looks? .152 .077 .562