1. Especialista; Fisioterapeuta.
2. Doutor, Fisioterapeuta; Professor Adjunto. 3. Doutor, Professor Titular.
Trabalho realizado na Universidade Federal de São Paulo, São Paulo, SP, Brasil.
Fernando de Souza BOTEGA1,Gerson CIPRIANO JUNIOR2, Francisco Valdez Santos de Oliveira LIMA1,Ross ARENA3,José Honório Palma da FONSECA3,Luis Roberto GEROLA3
RBCCV 44205-1224
Comportamento cardiovascular durante a reabilitação após cirurgia de revascularização do miocárdio
Cardiovascular behavior during rehabilitation after
coronary artery bypass grafting
Endereço para correspondência: Francisco Valdez Santos de Oliveira Lima
Rua Napoleão de Barros, 715, 3º andar - São Paulo, SP Brazil – CEP: 04023-002
E-mail: [email protected]
Artigo recebido em 21 de maio de 2010 Artigo aprovado em 31 de agosto de 2010 Resumo
Objetivo: O objetivo do presente estudo foi avaliar o
comportamento das variáveis cardiovasculares durante um programa de reabilitação cardiovascular hospitalar em pacientes submetidos à cirurgia de revascularização do miocárdio.
Métodos: Um total de 14 pacientes (idade média: 55,4 ±
6,4 anos, 78,6% do sexo masculino) participaram do estudo, todos apresentavam diagnóstico prévio de insuficiência coronariana e indicação de cirurgia eletiva. O protocolo consistiu de um grupo de exercícios de baixo impacto (2-3 METs) para extremidade superior e inferior e exercícios de caminhada realizados no pré e pós-operatório (3 e 4 dias). As seguintes variáveis foram avaliadas em repouso e após o programa de exercício: frequência cardíaca (FC, bpm), pressão arterial sistólica (PAS, mmHg), pressão arterial diastólica (PAD, mmHg), pressão arterial média (MAP, mmHg), duplo produto (DPr, bpm/mmHg) e escala de Índice de Percepção de Esforço (IPE).
Resultados: Houve aumento significativo da FC e DPr na
análise individual (P <0,001), bem como na análise entre os dias de avaliação (P <0,001 para FC e P <0,05 para DPr), mas apenas atingindo valores máximos que foram < 30% do previsto. Além disso, ocorreu correlação negativa entre a escala IPE e SAP e MAP.
Conclusão: Os exercícios propostos mostraram-se seguros
com a mudança de variáveis fisiológicas fundamentais em todo o experimento abaixo do valor recomendado para a fase de hospitalização. Além disso, a escala percepção de esforço parece ter correlação com algumas variáveis hemodinâmicas e, portanto, pode ser uma ferramenta útil para este grupo de pacientes.
Descritores: Exercício. Procedimentos cirúrgicos
cardiovasculares. Descondicionamento cardiovascular.
Abstract
Objective: The aim of the present study was to assess the
behavior of cardiovascular variables during an in-hospital cardiovascular rehabilitation program in patients following myocardial revascularization surgery.
Methods: A total of 14 patients (mean age: 55.4 ± 6.4
INTRODUCTION
Myocardial revascularization surgery is known to be an effective option in the treatment of patients with ischemic heart disease. However, inherent factors to the procedure, such as anesthesia, hypothermia, cardioplegia and peri-aortic sympathetic lesions, potentially lead to cardiovascular dysfunction in the postoperative period [1].Specifically, modulation of the autonomic nervous system, producing an abnormal increase in heart rate (HR), myocardial oxygen consumption and blood pressure (BP), may augment the sensation of exertion during physical activities performed during the early phase of recovery [2-10].
In recent years, cardiovascular and metabolic rehabilitation programs with a focus on low-intensity physical exercises initiated in the hospitalization phase have had a positive impact on the reestablishment of cardiopulmonary conditioning, thereby preventing deleterious effects of immobility [11]. Such programs include a group of daily exercises for which the degree of intensity is determined based on estimated energy expenditure. The autonomic nervous systems response to exercise is manifested by a combined increase in sympathetic activity and a reduction in parasympathetic activity, leading to an increase in HR and BP. The normalcy of this response is dependent upon the integrity of the cardiovascular self-regulation system.
It therefore seems useful and relevant to gain a better understanding of the cardiovascular responses to physical exertion in the early phase of rehabilitation and determine appropriate monitoring methodology. Among the forms of monitoring exertion, the Rating of Perceived Exertion (RPE) scale has been widely used in apparently healthy individuals as well as heart rehabilitation programs, although preferentially in later outpatient phases of rehabilitation [12-17].However, there is limited research on the applicability
and correlation of the RPE scale with clinical variables and cardiovascular status during the inpatient phase of cardiovascular rehabilitation. Furthermore, the lack of studies assessing cardiovascular behavior during different low-impact exercises in this phase raise questions regarding the degree of safety and effectiveness of such protocols as well as their contribution toward a greater susceptibility to the emergence of cardiovascular complications.
The aim of the present study was to analyze the behavior of cardiovascular variables during the performance of low-intensity exercises in order to determine possible abnormalities that may indicate increased cardiovascular risk. A further aim was to assess the correlation between the RPE scale and clinical cardiovascular variables. Our group hypothesizes that: 1) Such an exercise program will illicit an acceptable physiologic response that does not unduly increase complication risk and 2) The RPE scale will be significantly correlated with key physiologic variables of interest, supporting its use for patient monitoring.
METHODS
Subjects
Fourteen patients (mean age: 55.4 ± 6.4 years, 78.6% male) with diagnosis of coronary insufficiency and indication for elective myocardial revascularization surgery participated in the present investigation. The study was carried out at the Cardiovascular Surgery Unit of the Federal University of São Paulo (Brazil) and the protocol received approval from the Ethics Committee of this same institution. All subjects completed a written informed consent prior to study initiation. Individuals under 40 years or over 75 years of age, those with complications in the preoperative and postoperative periods, those with an ejection fraction less than or equal to 50% and those with a pacemaker were excluded from the study.
bpm); systolic arterial pressure (SAP, mmHg); diastolic arterial pressure (DAP, mmHg); mean arterial pressure (MAP, mmHg); double product (DPr, bpm/mmHg); and the Rating of Perceived Exertion (RPE) scale.
Results: There was a significant increase in HR and DPr
in the individual analysis (P<0.001) as well as in between days (P<0.001 for HR and P<0.05 for DPr), but only attaining maximal values that were < 30% of predicted. Moreover, a negative correlation was found between the RPE scale and both SAP and MAP.
Conclusion: The exercises proposed proved to be safe
with the change in key physiologic variables throughout the experiment below recommended values for the hospitalization phase. Furthermore, the RPE scale appears to have a correlation with some hemodynamic variables and thus may be a useful tool for this group of patients.
Descriptors: Exercise. Cardiovascular surgical procedures.
Protocol
Study variables
Heart rate (HR, bpm) was monitored continuously throughout the experiment, using an S810i model heart frequency meter (Polar TM®, Kempele, Finland). Blood pressure (BP, mmHg) was determined with a Durashock DS44 sphygmomanometer (Welch Allyn Tycos®, Skaneateles Falls, NY, USA) and measured in each position prior to adopting a new posture as well as prior to and following each exercise d. Double product (DPr, bpm/ mmHg) values were determined simultaneous with blood pressure recordings [18]. The RPE scale was ascertained at the completion of each exercise [16]. Pulse oximetry was determined continuously using an Onix 9500 oximeter (Nonin Medical, Plymouth, MN, USA). A demonstrated difficulty in understanding the RPE scale served as an exclusion criterion. If a subject presented with a SpO2 below 92%, supplementary oxygen delivered via a nasal O2 catheter with a maximal flow of 4 l/min, adjusted to maintain values over 92%.
Preparation
The patients were initially submitted to a preoperative evaluation, with the recording of the following parameters: heart rate (HR, bpm); blood pressure (BP, mmHg); Rating of Perceived Exertion (RPE) scale; double product (DPr, bpm/mmHg); and pulse oximetry (SpO2,%). The same variables were determined again on Days 3 and 4 of the postoperative period. Prior to the exercises, the patients remained at rest for ten minutes – five minutes lying on their backs with the trunk at a 30-degree inclination and five minutes in a sitting position, with support for the upper and lower limbs.
Low-impact exercise protocol
Following the resting period, the exercises were initiated, using activities with an estimated expenditure of two to three metabolic equivalents (METs) on Day 3 of the postoperative period. The exercise protocol was carried out in the following sequence:
• Patient sitting on the table, with support for the feet: a series of ten repetitions of flexion-extension of alternating shoulders;
• Patient sitting on the table, with support for the arms: a series of ten repetitions of flexion-extension of alternating knees;
• Walking 35 meters.
There was a one-minute interval between each exercise. After the exercises, the patient remained at rest, with support for the upper and lower limbs for six minutes. The total time to complete the data collection session was 20 minutes, including initial rest period, exercises and recovery. The values recorded after five minutes of sitting at rest, after
each exercise (upper limb, lower limbs and walking) and the first six minutes of recovery were considered for the statistical analysis, totaling 10 measurements (Figure 1). As a safety measure, the exercises would be interrupted at any moment in the occurrence of signs and symptoms compatible with intolerance to exercise, such as muscle fatigue, dyspnea, cyanosis, paleness, nausea, increase in HR 20 bpm above baseline value and systolic arterial hypotension, with a drop equal to or greater than 15 mmHg. Throughout the hospitalization period, the patients maintained conventional physiotherapy, in accordance with physical activity guidelines put forth by the American Association of Cardiovascular and Pulmonary Rehabilitation (AACVPR).
Fig. 1 - A: Behavior of tendency curves for HR and DPr; B: Analysis of units of area under the tendency curves for HR and DPr. Abbreviations: HR = heart rate; DPr = double product; Preop = preoperative period; PO = postoperative period; U.A = unit of area; Upper = upper limbs; Lower = lower limbs; Walking = walking exercise; Rec = minute of recovery; *** P<0.001 in relation to preoperative period, with ANOVA and Newman-Keuls post hoc test
Statistical methods
Continuous data were initially compared with a Gaussian curve by the Kolmogorov-Smirnov distance test. When classified as parametric, these data were represented by mean and standard deviation values. Data were compared over time by analysis of variance (ANOVA) for repeated measurements, with the Student-Newman-Keuls post-hoc test for more than two times. When classified as non-parametric, the data were represented by median and percentile values. Data were compared over time using the Friedman test, with the Muller–Dunn post-hoc text for more than two times. Categorical variables were represented by absolute frequency (n) and relative frequency (%). Spearman’s correlation coefficient was used for the analysis of the correlation between the RPE scale and cardiovascular variables.
RESULTS
Bypass (CPB), number of grafts used and previous degree of physical activity, with baseline characteristics listed in Table 1. A majority of the subjects included in the present investigation were male while 50% received extracorporeal circulation. Mean BMI level was within the upper range for defining normal weight. The majority of subjects reported a low level physical activity patterns prior to surgery.
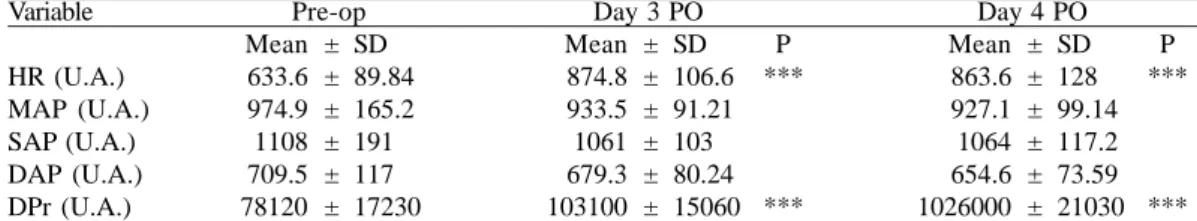
For the longitudinal analysis of the cardiovascular variables, the variation in the areas under the curve, that is an alternative geometric area analyses to determine the comprehensive cardiovascular behavior throughout the experiment (Figure 1). Table 2 displays the mean and standard deviation values of these areas (in units of area), for which significantly higher HR and DPr values were observed on Days 3 and 4 in the postoperative period in comparison to the preoperative period (P< 0.001), but there were no differences between the postoperative days (Table 2 and Figure 1). No statistically significant differences were found in the behavior of the SAP, DAP and MAP curves.
In the cross-sectional analysis (between days) of the cardiovascular variables, HR and DPr values underwent a significant increase during the exercise program (P<0.001 and P<0.05, respectively) in comparison to resting and recovery values. SAP exhibited a change in values during the exercises only on Day 3 of the postoperative period (Table 3). DAP and MAP underwent no significant alterations in the evaluation times.
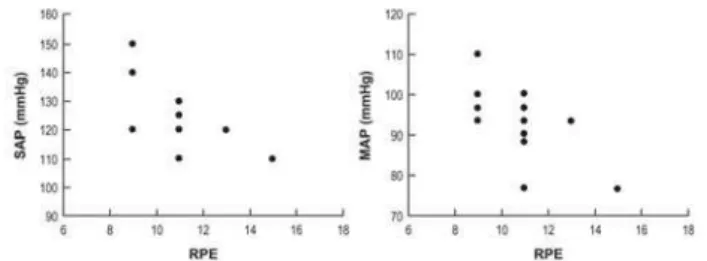
There was an increase in RPE scale values during each of the exercises from the preoperative period to Day 3 of the postoperative period (P>0.05), returning to preoperative values on Day 4 (Table 3). In the analysis of the correlation between the RPE scale and the clinical variables, there was a negative correlation with SAP and MAP (r>0.6) on Day 3
of the postoperative period after the ambulatory portion of the exercise assessment (Figure 2). No correlations were found between the RPE scale and the other variables, regardless of the exercise performed.
Interruption of any exercise due to signs or symptoms of intolerance was not necessary for any of the subjects. All patients maintained SpO2 levels equal to or above 92% throughout the entire study period.
Table 1. Initial characteristics of the patients in the preoperative period for myocardial revascularization submitted to an exercise protocol with a maximal consumption of 2 to 3 METs. Characteristics Weight (K) Height (m) Age (years) BMI (kg/m2) EF (%) ECC Gender
Degree of activity
Grafts With Without Male Female Low Medium Median 2 Mean 64.64 1.61 55.43 24.91 (n) 7 7 11 3 12 2 ± ± ± ± ± >50% SD 12.48 0.77 7.63 3.73 (%) (50) (50) (78.57) (21.43) (85.71) (14.29) (25% - 75%) (1.25 - 3)
Abbreviation: BMI = body mass index; ECC = extracorporeal
circulation; continuous parametric data expressed as mean ± standard deviation; non-parametric data expressed as median and percentile; categorical or continuous data expressed in N
Table 2. Longitudinal mean and standard deviation values of units of area under the curve of cardiovascular variables; comparison between pre-operative period, Day 3 and Day 4 in the postoperative period. Variable HR (U.A.) MAP (U.A.) SAP (U.A.) DAP (U.A.) DPr (U.A.) Mean 633.6 974.9 1108 709.5 78120 ± ± ± ± ± ± SD 89.84 165.2 191 117 17230 Pre-op Mean 874.8 933.5 1061 679.3 103100 ± ± ± ± ± ± SD 106.6 91.21 103 80.24 15060 Day 3 PO
P *** *** Mean 863.6 927.1 1064 654.6 1026000 ± ± ± ± ± ± SD 128 99.14 117.2 73.59 21030 Day 4 PO
P ***
***
DISCUSSION
The present study demonstrated that the Rating of Perceived Exertion scale may be negatively correlated to clinical variables, such as SAP and MAP, during the hospitalization phase of cardiovascular rehabilitation. Moreover, the proposed exercise program proved safe from the cardiovascular standpoint in all periods, thereby
Table 3. Cross-sectional mean and standard deviation values of cardiovascular variables; median and percentile values for Rating of Perceived Exertion Scale; comparison between rest, upper limb exercise, lower limb exercise, walking and recovery
Variable HR(bpm) MAP(mmHg) SAP(mmHg) DAP(mmHg) DPr(bpm/mmHg) RPE Periods Pre-op Day 3 PO Day 4 PO Pre-op Day 3 PO Day 4 PO Pre-op Day 3 PO Day 4 PO Pre-op Day 3 PO Day 4 PO Pre-op Day 3 PO Day 4 PO Pre-op Day 3 PO Day 4 PO
Rest 64.6 ± 9.66 93.1 ± 10.12 90.9 ± 12.94 92.3 ± 14.97 89.2 ± 8.21 88.3 ± 10.13 122.9 ± 21.21 118.2 ± 11.87 118.6 ± 15.5 77.0 ± 12.27 74.6 ± 7.46 73.2 ± 8.23 7979.9 ± 1904 10996.4 ± 1539 10826.0 ± 2330
*** *** *** ** *** ** ***
Upper limb exercise 73.2 ± 10.64 100.14 ± 13.72
98.93 ± 14.01 93.93 ± 16.69 91.55 ± 8.51 89.52 ± 9.57 124.64 ± 22.74
122.5 ± 9.95 121.43 ± 13.36
78.57 ± 14.06 76.07 ± 9.44 73.57 ± 8.42 9144.64 ± 2178.68 12271.43 ± 1970.81 12077.86 ± 2427.94
9 (7.5-9) 11 † (9-11.5)
9 (9-11)
Lower limb exercise 75.14 ± 9.08 100.64 ± 13.82
99.36 ± 15.43 95.71 ± 15.67 91.43 ± 9.08 89.4 ± 9.73 125 ± 22.27 122.14 ± 11.55 121.79 ± 13.81 81.07 ± 12.12
76.07 ± 9.03 73.21 ± 8.68 9407.14 ± 2041.7 12272.5 ± 1882.7 12185.4 ± 2680.2
9 (9-9) 11 † (9-11)
9 (9-10)
Walking exercise 81.3 ± 10.92 104.9 ± 14.77 102.0 ± 16.55 95.71 ± 15.67
92.7 ± 8.79 90.1 ± 10.39 125.7 ± 22.52 124.6 ± 11.68 121.8 ± 14.89 80.7 ± 12.69 76.8 ± 8.9 74.3 ± 9.17 10185.7 ± 2061 13095.0 ± 2263 12506.4 ± 2862
9.0 (9-10) 11.0 † (9-11)
9.0 (9-10.5)
Recovery 67.4 ± 10.1 94.9 ± 10.64 94.3 ± 13.45 92.26 ± 16.94
88.8 ± 10.01 88.0 ± 8.8 122.5 ± 50 116.4 ± 12.16 117.5 ± 12.67 77.1 ± 14.9 75.0 ± 9.61 73.2 ± 7.75 8245.4 ± 1860 11023.6 ± 1527 11128.9 ± 2201
*** *** *** ** *** ** ***
Abbreviation: HR, heart rate; MAP, mean arterial pressure, SAP, systolic arterial pressure; DAP, diastolic arterial pressure; DPr: double product; Pre-op, Preoperative period; PO, postoperative period; ns, non-significant; continuous parametric data expressed as mean ± standard deviation;*** P<0.001 ; ** P<0.01 with ANOVA and Newman-Keuls post hoc test (HR, MAP, SAP, DAP and DPr); non-parametric data expresses as median (50%) and percentiles (25%-75%); † P<0.05 (in relation to preoperative period) with Friedmam test and Dunn’s post hoc test (Borg)
Fig. 2 - Correlation of Rating of Perceived Exertion Scale and A-SAP; B- MAP on Day 3 of the postoperative period after performing the walking exercise. Abbreviations: SAP = systolic arterial pressure; MAP = mean arterial pressure; PO = postoperative period; r = Spearman’s correlation coefficient
underlining the importance of these variables in daily practice, which can effectively demonstrate hemodynamic behavior in this group of patients.
In the analysis performed over time (longitudinal analysis), there were higher HR values in the postoperative period, likely due to parasympathetic suppression and a higher prevalence of sympathetic activity [2,4,5]. On the other hand, the lack of a change in pressure behavior throughout the entire study period corroborates previous findings that demonstrate a maintenance of the integrity of the vascular control of BP, which is a multi-factorial phenomenon that is dependent upon cardiac blood volume, cardiac output, and thermoregulating mechanisms, among other aspects [3,5,10]. Moreover, we could attribute the increase in DPr in the postoperative period to the isolated influence of the variation in HR, as SAP values remained unchanged throughout the study period.
REFERENCES
1. Murphy DA, Armour JA, Influences of cardiopulmonary bypass, temperature, cardioplegia, and topical hypothermia on cardiac innervation. J Thorac Cardiovasc Surg. 1992;103(6):1192-9.
2. Soares PP, Moreno AM, Cravo SL, Nóbrega AC. Coronary artery bypass surgery and longitudinal evaluation of the autonomic cardiovascular function. Crit Care. 2005;9(2):124-31.
3. Niemela MJ, Airaksinen KE, Tahvanainen KU, Linnaluoto MK, Takkunen JT. Effect of coronary artery bypass grafting on cardiac parasympathetic nervous function. Eur Heart J. 1992;13(7):932-5.
4. Kuo CD, Chen GY, Lai ST, Wang YY, Shih CC, Wang JH. Sequential changes in heart rate variability after coronary artery bypass grafting. Am J Cardiol. 1999;83(5):776-9.
5. Souza Neto EP, Loufouat J, Saroul C, Paultre C, Chiari P, Lehot JJ, et al. Blood pressure and heart rate variability changes during cardiac surgery with cardiopulmonary bypass. Fundam Clin Pharmacol. 2004;18(3):387-96.
6. Kirkeby-Garstad I, Wisloff U, Skogvoll E, Stolen T, Tjonna AE, Stenseth R, et al. The marked reduction in mixed venous oxygen saturation during early mobilization after cardiac surgery: the effect of posture or exercise? Anesth Analg. 2006;102(6):1609-16.
rise in systemic vascular resistance in the postoperative period, which also explains the lack of an increase in SAP values on the 4th day of the postoperative period in the present study.
Another important finding was the negative correlation between the RPE scale and SAP as well as MAP on the 3rd day of the postoperative period. A study by Kirkeby et al. [6] found an increase in HR proportional to VO2, with maintenance of systolic volume and a reduction in systemic vascular resistance. In the present study, the patients exhibited adequate myocardial function (EF > 0.5) in the preoperative period, which may explain the pressure behavior and the inverse relationship with the RPE scale. We also found no correlation between this variable and HR, which is a result that contrasts studies carried out on healthy individuals [20-22]. However, Joo et al. [23] demonstrated a greater correlation between HR and VO2 than with the RPE scale when employing an exercise program based on American College of Sports Medicine (ACSM) guidelines.
None of the variables analyzed exhibited behavior compatible with increased cardiovascular risk, thereby demonstrating an acceptable degree of safety during the performance of low-impact exercises based on the AACVPR guidelines for patients in Phase I cardiovascular rehabilitation. The mean maximal DPr value was at most 30% of maximal predicted values (36,000), which was established at 36,000 [24]. This behavior was similar in all variables analyzed in the present study. Such a finding leads us to posit that patients in this phase may be exercising at levels considered safe, but at intensities below that necessary to generate a minimal load, which speaks to a possible change in current recommendations for patients in the hospitalization phase of cardiovascular and metabolic rehabilitation.
Limitations
The present study had limitations that should be addressed. The first is related to the small sample size in relation to the population. Taking into account the standard deviations of key variables in our study, which were the heart rate and double-product, average differences obtained between the observed moments, the calculation of sample size, showed a power of the sample of 90% and 95% (for heart rate and double product respectively) of the experiment to detect a statistical difference, for a significance level of P <0.05. To do so, despite the small sample size, we consider the findings consistent with the reality that would be replicated in a larger sample.The second point regards the variables chosen for the study. We are aware that a direct hemodynamic analysis of greater detail would provide important information regarding the cardiovascular behavior. However, we believe that the variables described
in the present investigation are supported in the literature and demonstrate both cardiovascular behavior and safety during exercise in an easier and more practical manner.
CONCLUSION
7. Kirkeby-Garstad I, Sellevold OF, Stenseth R, Skogvoll E. Mixed venous oxygen desaturation during early mobilization after coronary artery bypass surgery. Acta Anaesthesiol Scand. 2005;49(6):827-34.
8. Kirkeby-Garstad I, Stenseth R, Sellevold OF. Post-operative myocardial dysfunction does not affect the physiological response to early mobilization after coronary a r t e r y b y p a s s g r a f t i n g . A c t a A n a e s t h e s i o l S c a n d . 2005;49(9):1241-7.
9. Kirkeby-Garstad I, Sellevold OF, Stenseth R, Skogvoll E, Karevold A. Marked mixed venous desaturation during early mobilization after aortic valve surgery. Anesth Analg. 2004;98(2):311-7.
10. Barnstedt J, Tegethoff K, Stellmacher A, Baumert JH, Dambacher M, Adt M, et al. Variability of heart rate and regulation of systolic blood pressure evaluated by fixed rate atrial pacing. Clin Sci (Lond). 1996;91(Suppl):13-5.
11. Lucini D, Milani RV, Constantino G, Lavie CJ, Porta A, Pagani M. Effects of cardiac rehabilitation and exercise training on autonomic regulation in patients with coronary artery disease. Am Heart J. 2002;143(6):977-83.
12. Pollock ML, Pels AE 3rd. Exercise prescription for the cardiac patient: an update. Clin Sports Med. 1984;3(2):425-42.
13. Gremillion MM, VanHoof CC, Landreneau JW. Cardiac rehabilitation: an overview. J La State Med Soc. 1992;144(5):227-30.
14. Eston R, Connolly D. The use of ratings of perceived exertion for exercise prescription in patients receiving beta-blocker therapy. Sports Med. 1996; 21(3):176-90.
15. Godoy M, Bellini A, Passaro LC, Mastrocolia LE et al. I Consenso nacional de reabilitação cardíaca (Fase crônica). Arq Bras Cardiol. 1997;69:267-91.
16. Borg GA. Psychophysical bases of perceived exertion. Med Sci Sports Exerc. 1982;14(5):377-81.
17. Chen MJ, Fan X, Moe ST. Criterion-related validity of the Borg ratings of perceived exertion scale in healthy individuals: a meta-analysis. J Sports Sci. 2002;20(11):873-99.
18. Foss ML, Keteyian SJ. Bases fisiológicas do exercício e do esporte. 6ª ed. Rio de Janeiro: Guanabara Koogan;2000. p.220-1.
19. Neder JA, Nery LE. Fisiologia clínica do exercício. Teoria e Prática. 1ª ed. São Paulo:Artes Médicas;2003. p.110-1.
20. Robertson RJ, Goss FL, Metz KF. Perception of physical exertion during dynamic exercise: a tribute to Professor Gunnar A. V. Borg. Percept Mot Skills. 1998;86(1):183-91.
21. Pandof KB. Differentiated ratings of perceived exertion during physical exercise. Med Sci Sports Exerc. 1982;14(5):397-405.
22. Robertson RJ. Central signals of perceived exertion during dynamic exercise. Med Sci Sports Exerc. 1982;14(5):390-6.
23. Joo KC, Brubaker PH, MacDougall A, Saikin AM, Ross JH, Whaley MH. Exercise prescription using resting heart rate plus 20 or perceived exertion in cardiac rehabilitation. J Cardiopulm Rehabil. 2004;24(3):178-84.