Submitted7 June 2016 Accepted 7 September 2016 Published20 October 2016 Corresponding authors Samra Khalid, [email protected] Rumeza Hanif, [email protected] Academic editor Elena Papaleo
Additional Information and Declarations can be found on page 23
DOI10.7717/peerj.2542
Copyright 2016 Khalid et al.
Distributed under
Creative Commons CC-BY 4.0
OPEN ACCESS
Formal modeling and analysis of ER-
α
associated Biological Regulatory Network
in breast cancer
Samra Khalid1, Rumeza Hanif1, Samar H.K. Tareen2, Amnah Siddiqa3, Zurah Bibi3and Jamil Ahmad3
1Atta-ur-Rahman School of Applied Biosciences (ASAB)/Healthcare Biotechnology, National University of
Science and Technology, Islamabad, Pakistan
2Maastricht Centre for Systems Biology (MaCSBio), Maastricht University, Maastricht, Netherlands 3Research Center for Modeling & Simulation (RCMS), National University of Science and Technology,
Islamabad, Pakistan
ABSTRACT
Background. Breast cancer (BC) is one of the leading cause of death among females worldwide. The increasing incidence of BC is due to various genetic and environmental changes which lead to the disruption of cellular signaling network(s). It is a complex disease in which several interlinking signaling cascades play a crucial role in establishing a complex regulatory network. The logical modeling approach of René Thomas has been applied to analyze the behavior of estrogen receptor-alpha (ER-α) associated Biological Regulatory Network (BRN) for a small part of complex events that leads to BC metastasis.
Methods. A discrete model was constructed using the kinetic logic formalism and its set of logical parameters were obtained using the model checking technique implemented in the SMBioNet software which is consistent with biological observations. The discrete model was further enriched with continuous dynamics by converting it into an equivalent Petri Net (PN) to analyze the logical parameters of the involved entities. Results.In-silicobased discrete and continuous modeling of ER-α associated signal-ing network involved in BC provides information about behaviors and gene-gene interaction in detail. The dynamics of discrete model revealed, imperative behaviors represented as cyclic paths and trajectories leading to pathogenic states such as metastasis. Results suggest that the increased expressions of receptors ER-α, IGF-1R and EGFR slow down the activity of tumor suppressor genes (TSGs) such as BRCA1, p53 and Mdm2 which can lead to metastasis. Therefore, IGF-1R and EGFR are considered as important inhibitory targets to control the metastasis in BC.
Conclusion. Thein-silico approaches allow us to increase our understanding of the functional properties of living organisms. It opens new avenues of investigations of multiple inhibitory targets (ER-α, IGF-1R and EGFR) for wet lab experiments as well as provided valuable insights in the treatment of cancers such as BC.
SubjectsBioinformatics, Computational Biology
INTRODUCTION
Breast cancer (BC) is a heterogeneous disease which is one of the leading causes of cancer-related mortalities among females worldwide (DeSantis et al., 2014). Estimates indicate that out of 14.1 million new cancer cases globally (Ferlay et al., 2015), BC accounts for 25.2% of them (Hotes et al., 2004). The increasing incidence of BC is due to various genetic and environmental factors such as early menarche, late menopause, hormonal therapies, low breastfeeding, low parity and others (Madigan et al., 1995;McPherson, Steel & Dixon, 2000; Parkin & Fernandez, 2006). Increased expression of estrogen receptor-alpha (ER-α) is observed in 73–75% of diagnosed BC cases (Nadji et al., 2005;Rhodes et al., 2000) which leads to the disruption of various cellular processes (Seemayer et al., 2002). The mutations which increase ER-αexpression can be caused by both genetic and environmental signals/conditions. There are two isoforms of ER, namely ER-α and ER-β (Fuqua et al., 1999; Saji et al., 2002). Approximately, there is 70% occurrence of ER-α positive and 30% of ER-αnegative in the reported cases of BC (Hurvitz & Pietras, 2008;
Madeira et al., 2013).
Insulin like growth factor (IGF-1) regulates the expression of ER-α through the phosphoinositide-3 kinase and Serine/Threonine-Protein Kinases (PI3K-AKT) pathway which is involved in multiple mammalian cellular processes of growth and development (Ewing & Goff, 2010). Several independent studies have shown deregulation of this pathway in BC (Bailey et al., 2012;Chitnis et al., 2008;Jackson et al., 2001;Kang et al., 2012b;Kato et al., 1994;Law et al., 2008;Liu et al., 2009;Miller et al., 2005;Pollak, 2008;Riedemann & Macaulay, 2006;Sotiriou et al., 2003). The signal transduction pathway of IGF-1 regulates ER-αexpression as shown inFig. 1which is constructed using literature and biological databases of interactions such as Kyoto Encyclopedia of Genes and Genomes (KEGG) (Kanehisa & Goto, 2000; Kang et al., 2012b; Levin, 2001; Pollak, 2008). The signaling cascade begins with the binding of IGF-1 to IGF-1 receptor (IGF-1R) through the phosphorylation of insulin receptor substrate-1 signaling (IRS-1) (Fagan & Yee, 2008;
Law et al., 2008). It activates several downstream mediator proteins, including PI3K (Law et al., 2008;Pollak, 2008;Riedemann & Macaulay, 2006;Werner & Maor, 2006), which is involved in the activation of ER-αeither through phosphorylation of AKT (Law et al., 2008;
Pollak, 2008) or mitogen-activated kinase/extracellular signal-regulated kinase (MEK/ERK) (Watters et al., 2000).
Figure 1 IGF-1R and EGFR signaling pathway.(A) Ligand activated Insulin growth factor receptor-1 (IGF-1R) signaling starts from the membrane to induce the insulin receptor-1 signaling. IRS-1 down-regulates the phosphoinositide-3 kinase (PI3-K) (1a1) which phosphorylates protein kinase B (AKT) (2a1).
IRS-1 signaling further activates the downstream mediator Ataxia telangiectasia mutated Rad3-related (ATM/ATR) protein (1a2). Phosphorylated serine/threonine protein kinase (AKT) and Extracellular
Signal-Regulated Kinase (ERK) signaling enhance the transactivation of estrogen receptor-alpha (ER-α) gene (3a1, 5c) which up-regulates the expression of insulin like growth factor-1 (IGF-1) (8a1). ER-α
activates thep53 (8a5) BRCA1 gene indirectly by stimulation of estrogen (E2) in breast cells (8a2) and also
respond to the activation of p53 gene (6a3). The role of ER-αin E2-independent manner and secreted
IGF-1 mediates the over-expression of IGF-1R (9a2). An important role of TSG (BRCA1) also activates
by the gene p53 (6a2).BRCA1suppresses the levels of ER-α(7a2) have the ability to induce apoptosis
rather than cell proliferation.BRCA1gene can also inhibit the phosphorylation of signaling pathways of IGF-1 receptor (7a3).p53 also activates byBRCA1(7a1) which regulates the activation ofMdm2(6a1)
that also suppress the over-activation ofp53 (5a2). (B) There are some mutations due to radiation or
oxidative stress that leads to the phosphorylation of ATM/ATR genes (1b, 3b1, 3b2, 3b3) and DNA damage
response occurs through the increased expression of ER-αgene (2b) which inhibits the expression ofp53 (8a4). PhosphorylatedMdm2expression leads to cell cycle proliferation (5a1) by the activation of mutated
ATM/ATR signaling cascades (4a1). (C) An alternate pathway of ER-αsignaling with estradiol may also
utilize epidermal growth factor receptor (EGFR) for signal transduction, which may further activate the Ras, Raf protein kinases (2c, 3c). E2 causes phosphorylation of PI3-Kinase which stimulates the MEK kinase (2a2) and enhances the activation of extracellular-regulated kinase (ERK) (4c). In breast cancer
activation of the p53 gene (Komarova et al., 2004;Schayek et al., 2009). BRCA1 and p53 genes have the ability to control cell cycle regulation (Rosen et al., 2003).
p53 plays an important role in the DNA damage repair detected by the enzyme ATM (Lee & Paull, 2007). In the case of phosphorylation of ATM, the expression ofp53 is regulated byMdm2(Hong et al., 2014;Powers et al., 2004). Furthermore,p53 is suppressed by up-regulated expression of ER-αwhich is induced by DNA damage response (Bailey et al., 2012;
Liu et al., 2006;Miller et al., 2005;Sayeed et al., 2007). However, loss of function mutation of BRCA1 and p53 genes drastically increase the risk of BC and can disrupt the function of PI3K/AKT and ATM/ATR signaling (Abramovitch & Werner, 2002;Abramovitch et al., 2003;Miller et al., 2005;Vivanco & Sawyers, 2002).
Previous studies suggested ER-αas an important therapeutic target for the management of BC pathogenesis (Ariazi et al., 2006; García-Becerra et al., 2012;Giacinti et al., 2006;
Hanstein et al., 2004; Kang et al., 2012b; Renoir, Marsaud & Lazennec, 2013;Wik et al., 2013). Although, ER-α is used as a drug target for the treatment of BC (Fisher et al., 1989), the underlying dynamics are far from comprehension due to the complexity of the interaction among genes/proteins involved in the signaling pathway. Preclinical studies andin vivoexperimental strategies in cancer biology are laborious and expensive. To overcome the limitation of wet-lab experiments various Bioinformatics tools are used to study the complex regulatory networks. The computational modeling formalisms provide the dynamical insights into complex mutational diseases such as BC. In this study, we take this opportunity to study the dynamics of the IGF-1R signaling pathway by using two well-known formal computational methods, i.e., generalized logical modeling of Rene’ Thomas (Thomas, 1998;Thomas & Kaufman, 2001b;Thomas & D’Ari, 1990;Thomas & Kaufman, 2002;Thomas, Thieffry & Kaufman, 1995) and Petri Net (PN) (Brauer, Reisig & Rozenberg, 2006).
The discrete dynamics of IGF-1R/EGFR signaling was analyzed by formal modeling, which allows to study the dynamics by predicting all possible behaviors which are captured as discrete states and trajectories between them (Heinrich & Schuster, 1998). In order to construct the discrete model, we need the interaction data and threshold levels, which can be obtained through biological observations (Ahmad et al., 2006;Ahmad et al., 2012;Paracha et al., 2014). Furthermore, the continuous modelling approach applied here for the analysis of delay parameters of the IGF-1R/EGFR signalling pathway. The IGF-1R/EGFR signaling in this study implicates the down-regulation of TSGs such as BRCA1, p53 and Mdm2 in metastasis of BC. IGF-1R and EGFR should be inhibited together to control the metastatic behaviour of BC. The discrete and continuous models provide insights into possible drug targets which are captured from bifurcation states leading to both homeostatic and disease trajectories.
METHODS
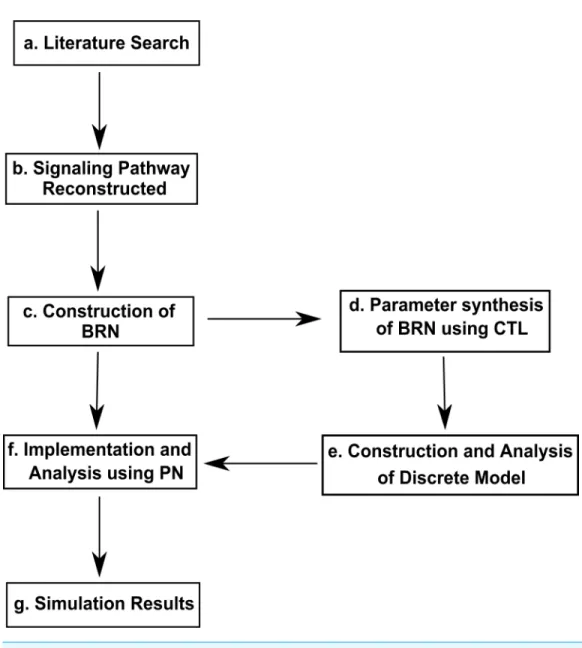
Figure 2 Work Flow Diagram presenting the structure and organization of the study.(A) Inference of biological observations of signaling pathways from literature survey (B) construction of interactions of proteins in the metastasis of Breast cancer (C) application of reduction approach to obtain Biological Reg-ulatory Network (BRN) (D) parameter synthesis by using model checking method, computational tree logic (CTL) (E) analysis of the system dynamics (F) conversion of the BRN into continuous Hybrid Petri Net (HPN) (G) for simulations analysis of time-dependent dynamics.
difficult to model the complexity of non-linear dynamics of biological systems due to rare availability of system specific kinetic measures derived from expression data of biological entities. On the contrary, approaches based on Graph Theory allow to model the complexity of biological systems. The methodology for the current study is presented in Fig. 2and explained below.
Kinetic Logic Formalism
analysis of the BRN as equivalent to the respective differential equations of the system (Thieffry & Thomas, 1995;Thomas, 1973;Thomas, 1981;Thomas, 2013;Thomas, Gathoye & Lambert, 1976). This method utilizes computational tree logic (CTL) formalism (Clarke, Grumberg & Peled, 1999) to detect the suitable logical parameters which can be selected through a model checker (Selection of Model of Biological Network) SMBioNet software (Bernot et al., 2004;Khalis et al., 2009;Richard, Comet & Bernot, 2006;Richard et al., 2012). These selected parameters of discrete model are abstracted from biological observations and are applied through the software, GENOTECH, to generate an asynchronous state graph (Bernot et al., 2004). A BRN consists of nodes and edges of each biological entity and transitions among them. All of the nodes are connected with edges (directed arrows) representing the activation and inhibition of node (Ahmad et al., 2012;Thomas, 1998). A dynamical network is used to determine the behavior and characterization of environmental and genetic changes in the signaling network (Thomas, 1998;Thomas & Kaufman, 2001a;
Thomas, Thieffry & Kaufman, 1995).
Semantics of the René Thomas formalism
The semantics of the René Thomas formalism have been adapted from (Ahmad et al., 2006;
Ahmad et al., 2012;Aslam et al., 2014) and are described below.
Definition 1 (Directed Graph).
A directed graph is represented asG=(N,ED), where the set of all the entities are represented by nodes, N, and the set of all possible transitions among entities are represented by ED⊆N×N.G−(n) and G+(n) represent the set of predecessors and successors nodes of a node,n∈N, respectively (directed fromn1 ton2).
Definition 2 (BRN).
A BRN is a type of labeled directed graph G=(N,ED), representing the biological entities (genes, proteins, metabolites etc.) and the interactions amongst these entities. In a directed BRN graph each edge is pointed from tailnato headnbof an edge.
1. A pair (jnanb,ηnanb) is used as a label for each edgena→nb, wherejnanbis a positive integer representing a discrete threshold level andηnanbrepresents an activation (+sign) or an inhibition (−sign).
2. The maximum number of successors of node ‘n’ is limited topn=out degree of n in which eachjnanb∈ {1,2,...,rn}, wherern≤pn
3. A biological entitynhas its discrete levels in the setZn= {0,1,...,rn}.
The analysis of BRN provides insight into the behavioral activity of BRN by studying the interactions between its entities to find already known or predict previously unknown behaviors.
Types of Interactions:
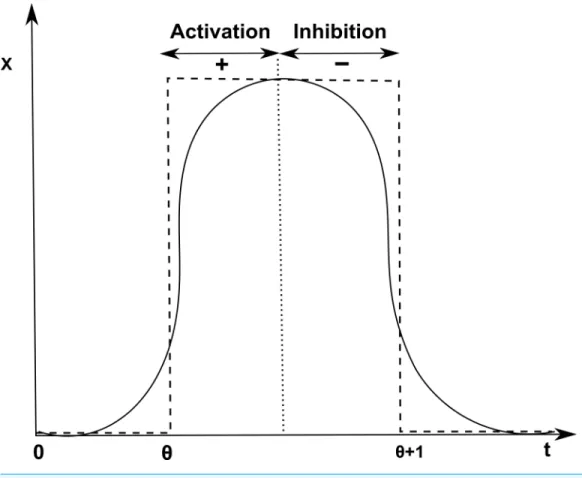
Figure 3 Activation and inhibition of x.Discretization of the sigmoid curve to represent activation (+) of gene x at threshold levelθand inhibition (−) at levelθ+1.
Definition 3 (Discrete States).
A discrete state is an array of discrete levels of entities of the BRN. The state graphGof BRN where the discrete state is represented as a tupleD∈S, where;
D= Y na∈N
Zna
and vector of discrete states defined as (Dxna)∀na∈N, wherena is representing the level of product a. A setDof discrete states is equal toSrepresenting a directed graph in a particular configuration. The set of resources represents the presence of activators of particular entities in the absence of inhibitors.
Definition 4 (Resources).
LetG be the BRN where a set of resourcesRxna of a variablena∈N at a level x is considered asRxna= {nb∈G−(na)|(xnb≥jnbna∧ηnbna=‘+’)∨(xnb<jnbna∨ηnbna=‘−’)}.
Definition 5 (Logical Parameters).
Logical parameters govern the behavior and semantics of the regulatory network. These values are represented by the equation:
in which the expression level x of the entityndetermines the set of logical parameter {Kn(Rxn)}. The evolution of the level of the variable follows the following three rules: (1) If levelxof the entitynis less thanKni(Rxni) then it increases by one discrete step, that
isx=x+1.
(2) Ifxis greater thanKni(Rxni) then it decreases by one discrete step, that isx=x−1. (3) Ifxis equal toKni(Rxni) then it will not change, that isx=x.
It is conveniently clear from the above rules which follow the evolutionary operator (Bernot, Comet & Khalis, 2008). It tends to be evolved from one level to another for an asynchronous state graph of BRN.
Definition 6 (Asynchronous State Graph).
The asynchronous state graph of a BRN, where G is a directed graph which define the set of all the states and transitions of a BRN. It is represented as:G=(s,t), where ‘‘s’’ is a set of all states and ‘‘t’’ ist⊆s×swhich defines the transitions among states in a directed graph. LetOxnbe representing the concentration level of an entitynin a stateQ∈s. A state Qtransitions to another stateQ/iff:
1. Qxna6=Q/xna &O/xna=QxnaKna(Rxna)∃na∈N whererepresents the evolution operator (Bernot et al., 2004;Peres & Jean-Paul, 2003) and
2. Q/xnb=Qxnb∀nb∈N.
Model checking
Model checking (Clarke & Emerson, 1982) is an exhaustive technique used to verify the existence or absence of different properties in a given system (Carrillo, Góngora & Rosen-blueth, 2012). The system is represented as a state graph and different properties test for their prevalence either throughout the state graph (Carrillo, Góngora & Rosenblueth, 2012).
Computation of consistent network (SMBioNet)
SMBioNet (Bernot et al., 2004;Khalis et al., 2009;Richard, Comet & Bernot, 2006;Richard et al., 2012) is software used to provide the verified logical parameters of BRN by Computation Tree Logic (CTL) based model checking (Peres & Jean-Paul, 2003). CTL formulas are used to express the biological observations of the model in a model checker tool. It facilitates us by selecting only those parameter sets that are consistent with the specified CTL formulas. The selected parameters are eventually used to generate a state graph given below (see Sections ‘Isolation and selection of logical parameters’ and ‘Analysis of ER-α associated BRN’ for detail).
Syntax and semantic of CTL
∃ =there exist a path which starts from the current state, ∀ =All possible paths which start from the current state, X=Immediate successor,
F=at least one state included either future or successors, G=All set of states included either future or successors
For further details, a comprehensive review of syntax and semantics logical operators of CTL used in SMBioNet has been covered in detail byKhalis et al. (2009).
Implementation of BRN in Petri Net (PN)
PN is a graph theoretical formalism which was introduced by Carl Adam for modeling of concurrent systems (Petri & Reisig, 2008). It allows intuitive representation of the system besides allowing the discrete, continuous and hybrid analysis for systemwide behaviors (Chaouiya, 2007). In this study, we have deployed PN framework to model continuous dynamics based on selected trajectories (homeostatic and pathological). It is identified by using the kinetic logic formalism based on ER-αassociated BRN analysis. These dynamics are best specified as continuous differential equations. Our representation and analysis of the PN framework have been adapted fromChaouiya (2007);Blätke, Heiner & Marwan (2011);David & Alla (2008)are explained below.
Standard PN
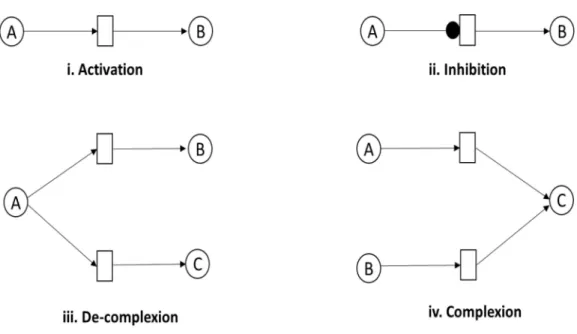
A PN,N=(P,T,E,t0), is a formal bipartite graph with two kinds of set of nodes represented as placesPand transitionsT which can be discrete in nature. The set of placesP, drawn as circles, represents the entities such as proteins, genes and metabolites involved to design a passive part of BRN. The set of transitions T, represented as rectangles or squares, defines the interaction among input and out places, typically model the active part of BRN. The set of edges, E, defined as directed arcs are used to connect the places with transitions. These can be classified into normal, inhibitory, or test arc. An arc controls the firing in continuous process when reaction is processed from place to transition. The inhibitory arc represents the reaction where the token of input places is higher than the arc weight. A test arc is used to represent a process where the firing of transition does not change the concentration of a place such as enzymatic reactions. These biological interactions determine the dynamical behavior of entities which are involved in multiple cellular processes such as cell metabolism, differentiation, cell division and apoptosis. The marking of a place is represented by token,t, to describe the concentration of the entities. The firing of a transition involves the movement of tokens from pre-places to post-places. Different biological processes such as activation, inhibition, complexion, de-complexion and enzymatic reactions as represented using PN are illustrated below (Fig. 4).
Hybrid Petri Net (HPN)
Figure 4 Representation of association reactions between entities.(i) Activation: entity A tends to ac-tivate another entity B (ii) Inhibition: entity A stops the activity of entity B. (iii) De-complexion process: entity A involves the activation of two entities B and C, simultaneously (iv) Complexion process: entities A and B are involved in the activation of entity C.
continuous process while discrete places have finite numbers of tokens. HPN considers the mass action and Michaelis–Menten equations to model the firing transitions by SNOOPY (Heiner et al., 2012).
Petri Net model generation
In this study, we used SNOOPY (version 2.0) (Heiner et al., 2012), which is a generic and adaptive tool for modeling and simulation of graph based HPN models. We have deployed the non-parametric modeling approach which uses the token distribution within places (representing proteins) over time for monitoring the dynamics of signal flow in a signaling PN devised byRuths et al. (2008). The concentrations of the proteins (represented as places) are modeled as tokens while their flow is represented using kinetic parameters utilizing the mass action kinetics. The value of kinetic parameter is acquired by aggregating the token count at places after each firing, which models the effect of source place on a target place. Each simulation is executed multiple times beginning with the same initial marking providing an average, signaling rate modeling the random orders of transition firings. These firing rates are able to produce the experimentally correlated expression dynamics and imitate the qualitative protein quantification techniques such as western blots, microarrays, immunohistochemistry. We used 1,000 simulation runs at 10, 50 and 100 time units for analysis. Experimental data obtained by high throughput technologies of several studies (Bailey et al., 2012; Caldon, 2014;Kang et al., 2012b;Kang et al., 2014; Liao et al., 2014;
Malaguarnera & Belfiore, 2014;Moerkens et al., 2014;Cancer Genome Atlas Network, 2012;
RESULTS AND DISCUSSION
This section explains and elaborates the results obtained from the application of the methodology and tools described in the method section.
Construction of the ER-αassociated BRN
The formal method for modeling BRN was adapted fromRichard et al. (2012). The role of IGF-1R and EGFR in regulating ER-α was abstracted from signaling pathway shown inFig. 1. The significance of constructing the abstracted model shown inFig. 5allows us to define the complex dynamical behaviors of entities which are more difficult to identify through analytical procedures, while keeping the computational complexity of the model to a minimum. We selected the key entities which interlinked at diverse points essential for behavior analysis of ER-αassociated signaling network involved in BC. Previous studies were performed to determine the significance of TSGs in relation with over-expression of ER-αwhich is described below.
i. The interaction of ER-α with p53 mediated transcription which represents the expression levels ofp53 (Bailey et al., 2012;Sotiriou et al., 2003).
ii. Thus, the inhibitory actions ofBRCA1towards IGF-1R/EGFR and ER-αcould become suppressed by the upregulated expression of ligandactivated hormonal receptor ER-α that is able to perform the transcriptional activation ofp53 (Wang & Di, 2014;Yi, Kang & Bae, 2014)
iii. The TSG, p53 has positive feedback interaction with BRCA1 gene and is also involved in the activation of the Mdm2 gene (Ciliberto, Novák & Tyson, 2005; MacLachlan, Takimoto & El-Deiry, 2002;Yi, Kang & Bae, 2014).
iv. Whenever there is an increased expression ofp53 due to some oxidative stress then it will increase the level ofBRCA1andMdm2, which will result in the respective activation or deactivation ofp53 (MacLachlan, Takimoto & El-Deiry, 2002). Finally, the BRN was abstracted on the basis of activation of ER-α through loss of function mutations of TSGs such as BRCA1, p53 and Mdm2 which leads to the development of BC (Caldon, 2014).
Isolation and selection of logical parameters
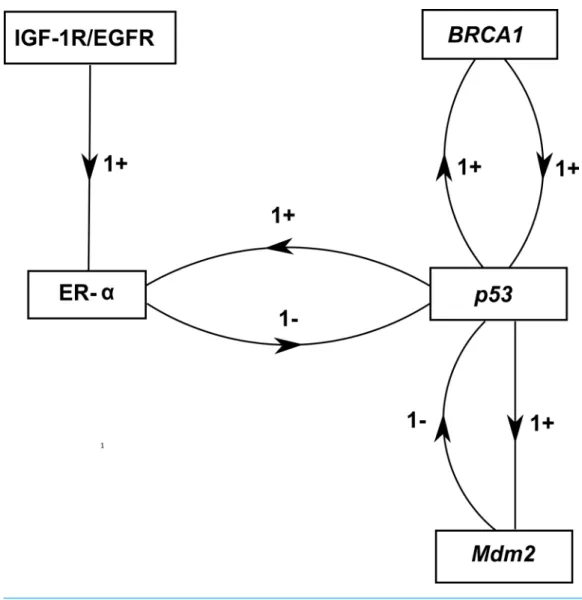
Figure 5 ER-αassociated BRN.Activation is indicated by a positive (+) sign while negative (−) sign
indicate inhibition. The direction of activation/inhibition is represented by arrows. The levels of entities are set according to Definition 2. The formal description of the BRN isN = {IGF −1R/EGFR,ER−
α,BRCA1,p53,Mdm2};ED= {(IGF−1R/EGFR→ER−α),(ER−α→p53),(p53→Mdm2),(p53→ BRCA1),(BRCA1→p53),(Mdm2→p53),(p53→ER−α)}.
K(p53),{ER−α,BRCA1})=1,K(p53),{BRCA1,Mdm2})=1). The output file, which also shows the input model and CTL properties, is submitted along with this article as Supplemental Information 1.
Analysis of ER-αassociated BRN
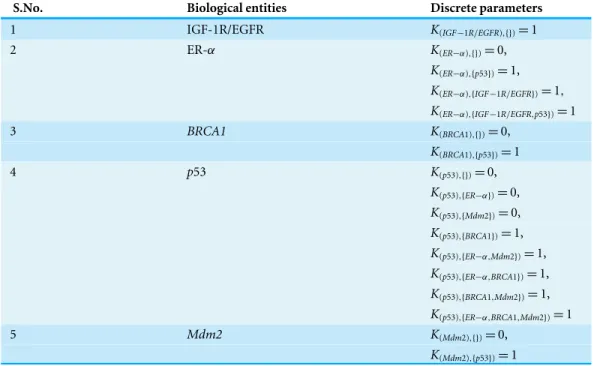
Table 1 List of discrete parameters of each entity of the BRN.The entities in the curly braces represent the resources available for the respective entity, whereas the number in front of the resource set represents the level which the entity will try to achieve when having that resource set.
S.No. Biological entities Discrete parameters
1 IGF-1R/EGFR K(IGF−1R/EGFR),{})=1
2 ER-α K(ER−α),{})=0,
K(ER−α),{p53})=1,
K(ER−α),{IGF−1R/EGFR})=1,
K(ER−α),{IGF−1R/EGFR,p53})=1
3 BRCA1 K(BRCA1),{})=0,
K(BRCA1),{p53})=1
4 p53 K(p53),{})=0,
K(p53),{ER−α})=0,
K(p53),{Mdm2})=0,
K(p53),{BRCA1})=1,
K(p53),{ER−α,Mdm2})=1,
K(p53),{ER−α,BRCA1})=1,
K(p53),{BRCA1,Mdm2})=1,
K(p53),{ER−α,BRCA1,Mdm2})=1
5 Mdm2 K(Mdm2),{})=0,
K(Mdm2),{p53})=1
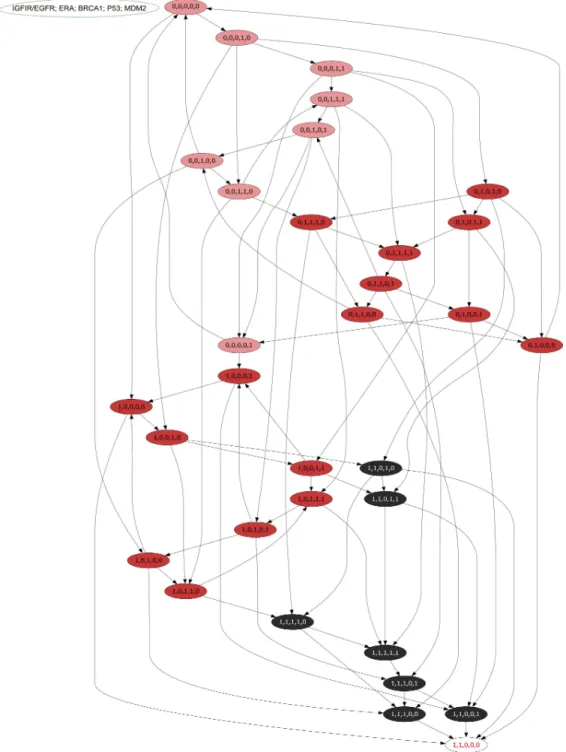
extracted from the selected parameter set generated by the state graph. It also represents how different trajectories can arise from this BRN that could lead towards BC metastasis with up-regulated expression of IGF-1R/EGFR and ER-αor maintains homeostasis through the expression ofp53,BRCA1, andMdm2.
• P1 =(0,0,0,0,0), (0,0,0,1,0), (0,0,0,1,1), (0,0,1,1,1), (0,0,1,0,1), (0,0,1,0,0), (0,0,1,1,0), (0,0,0,0,1)
• P2a=(0,1,1,1,0), (0,1,0,1,0), (0,1,0,1,1), (0,1,1,1,1), (0,1,1,0,1), (0,1,0,0,1), (0,1,1,0,0), (0,1,0,0,0)
• P2b=(1,0,0,0,1), (1,0,0,0,0), (1,0,0,1,0), (1,0,0,1,1), (1,0,1,1,1), (1,0,1,0,1), (1,0,1,0,0), (1,0,1,1,0), (1,1,0,1,0), (1,1,0,1,1)
• P3=(1,1,1,1,0), (1,1,1,1,1), (1,1,1,0,1), (1,1,1,0,0), (1,1,0,0,1), (1,1,0,0,0)
Figure 6 An asynchronous state graph of the ER-αassociated BRN.The asynchronous state graph is
generated by using the tool GENOTECH, utilizing the SMBioNet generated logical parameters. The ini-tial state is taken as (0,0,0,0,0) where all entities are at their suppressed levels, whereas the deadlocked state (1,1,0,0,0) represents the metastatic state where only IGF-1R/EGFR and ER-αremain persistently active at cancerous levels whilst the p53, BRCA1, and Mdm2 genes are under constant suppression. The state graph is unique in the sense that it distinctly represent four zones: the pink zone (P1) is termed the
low-risk zone since it doesn’t involve the activation of either IGF-1R/EGFR, or ER-α, both the proteins re-quired for metastasis; the two red zones (P2a, P2b) are termed high risk since each zone distinctly has either
IGF-1R/EGFR or ER-αpersistently active; the black zone (P3) is the metastatic zone as it has both
zone P3 on the other hand contains no cyclic trajectories. In P3zone most critical state trajectories move towards a deadlock state.
The usual activation of p53 gene has been detected by the enzyme ATM (Fig. 1). It is evident from the state graph (Fig. 6) that the state (1,1,0,0,1) (in P3 zone) stands to be the critical most point forms where the system moves into the metastatic state (1,1,0,0,0) where all the TSGs BRCA1, p53 and Mdm2 gets suppressed. Hence, it is important to note that the system maintains a homeostatic cycle only when both IGF-1R and ER-αare not a co-stimulated state while other genes (BRCA1, p53 and Mdm2) remain in the oscillations. These identifications indicate that signal transduction pathway involved in the increased risk of BC progression is initiated following the activation of receptors IGF-1R and EGFR. It was concluded that IGF-1R, EGFR and ER-α serve as important inhibitory targets for BC treatment.
Analysis of ER-αassociated HPN modeling
The PN model of BC metastasis was constructed to observe the time-dependent behaviors of key proteins of the BRN (given in ‘Construction of the ER-αassociated BRN’). The HPN analysis was performed to reveal continuous dynamics of homeostatic and pathological conditions of the ER-αassociated network. Two PN models and their simulations of ER-α were constructed (1) one to represent the normal behavior (given inFigs. 7and8) and other (2) to represent pathogenesis (Figs. 9and10) to evaluate the role of ER-αin BC. Both HPN models consist of 7 places, 8 transitions and 18 edges. The homeostatic ER-α associated HPN model (Fig. 7) has a positive feedback loop betweenp53 and ER-αwhich is switched on through the binding of ligands (IGF-1/EGF) with receptors (IGF-1R/EGFR) (Angeloni et al., 2004). This binding of receptors with ligands leads towards phosphorylation of kinases PI3K and AKT that ultimately cause up-regulation of ER-α(Kang et al., 2012a). The up-regulate expression of ER-αis controlled by the negative feedback interaction of TSG such as Mdm2.
Figure 7 Illustration of the normal pathway of ER-αassociated Hybrid Petri Net (HPN) model.In this
PN, circles represent standard places that exhibit the behavior of ligands (IGF-1, EGF), hormonal recep-tors (IGF-1R, EGFR and ER-α) and TSGs (BRCA1, p53 and Mdm2), while the squares represent contin-uous transitions to demonstrate the processes of activation, inhibition and phosphorylation. Directed ar-rows represent activation signal coming from standard places and going towards continuous transitions. The inhibitory arc represents an inhibition signal which stops signal coming from standard places towards continuous transitions. The rate of mass action for all continuous transitions is taken as 1. The ligands (IGF-1, EGF) and the membrane receptors (IGF-1R/EGFR) are given with an arbitrary token number of 5.
Figure 8 Simulation of homeostatic HPN model.The simulated graph shows time onX-axis and rela-tive expression levels of entities onY-axis. The homeostatic behavior of ER-αassociated BRN is observed by the over-expression of TSG such as Mdm2 (navy) which down-regulates the activity of ER-α(yellow).
binds to receptors (IGF-1R/EGFR) given by a token number of 5. ER-αis closely associated with cancer biology, especially with the development of tumor in BC (Alluri, Speers & Chinnaiyan, 2014). So it is important to study the mechanism of ER-αassociated signaling pathway is controlled by the inhibition of complex (ligands binding with receptors) to obtain new insight into the treatment of BC.
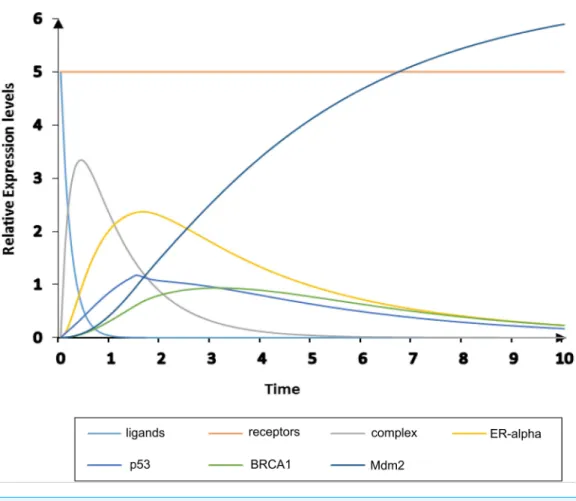
The pathological conditions of ER-α associated HPN were simulated to observe the expression levels of entities with respect to time, given inFig. 10. The mutated behavior of TSGs can be clearly seen in the simulation graph where sigmoidal curves forBRCA1, p53 andMdm2are represented by cyan, green and navy colors, respectively. Likewise, ER-αis produced at constant pace (represented at the expression level of 5) with mutated behaviors of TSGs which stimulates the activity of IGF-1R and EGFR receptors (represented by orange colored line). The high level of IGF-1R in ER-positive (ER+) BC cells is attributed to the carcinogenic cellular proliferation (Yerushalmi et al., 2012). The gene expression profile of basal cancer subtypes ER-PR-HER2 has low expression of ER-related genes and high expression of basal marker than luminal cancer (Perou et al., 2000;Sorlie et al., 2001;
Figure 9 Illustration of the pathological pathway of ER-αassociated HPN.In this PN circle represent
standard places which explained the behavior of ligands (IGF-1, EGF), membrane and hormonal recep-tors (IGF-1R, EGFR and ER-α) and TSGs (BRCA1, p53 and Mdm2) and the squares represent continu-ous transitions to demonstrate the processes of activation, inhibition and phosphorylation. Directed ar-rows represent activation signal coming from standard places and going towards continuous transitions. Inhibitory arcs represent inhibition signal which stops signal coming from standard places towards con-tinuous transitions. The rate of mass action for all concon-tinuous transitions is taken as 1. The ligands (IGF-1, EGF) and the membrane receptors (IGF-1R/EGFR) are given with an arbitrary token number of 5.
by blue colored curve. Various epidemiological studies have revealed that the increased level of IGF-1 is associated with higher risk of other malignancies such as prostate, colorectal and postmenopausal BC (Giovannucci, 2001;Kang et al., 2012b;Soulitzis et al., 2006). Previous evidences shows the over-expression of IGF-1R and EGFR in various types of breast tumours such as luminal and basal cancer subtypes (Perou et al., 2000;Sorlie et al., 2001;
Figure 10 Simulation of diseased HPN model.The simulated graph shows time onX-axis and relative expression levels of entities onY-axis. The pathological behavior of ER-αassociated BRN is observed by the down-regulate expressions of TSGs; p53, BRCA1 and Mdm2 (cyan, green and navy) with relatively in-creased the activity of ER-α(yellow).
IGF-1R and EGFR in BC cells that overexpress HER2 (Gallardo et al., 2012). Our results also suggest that inhibition of the carcinogenic effect of IGF-1R and EGFR in ER-αsignaling pathway tend to reduce BC cell proliferation and metastasis.
Comparison of homeostatic and disease HPN models
The comparison of the dynamical behavior of proteins involved in ER-α associated signaling pathway in homeostasis and pathological conditions in BC has been performed in accordance with the biological observations as shown inTable 2andFig. 11, respectively. The differences in simulation graphs represent the relative expression level of each entity under the state of homeostasis (represented by blue color) and pathogenesis (represented by brown color). The change in interaction is based on our interpretation of the results from the BRN modeling. Our results reproduced recent wet-lab findings previously performed to deregulate BC pathogenesis by using genome/protein wide expression and sequence analysis. InFigs.11A–11Fwere brown colored line/curve represents suppressed activity level of TSGs by the up-regulation of ER-α (Zhang et al., 2014) and blue colored line/curve represents the controlled levels of ER-α through the stimulation of TSGs (Berger et al., 2012).
Table 2 Comparison of expression levels of entities of both homeostasis and disease ER-αassociated HPN simulation with respect to literature
search.The positive sign (+) indicates the up-regulate expression, double positive (++) sign indicates the over-expression and a negative sign (−) indicates the down-regulate the expression levels of entities.
Genes Homeostasis Disease
Literature Simulation Literature Simulation
Ligands IGF-1/EGF −
Surmacz & Bartucci (2004)
− +
Kang et al. (2012a)
+
Receptors IGF-1R/ EGFR −
Surmacz & Bartucci (2004)
− ++
Ouban et al. (2003);
Surmacz & Bartucci (2004);
Taunk et al., (2010)
+
ER-α −
Zhang et al. (2014)
− ++
Bailey et al. (2012);
Surmacz & Bartucci (2004);
Liu et al. (2006)
++
BRCA1 +
Ma et al. (2010)
+ −
Kang et al. (2012a);
Rosen et al. (2003)
−
p53 +
Berger et al. (2012);
Miller et al. (2005)
+ −
Angeloni et al. (2004);
Bailey et al. 2012;
Liu et al. (2009)
−
Mdm2 +
Berger et al. (2012)
++ −
Kim, Burghardt & Barhoumi (2011)
−
Figure 11 Comparison of simulated graphs of both homeostasis and disease ER-αassociated HPN
models.TheX-axis shows the time unit whileY-axis shows the expression level of each entity under homeostasis and disease conditions of HPN models (Figs. 10and8). The blue line/curve represents the homeostatic behaviors and the brown line/curve represents the expression levels of mutated behaviors of key proteins involved in ER-αassociated pathway.Figs.11A–11Grepresents the relative change in activ-ity levels of ligands (IGF-1/EGF), receptors (IGF-1R/EGFR), complex, ER-αand TSGs (BRCA1, p53, and Mdm2) before and after mutations to be occurred.
tissues (breast and ovarian) along-with over-expression of ER-α(Angeloni et al., 2004;Kim, Burghardt & Barhoumi, 2011;Liu et al., 2009;Rosen et al., 2003;Savage & Harkin, 2015). The treatment of ER+ metastatic BC using an antagonist in combination with drugs could lead to the regulation ofp53 mediated apoptotic response (Bailey et al., 2012).
stages of BC. One mechanism of resistance to tamoxifenis increased through growth factor signaling pathways, such as the IGF pathway (Gallardo et al., 2012;Knowlden et al., 2005;Zhao & Ramaswamy, 2014). In addition to SERMs, aromatase inhibitors, such as exemestane, anastrozole, andletrozole deprive target tissues of ligand for ER which results in the inhibition of this pathway (Pietras, 2006;Van Asten et al., 2014). Steroidal anti-estrogens such as fulvestrant prevent ER dimerization, DNA binding and hence loss of receptor from cells (Agrawal et al., 2016;Osborne, Wakeling & Nicholson, 2004;Wakeling, Dukes & Bowler, 1991).
Studies show that estrogen can regulate IGF signaling and activate its downstream pathways by increasing the expression of both IRS-1 and IGF-1R in BC cells (Fagan & Yee, 2008;Lee et al., 1999). Our result obtained by using the tools GENOTECH, SMBioNet and SNOOPY have suggested that IGF-1R, EGFR and ER-α signaling pathways are actively involved in the progression of BC metastasis and they should be targeted together for its treatment. Our findings suggested an improved strategy for a combined drug therapy which confirms the results of few previous studies in which inhibition of both IGF-1R and EGFR have induced apoptosis by blocking phosphorylation of AKT and NFκB. Previous studies have shown the inhibition of IGF-1R and EGFR in signaling pathways at multiple levels in adrenocortical, prostate, head and neck cancers (Lee et al., 2016;Raju et al., 2015;
Xu et al., 2016). Commercially available inhibitors (NVP-AEW541, gifitinibanderlotinib) used against IGF-1R and EGFR significantly enhance anti-tumour efficacy for treatment of adrenocortical carcinoma (Baselga et al., 2005;Dickler et al., 2009;Hartog et al., 2012;Von Minckwitz et al., 2005;Xu et al., 2016). Therefore the combination of these commercially available inhibitors with systemic drugs (tamoxifen,trastuzumab and fulvestrant) should be used in the treatment of different clinical BC subtypes. In conclusion, blocking both EGFR and IGF-1R can inhibit estrogen stimulation of BC cells and blockade of ER-α signaling pathway can inhibit IGF-mediated mutagenesis.
CONCLUSION
ACKNOWLEDGEMENTS
The authors are highly obliged to the administrative facility provided by Prime Minister’s Youth Laptop Programme.
ADDITIONAL INFORMATION AND DECLARATIONS
Funding
The authors received no funding for this work.
Competing Interests
The authors declare there are no competing interests.
Author Contributions
• Samra Khalid conceived and designed the experiments, performed the experiments, analyzed the data, wrote the paper, prepared figures and/or tables.
• Rumeza Hanif reviewed drafts of the paper.
• Samar H.K. Tareen and Amnah Siddiqa analyzed the data. • Zurah Bibi prepared figures and/or tables.
• Jamil Ahmad contributed reagents/materials/analysis tools, reviewed drafts of the paper.
Data Availability
The following information was supplied regarding data availability: The raw data has been supplied asSupplemental Information 1.
Supplemental Information
Supplemental information for this article can be found online athttp://dx.doi.org/10.7717/ peerj.2542#supplemental-information.
REFERENCES
Abramovitch S, Glaser T, Ouchi T, Werner H. 2003.BRCA1–Sp1 interactions in transcriptional regulation of the IGF-IR gene.FEBS Letters541:149–154
DOI 10.1016/S0014-5793(03)00315-6.
Abramovitch S, Werner H. 2002.Functional and physical interactions between BRCA1 and p53 in transcriptional regulation of the IGF-IR gene.Hormone and Metabolic Research35(11-12):758–762.
Agrawal A, Robertson JF, Cheung KL, Gutteridge E, Ellis IO, Nicholson RI, Gee JM. 2016.Biological effects of fulvestrant on estrogen receptor positive human breast cancer: short, medium and long-term effects based on sequential biopsies. International Journal of Cancer 138:146–159DOI 10.1002/ijc.29682.
Ahmad J, Bernot G, Comet J-P, Lime D, Roux O. 2006.Hybrid modelling and dynamical analysis of gene regulatory networks with delays.ComPlexUs3:231–251
Ahmad J, Niazi U, Mansoor S, Siddique U, Bibby J. 2012.Formal modeling and analysis of the MAL-associated biological regulatory network: insight into cerebral malaria. PLoS ONE7:e33532DOI 10.1371/journal.pone.0033532.
Alluri PG, Speers C, Chinnaiyan AM. 2014.Estrogen receptor mutations and their role in breast cancer progression.Breast Cancer Research16:1–8
DOI 10.1186/s13058-014-0494-7.
Angeloni S, Martin M, Garcia-Morales P, Castro-Galache M, Ferragut J, Saceda M. 2004.Regulation of estrogen receptor-alpha expression by the tumor suppressor gene p53 in MCF-7 cells.Journal of Endocrinology180:497–504
DOI 10.1677/joe.0.1800497.
Ariazi EA, Ariazi JL, Cordera F, Jordan VC. 2006.Estrogen receptors as therapeutic targets in breast cancer.Current Topics in Medicinal Chemistry6:181–202
DOI 10.2174/156802606776173483.
Aslam B, Ahmad J, Ali A, Paracha RZ, Tareen SHK, Niazi U, Saeed T. 2014.On the modelling and analysis of the regulatory network of dengue virus pathogenesis and clearance.Computational Biology and Chemistry53:277–291
DOI 10.1016/j.compbiolchem.2014.10.003.
Bailey ST, Shin H, Westerling T, Liu XS, Brown M. 2012.Estrogen receptor prevents p53-dependent apoptosis in breast cancer.Proceedings of the Na-tional Academy of Sciences of the United States of America109:18060–18065
DOI 10.1073/pnas.1018858109.
Baselga J, Albanell J, Ruiz A, Lluch A, Gascon P, Guillem V, Gonzalez S, Sauleda S, Marimon I, Tabernero JM, Koehler MT, Rojo F. 2005.Phase II and tumor pharmacodynamic study of gefitinib in patients with advanced breast cancer.Journal of Clinical Oncology23:5323–5333DOI 10.1200/JCO.2005.08.326.
Berger CE, Qian Y, Liu G, Chen H, Chen X. 2012.p53, a target of estrogen receptor (ER) α, modulates DNA damage-induced growth suppression in ER-positive breast cancer cells.Journal of Biological Chemistry287:30117–30127
DOI 10.1074/jbc.M112.367326.
Bernot G, Comet J-P, Khalis Z. 2008.Gene regulatory networks with multiplexes. In: European simulation and modelling conference proceedings, 423–432.
Bernot G, Comet JP, Richard A, Guespin J. 2004.Application of formal methods to biological regulatory networks: extending Thomas’ asynchronous logical approach with temporal logic.Journal of Theoretical Biology229:339–347
DOI 10.1016/j.jtbi.2004.04.003.
Blätke M, Heiner M, Marwan W. 2011.Tutorial-petri nets in systems biology. Technical report. Otto von Guericke University Magdeburg, Magdeburg Centre for Systems Biology, Magdeburg.
Brauer W, Reisig W, Rozenberg G. 2006.Petri nets: central models and their properties: advances in petri nets 1986, part I proceedings of an advanced course bad honnef, 8.–19. September 1986. Berlin, Heidelberg: Springer.
Caldon CE. 2014.Estrogen signaling and the DNA damage response in hormone
Cancer Genome Atlas Network. 2012.Comprehensive molecular portraits of human breast tumours.Nature490:61–70DOI 10.1038/nature11412.
Carrillo M, Góngora PA, Rosenblueth D. 2012.An overview of existing modeling tools making use of model checking in the analysis of biochemical networks.Frontiers in Plant Science3DOI 10.3389/fpls.2012.00155.
Chaouiya C. 2007.Petri net modelling of biological networks.Briefings in bioinformatics 8:210–219DOI 10.1093/bib/bbm029.
Chitnis MM, Yuen JS, Protheroe AS, Pollak M, Macaulay VM. 2008.The type 1 insulin-like growth factor receptor pathway.Clinical Cancer Research14:6364–6370
DOI 10.1158/1078-0432.CCR-07-4879.
Ciliberto A, Novák B, Tyson JJ. 2005.Steady states and oscillations in the p53/Mdm2 network.Cell Cycle 4:488–493DOI 10.4161/cc.4.3.1548.
Clarke EM, Emerson EA. 1982.Design and synthesis of synchronization skeletons using branching time temporal logic. In:Logic of programs, workshop. Berlin, Heidelberg: Springer, 52–71.
Clarke EM, Grumberg O, Peled DA. 1999.Model checking. Cambridge: MIT Press. David R, Alla H. 2008.Discrete, continuous, and hybrid Petri nets.IEEE Control Systems
28:81–84.
De Jong H. 2002.Modeling and simulation of genetic regulatory systems: a literature re-view.Journal of Computational Biology9:67–103DOI 10.1089/10665270252833208. DeSantis C, Ma J, Bryan L, Jemal A. 2014.Breast cancer statistics, 2013.CA: A Cancer
Journal for Clinicians64(1):52–62DOI 10.3322/caac.21203.
Dickler MN, Cobleigh MA, Miller KD, Klein PM, Winer EP. 2009.Efficacy and safety of erlotinib in patients with locally advanced or metastatic breast cancer.Breast Cancer Research and Treatment 115:115–121 DOI 10.1007/s10549-008-0055-9.
Ewing GP, Goff LW. 2010.The insulin-like growth factor signaling pathway as a target for treatment of colorectal carcinoma.Clinical Colorectal Cancer9:219–223
DOI 10.3816/CCC.2010.n.032.
Fagan DH, Yee D. 2008.Crosstalk between IGF1R and estrogen receptor signaling in breast cancer.Journal of Mammary Gland Biology and Neoplasia13:423–429
DOI 10.1007/s10911-008-9098-0.
Ferlay J, Soerjomataram I, Dikshit R, Eser S, Mathers C, Rebelo M, Parkin DM, Forman D, Bray F. 2015.Cancer incidence and mortality worldwide: sources, methods and major patterns in GLOBOCAN 2012.International Journal of Cancer 136:E359–E386 DOI 10.1002/ijc.29210.
Fisher B, Costantino J, Redmond C, Poisson R, Bowman D, Couture J, Dimitrov NV, Wolmark N, Wickerham DL, Fisher ER. 1989.A randomized clinical trial evaluating tamoxifen in the treatment of patients with node-negative breast cancer who have estrogen-receptor–positive tumors.New England Journal of Medicine320:479–484
DOI 10.1056/NEJM198902233200802.
Gallardo A, Lerma E, Escuin D, Tibau A, Munoz J, Ojeda B, Barnadas A, Adrover E, Sánchez-Tejada L, Giner D. 2012.Increased signalling of EGFR and IGF1R, and deregulation of PTEN/PI3K/Akt pathway are related with trastuzumab resistance in HER2 breast carcinomas.British Journal of Cancer106:1367–1373
DOI 10.1038/bjc.2012.85.
García-Becerra R, Santos N, Díaz L, Camacho J. 2012.Mechanisms of resistance to endocrine therapy in breast cancer: focus on signaling pathways, miRNAs and genetically based resistance.International Journal of Molecular Sciences14:108–145
DOI 10.3390/ijms14010108.
Giacinti L, Claudio PP, Lopez M, Giordano A. 2006.Epigenetic information and estrogen receptor alpha expression in breast cancer.The Oncologist11:1–8. Giovannucci E. 2001.Insulin, insulin-like growth factors and colon cancer: a review of
the evidence.The Journal of Nutrition131:3109S–3120S.
Gueven N, Keating KE, Chen P, Fukao T, Khanna KK, Watters D, Rodemann PH, Lavin MF. 2001.Epidermal growth factor sensitizes cells to ionizing radiation by down-regulating protein mutated in ataxia-telangiectasia.Journal of Biological Chemistry 276:8884–8891DOI 10.1074/jbc.M006190200.
Hanstein B, Djahansouzi S, Dall P, Beckmann M, Bender H. 2004.Insights into the molecular biology of the estrogen receptor define novel therapeutic targets for breast cancer.European Journal of Endocrinology150:243–255 DOI 10.1530/eje.0.1500243. Hartog H, Van der Graaf WT, Boezen HM, Wesseling J. 2012.Treatment of breast
cancer cells by IGF1R tyrosine kinase inhibitor combined with conventional systemic drugs.Anticancer Research32:1309–1318.
Heiner M, Herajy M, Liu F, Rohr C, Schwarick M. 2012. Snoopy–a unifying Petri net tool. In: Haddad S, Pomello L, eds.Application and theory of petri nets: 33rd international conference, PETRI NETS 2012, Hamburg, Germany, June 25–29, 2012 proceedings. Berlin, Heidelberg: Springer, 398–407.
Heinrich R, Schuster S. 1998.The modelling of metabolic systems. structure, control and optimality.Biosystems47:61–77DOI 10.1016/S0303-2647(98)00013-6.
Hong B, Van den Heuvel PJ, Prabhu VV, Zhang S, El-Deiry WS. 2014.Targeting tumor suppressor p53 for cancer therapy: strategies, challenges and opportunities.Current Drug Targets15:80–89DOI 10.2174/1389450114666140106101412.
Hotes JL, Ellison LF, Howe HL, Friesen I, Kohler B. 2004.Variation in breast cancer counts using SEER and IARC multiple primary coding rules.Cancer Causes Control 15:185–191DOI 10.1023/B:CACO.0000019505.97836.7d.
Hurvitz SA, Pietras RJ. 2008.Rational management of endocrine resistance in breast cancer: a comprehensive review of estrogen receptor biology, treatment options, and future directions.Cancer113:2385–2397DOI 10.1002/cncr.23875.
Jackson JG, Zhang X, Yoneda T, Yee D. 2001.Regulation of breast cancer cell motility by insulin receptor substrate-2 (IRS-2) in metastatic variants of human breast cancer cell lines.Oncogene20:7318–7325DOI 10.1038/sj.onc.1204920.
Kang HS, Ahn SH, Mishra SK, Hong KM, Lee ES, Shin KH, Ro J, Lee KS, Kim MK. 2014. Association of polymorphisms and haplotypes in the insulin-like growth factor 1 receptor (IGF1R) gene with the risk of breast cancer in Korean women.PLoS ONE 9:e84532DOI 10.1371/journal.pone.0084532.
Kang H, Yi Y, Kim H, Hong Y, Seong Y, Bae I. 2012a.BRCA1 negatively regulates IGF-1 expression through an estrogen-responsive element-like site.Cell Death & Disease 3:e336DOI 10.1038/cddis.2012.78.
Kang HJ, Yi YW, Kim HJ, Hong YB, Seong YS, Bae I. 2012b.BRCA1 negatively regulates IGF-1 expression through an estrogen-responsive element-like site.Cell Death Dis 3:e336DOI 10.1210/mend.8.1.7512194.
Kato H, Faria TN, Stannard B, Roberts Jr CT, LeRoith D. 1994.Essential role of tyrosine residues 1131, 1135, and 1136 of the insulin-like growth factor-I (IGF-I) receptor in IGF-I action.Molecular Endocrinology8:40–50.
Khalis Z, Comet J-P, Richard A, Bernot G. 2009.The SMBioNet method for discovering models of gene regulatory networks.Genes, Genomes and Genomics3:15–22.
Kim K, Burghardt R, Barhoumi R, Lee S-O, Liu X, Safe S. 2011.MDM2 regulates estrogen receptorαand estrogen responsiveness in breast cancer cells.Journal of Molecular Endocrinology46:67–79.
Knowlden JM, Hutcheson IR, Barrow D, Gee JMW, Nicholson RI. 2005.Insulin-like growth factor-I receptor signaling in tamoxifen-resistant breast cancer: a supporting role to the epidermal growth factor receptor.Endocrinology146:4609–4618
DOI 10.1210/en.2005-0247.
Komarova EA, Kondratov RV, Wang K, Christov K, Golovkina TV, Goldblum JR, Gudkov AV. 2004.Dual effect of p53 on radiation sensitivity in vivo: p53 promotes hematopoietic injury, but protects from gastro-intestinal syndrome in mice. Oncogene23:3265–3271DOI 10.1038/sj.onc.1207494.
Law JH, Habibi G, Hu K, Masoudi H, Wang MY, Stratford AL, Park E, Gee JM, Finlay P, Jones HE, Nicholson RI, Carboni J, Gottardis M, Pollak M, Dunn SE. 2008. Phosphorylated insulin-like growth factor-i/insulin receptor is present in all breast cancer subtypes and is related to poor survival.Cancer Research68:10238–10246
DOI 10.1158/0008-5472.CAN-08-2755.
Lee AV, Jackson JG, Gooch JL, Hilsenbeck SG, Coronado-Heinsohn E, Osborne CK, Yee D. 1999.Enhancement of insulin-like growth factor signaling in human breast cancer: estrogen regulation of insulin receptor substrate-1 expressionin vitroandin vivo.Molecular Endocrinology13:787–796DOI 10.1210/mend.13.5.0274.
Lee JH, Paull TT. 2007.Activation and regulation of ATM kinase activity in response to DNA double-strand breaks.Oncogene26:7741–7748DOI 10.1038/sj.onc.1210872. Lee Y, Wang Y, James M, Jeong JH, You M. 2016.Inhibition of IGF1R signaling
abrogates resistance to afatinib (BIBW2992) in EGFR T790M mutant lung cancer cells.Molecular Carcinogenesis55:991–1001DOI 10.1002/mc.22342.
Liao XH, Lu DL, Wang N, Liu LY, Wang Y, Li YQ, Yan TB, Sun XG, Hu P, Zhang TC. 2014.Estrogen receptorαmediates proliferation of breast cancer MCF–7 cells via a p21/PCNA/E2F1-dependent pathway.FEBS Journal281:927–942.
Liu J, Desai KV, Li Y, Banu S, Lee YK, Qu D, Heikkinen T, Aaltonen K, Muranen TA, Kajiji TS, Bonnard C, Aittomaki K, Von Smitten K, Blomqvist C, Hopper JL, Southey MC, Brauch H, Chenevix-Trench G, Beesley J, Spurdle AB, Chen X, Czene K, Hall P, Nevanlinna H, Liu ET. 2009.Germ-line variation at a functional p53 binding site increases susceptibility to breast cancer development.HUGO Journal 3:31–40DOI 10.1007/s11568-010-9138-x.
Liu W, Konduri SD, Bansal S, Nayak BK, Rajasekaran SA, Karuppayil SM, Rajasekaran AK, Das GM. 2006.Estrogen receptor-alpha binds p53 tumor suppressor protein directly and represses its function.Journal of Biological Chemistry281:9837–9840
DOI 10.1074/jbc.C600001200.
Lu Y, Zi X, Zhao Y, Mascarenhas D, Pollak M. 2001.Insulin-like growth factor-I
receptor signaling and resistance to trastuzumab (Herceptin).Journal of the National Cancer Institute93:1852–1857DOI 10.1093/jnci/93.24.1852.
Ma L, Wagner J, Rice JJ, Hu W, Levine AJ, Stolovitzky GA. 2005.A plausible model for the digital response of p53 to DNA damage.Proceedings of the Na-tional Academy of Sciences of the United States of America102:14266–14271
DOI 10.1073/pnas.0501352102.
Ma Y, Fan S, Hu C, Meng Q, Fuqua SA, Pestell RG, Tomita YA, Rosen EM. 2010. BRCA1 regulates acetylation and ubiquitination of estrogen receptor-α.Molecular endocrinology24:76–90DOI 10.1210/me.2009-0218.
Macgregor JI, Jordan VC. 1998.Basic guide to the mechanisms of antiestrogen action. Pharmacological Reviews50:151–196.
MacLachlan TK, Takimoto R, El-Deiry WS. 2002.BRCA1 directs a selective p53-dependent transcriptional response towards growth arrest and DNA repair targets. Molecular and Cellular Biology 22:4280–4292
DOI 10.1128/MCB.22.12.4280-4292.2002.
Madeira M, Mattar A, Logullo AF, Soares FA, Gebrim LH. 2013.Estrogen receptor alpha/beta ratio and estrogen receptor beta as predictors of endocrine therapy responsiveness-a randomized neoadjuvant trial comparison between anastrozole and tamoxifen for the treatment of postmenopausal breast cancer.BMC Cancer13:425
DOI 10.1186/1471-2407-13-425.
Madigan MP, Ziegler RG, Benichou J, Byrne C, Hoover RN. 1995.Proportion of breast cancer cases in the United States explained by well-established risk factors.Journal of the National Cancer Institute87:1681–1685DOI 10.1093/jnci/87.22.1681.
Malaguarnera R, Belfiore A. 2014.The emerging role of insulin and insulin-like growth factor signaling in cancer stem cells.Frontiers in Endocrinology 5 DOI 10.3389/fendo.2014.00010.
McPherson K, Steel CM, Dixon JM. 2000.ABC of breast diseases. Breast cancer-epidemiology, risk factors, and genetics.BMJ 321:624–628
Miller LD, Smeds J, George J, Vega VB, Vergara L, Ploner A, Pawitan Y, Hall P, Klaar S, Liu ET, Bergh J. 2005.An expression signature for p53 status in human breast cancer predicts mutation status, transcriptional effects, and patient survival.Proceedings of the National Academy of Sciences of the United States of America102:13550–13555
DOI 10.1073/pnas.0506230102.
Moerkens M, Zhang Y, Wester L, Van de Water B, Meerman JH. 2014.Epidermal growth factor receptor signalling in human breast cancer cells operates parallel to estrogen receptorαsignalling and results in tamoxifen insensitive proliferation. BMC Cancer14:283 DOI 10.1186/1471-2407-14-283.
Mullan PB, Quinn JE, Harkin DP. 2006.The role of BRCA1 in transcriptional regulation and cell cycle control.Oncogene25:5854–5863DOI 10.1038/sj.onc.1209872.
Nadji M, Gomez-Fernandez C, Ganjei-Azar P, Morales AR. 2005. Immunohis-tochemistry of estrogen and progesterone receptors reconsidered: experience with 5,993 breast cancers.American Journal of Clinical Pathology 123:21–27
DOI 10.1309/4WV79N2GHJ3X1841.
Osborne C, Wakeling A, Nicholson R. 2004.Fulvestrant: an oestrogen receptor antagonist with a novel mechanism of action.British Journal of Cancer90:S2–S6
DOI 10.1038/sj.bjc.6601629.
Ouban A, Muraca P, Yeatman T, Coppola D. 2003.Expression and distribution of insulin-like growth factor-1 receptor in human carcinomas.Human Pathology 34:803–808DOI 10.1016/S0046-8177(03)00291-0.
Paige LA, Christensen DJ, Grøn H, Norris JD, Gottlin EB, Padilla KM, Chang C-Y, Ballas LM, Hamilton PT, McDonnell DP. 1999.Estrogen receptor (ER) modulators each induce distinct conformational changes in ERαand ERβ.Proceedings of
the National Academy of Sciences of the United States of America96:3999–4004
DOI 10.1073/pnas.96.7.3999.
Paracha RZ, Ahmad J, Ali A, Hussain R, Niazi U, Tareen SHK, Aslam B. 2014.Formal modelling of toll like receptor 4 and JAK/STAT signalling pathways: insight into the roles of SOCS-1, interferon-βand proinflammatory cytokines in sepsis.
Parkin DM, Fernandez LM. 2006.Use of statistics to assess the global burden of breast cancer.The Breast Journal12(Suppl 1):S70–S80
DOI 10.1111/j.1075-122X.2006.00205.x.
Peres S, Jean-Paul C. 2003. Contribution of computational tree logic to biological regulatory networks: example from pseudomonas aeruginosa. In: Priami C, ed. Computational methods in systems biology: first international workshop, CMSB 2003 Rovereto, Italy, February 24–26, 2003 proceedings. Berlin, Heidelberg: Springer, 47–56.
Perou CM, Sorlie T, Eisen MB, Van de Rijn M, Jeffrey SS, Rees CA, Pollack JR, Ross DT, Johnsen H, Akslen LA, Fluge O, Pergamenschikov A, Williams C, Zhu SX, Lonning PE, Borresen-Dale AL, Brown PO, Botstein D. 2000.Molecular portraits of human breast tumours.Nature406:747–752DOI 10.1038/35021093.
Petri CA, Reisig W. 2008.Petri net.Scholarpedia3(4):6477
Pietras RJ. 2006.Biologic basis of sequential and combination therapies for hormone-responsive breast cancer.The Oncologist11:704–717
DOI 10.1634/theoncologist.11-7-704.
Pnueli A. 1977.The temporal logic of programs. In:Foundations of computer science, 1977, 18th annual symposium on. Piscataway: IEEE, 46–57.
Pollak M. 2008.Insulin and insulin-like growth factor signalling in neoplasia.Nature Reviews Cancer8:915–928DOI 10.1038/nrc2536.
Pollak MN. 1998.Endocrine effects of IGF-I on normal and transformed breast epithelial cells: potential relevance to strategies for breast cancer treatment and prevention. Breast Cancer Research and Treatment 47:209–217DOI 10.1023/A:1005950916707. Powers JT, Hong S, Mayhew CN, Rogers PM, Knudsen ES, Johnson DG. 2004.E2F1
uses the ATM signaling pathway to induce p53 and Chk2 phosphorylation and apoptosis.Molecular Cancer Research2:203–214.
Raju U, Molkentine DP, Valdecanas DR, Deorukhkar A, Mason KA, Buchholz TA, Meyn RE, Ang KK, Skinner H. 2015.Inhibition of EGFR or IGF-1R signaling enhances radiation response in head and neck cancer models but concurrent inhibition has no added benefit.Cancer Medicine4:65–74DOI 10.1002/cam4.345. Renoir J-M, Marsaud V, Lazennec G. 2013.Estrogen receptor signaling as a target
for novel breast cancer therapeutics.Biochemical Pharmacology85:449–465
DOI 10.1016/j.bcp.2012.10.018.
Rhodes A, Jasani B, Balaton AJ, Barnes DM, Miller KD. 2000.Frequency of oestro-gen and progesterone receptor positivity by immunohistochemical analysis in 7016 breast carcinomas: correlation with patient age, assay sensitivity, threshold value, and mammographic screening.Journal of Clinical Pathology53:688–696
DOI 10.1136/jcp.53.9.688.
Richard A, Comet J-P, Bernot G. 2006. Formal methods for modeling biological
regulatory networks. In:Modern Formal Methods and Applications. Springer, 83–122. Richard A, Rossignol G, Comet J-P, Bernot G, Guespin-Michel J, Merieau A. 2012.
Boolean models of biosurfactants production in Pseudomonas fluorescens.PLoS ONE7:24651DOI 10.1371/journal.pone.0024651.
Riedemann J, Macaulay VM. 2006.IGF1R signalling and its inhibition. Endocrine-Related Cancer13(Suppl 1):S33–S43DOI 10.1677/erc.1.01280.
Rosen EM, Fan S, Pestell RG, Goldberg ID. 2003.BRCA1 gene in breast cancer.Journal of Cellular Physiology196:19–41DOI 10.1002/jcp.10257.
Ruths D, Muller M, Tseng J-T, Nakhleh L, Ram PT. 2008.The signaling petri net-based simulator: a non-parametric strategy for characterizing the dynamics of cell-specific signaling networks.PLOS Computational Biology4:e1000005
DOI 10.1371/journal.pcbi.1000005.
Savage KI, Harkin DP. 2015.BRCA1, a ‘complex’protein involved in the maintenance of genomic stability.FEBS Journal282:630–646 DOI 10.1111/febs.13150.
Sayeed A, Konduri SD, Liu W, Bansal S, Li F, Das GM. 2007.Estrogen receptor alpha inhibits p53-mediated transcriptional repression: implications for the regulation of apoptosis.Cancer Research67:7746–7755DOI 10.1158/0008-5472.CAN-06-3724. Schayek H, Haugk K, Sun S, True LD, Plymate SR, Werner H. 2009.Tumor suppressor
BRCA1 is expressed in prostate cancer and controls insulin-like growth factor I receptor (IGF-IR) gene transcription in an androgen receptor-dependent manner. Clinical Cancer Research15:1558–1565DOI 10.1158/1078-0432.CCR-08-1440. Seemayer CA, Breuer E, Kroll G, Markus-Sellhaus S, Reineke TH, Mittermayer C. 2002.
Incidence and tumour stages of breast cancer in the region of Aachen, Germany. European Journal of Cancer Care11:16–24.
Sorlie T, Perou CM, Tibshirani R, Aas T, Geisler S, Johnsen H, Hastie T, Eisen MB, Van de Rijn M, Jeffrey SS, Thorsen T, Quist H, Matese JC, Brown PO, Botstein D, Lonning PE, Borresen-Dale AL. 2001.Gene expression patterns of breast carcinomas distinguish tumor subclasses with clinical implications.Proceedings of the National Academy of Sciences of the United States of America98:10869–10874
DOI 10.1073/pnas.191367098.
Sotiriou C, Neo SY, McShane LM, Korn EL, Long PM, Jazaeri A, Martiat P, Fox SB, Harris AL, Liu ET. 2003.Breast cancer classification and prognosis based on gene expression profiles from a population-based study.Proceedings of the National Academy of Sciences of the United States of America100:10393–10398
DOI 10.1073/pnas.1732912100.
Soulitzis N, Karyotis I, Delakas D, Spandidos DA. 2006.Expression analysis of peptide growth factors VEGF, FGF2, TGFB1, EGF and IGF1 in prostate cancer and benign prostatic hyperplasia.International Journal of Oncology29:305–314.
Surmacz E, Bartucci M. 2004.Role of estrogen receptor alpha in modulating IGF-I receptor signaling and function in breast cancer.Journal of Experimental and Clinical Cancer Research23:385–394.
Taunk NK, Goyal S, Moran MS, Yang Q, Parikh R, Haffty BG. 2010.Prognostic significance of IGF-1R expression in patients treated with breast-conserving surgery and radiation therapy.Radiotherapy and Oncology96:204–208
DOI 10.1016/j.radonc.2010.03.009.
Thieffry D, Thomas R. 1995.Dynamical behaviour of biological regulatory networks— II. Immunity control in bacteriophage lambda.Bulletin of Mathematical Biology 57:277–297.
Thomas R. 1973.Boolean formalization of genetic control circuits.Journal of Theoretical Biology42:563–585DOI 10.1016/0022-5193(73)90247-6.
Thomas R. 1998.Laws for the dynamics of regulatory networks.International Journal of Developmental Biology42:479–485.
Thomas R. 2013.Kinetic logic: a Boolean approach to the analysis of complex regulatory systems: proceedings of the EMBO course ‘‘formal analysis of genetic regulation", held in Brussels, September 6–16, 1977. Berlin, Heidelberg: Springer Science & Business Media.
Thomas R, D’Ari R. 1990.Biological feedback. Boca Raton: CRC press.
Thomas R, Gathoye AM, Lambert L. 1976.A complex control circuit.European Journal of Biochemistry 71:211–227DOI 10.1111/j.1432-1033.1976.tb11108.x.
Thomas R, Kaufman M. 2001a.Multistationarity, the basis of cell differentiation and memory. I. Structural conditions of multistationarity and other nontrivial behavior. Chaos11:170–179DOI 10.1063/1.1350439.
Thomas R, Kaufman M. 2001b.Multistationarity, the basis of cell differentiation and memory. II. Logical analysis of regulatory networks in terms of feedback circuits. Chaos11:180–195DOI 10.1063/1.1349893.
Thomas R, Kaufman M. 2002.Conceptual tools for the integration of data.Comptes Rendus Biologies325:505–514DOI 10.1016/S1631-0691(02)01452-X.
Thomas R, Thieffry D, Kaufman M. 1995.Dynamical behaviour of biological regulatory networks–I. Biological role of feedback loops and practical use of the concept of the loop-characteristic state.Bulletin of Mathematical Biology57:247–276
DOI 10.1007/BF02460618.
Van Asten K, Neven P, Lintermans A, Wildiers H, Paridaens R. 2014.Aromatase inhibitors in the breast cancer clinic: focus on exemestane.Endocrine-Related Cancer 21:R31–R49DOI 10.1530/ERC-13-0269.
Vivanco I, Sawyers CL. 2002.The phosphatidylinositol 3-kinase–AKT pathway in human cancer.Nature Reviews Cancer2:489–501DOI 10.1038/nrc839.
Von Minckwitz G, Jonat W, Fasching P, Du Bois A, Kleeberg U, Luck HJ, Kettner E, Hilfrich J, Eiermann W, Torode J, Schneeweiss A. 2005.A multicentre phase II study on gefitinib in taxane- and anthracycline-pretreated metastatic breast cancer. Breast Cancer Research and Treatment 89:165–172DOI 10.1007/s10549-004-1720-2. Wakeling AE, Dukes M, Bowler J. 1991.A potent specific pure antiestrogen with clinical
potential.Cancer Research51:3867–3873.
Wang L, Di L-J. 2014.BRCA1 and estrogen/estrogen receptor in breast cancer: where they interact?International Journal of Biological Sciences10:566–575
DOI 10.7150/ijbs.8579.
Watters JJ, Chun TY, Kim YN, Bertics PJ, Gorski J. 2000.Estrogen modulation of prolactin gene expression requires an intact mitogen-activated protein kinase signal transduction pathway in cultured rat pituitary cells.Molecular Endocrinology 14:1872–1881DOI 10.1210/mend.14.11.0551.