Breast Carcinoma Patients
Lars Tore Gyland Mikalsen1*, Hari Prasad Dhakal2, Øyvind S. Bruland3,4, Bjørn Naume3,4, Elin Borgen2,
Jahn M. Nesland2,4, Dag Rune Olsen5
1Department of Physics, University of Oslo, Oslo, Norway,2Department of Pathology, The Norwegian Radium Hospital, Oslo University Hospital HF, Oslo, Norway,
3Department of Oncology, The Norwegian Radium Hospital, Oslo University Hospital, Oslo, Norway,4Institute for Clinical Medicine, University of Oslo, Oslo, Norway,
5Faculty of Mathematics and Natural Sciences, University of Bergen, Bergen, Norway
Abstract
Angiogenesis quantification, through vessel counting or area estimation in the most vascular part of the tumour, has been found to be of prognostic value across a range of carcinomas, breast cancer included. We have applied computer image analysis to quantify vascular properties pertaining to size, shape and spatial distributions in photographed fields of CD34 stained sections. Aided by a pilot (98 cases), seven parameters were selected and validated on a separate set from 293 breast cancer patients. Two new prognostic markers were identified through continuous Cox regression with endpoints Breast Cancer Specific Survival and Distant Disease Free Survival: The average size of the vessels as measured by their perimeter (p = 0.003 and 0.004, respectively), and the average complexity of the vessel shapes measured by their solidity (p = 0.004 and 0.004). The Hazard ratios for the corresponding median-dichotomized markers were 2.28 (p = 0.005) and 1.89 (p = 0.016) for the mean perimeter and 1.80 (p = 0.041) and 1.55 (p = 0.095) for the shape complexity. The markers were associated with poor histologic type, high grade, necrosis, HR negativity, inflammation, and p53 expression (vessel size only). Both markers were found to strongly influence the prognostic properties of vascular invasion (VI) and disseminated tumour cells in the bone marrow. The latter being prognostic only in cases with large vessels (p = 0.004 and 0.043) or low complexity (p = 0.018 and 0.024), but not in the small or complex vessel groups (p.0.47). VI was significant in all groups, but showed greater hazard ratios for small and low complexity vessels (6.54–11.2) versus large and high complexity vessels (2.64–3.06). We find that not only the overall amount of produced vasculature in angiogenic hot-spots is of prognostic significance, but also the morphological appearance of the generated vessels,i.e.the size and shape of vessels in the
studied hot spots.
Citation:Mikalsen LTG, Dhakal HP, Bruland ØS, Naume B, Borgen E, et al. (2013) The Clinical Impact of Mean Vessel Size and Solidity in Breast Carcinoma Patients. PLoS ONE 8(10): e75954. doi:10.1371/journal.pone.0075954
Editor:Ichiro Aoki, Yokohama City University School of Medicine, Japan
ReceivedMay 15, 2013;AcceptedAugust 17, 2013;PublishedOctober 11, 2013
Copyright:ß2013 Mikalsen et al. This is an open-access article distributed under the terms of the Creative Commons Attribution License, which permits unrestricted use, distribution, and reproduction in any medium, provided the original author and source are credited.
Funding:The financial support from the European Union 7th Framework Programme (grant 222741 – METOXIA) is greatly appreciated. The funders had no role in study design, data collection and analysis, decision to publish, or preparation of the manuscript.
Competing Interests:The authors have declared that no competing interests exist. * E-mail: [email protected]
Introduction
Angiogenesis is a requirement for tumour growth beyond 1– 2 mm3[1]. The produced neo-vasculature usually exhibits a broad range of pathological features, including increased permeability, loss of architecture, and extensive inter tumour variability [2–4]. Once formed, it facilitates tumour growth and the metastatic process [1,5].
Both angiogenesis [6,7], disseminated tumour cells in the bone marrow (DTC) [8], and, in particular, the presence of tumour cells inside lymph- or blood vessels, i.e. vascular invasion (VI) [9,10], are associated with an increased risk of future metastasis in breast cancer. Furthermore, angiogenesis has been found to be associated with DTC [11,12], and influence the prognostic properties of both DTC and VI [13,14].
Quantification of angiogenesis in the most vascular region of the tumour, i.e. the ‘‘hot-spot’’, has been well studied and found to be a prognostic factor in a range of carcinomas [15–18] including breast cancer [6,7,13,19–23]. The most common method is to manually count the number of vessels in a fixed size field (MVD) [19,24]. However, due to its increased reliability, the Chalkley
count (CC), a relative area estimate, has been recommended for use in solid tumours by an international consensus report on angiogenesis quantification [25]. Nevertheless, the methods have not provided the robustness and reproducibility required for clinical use [6,25,26]. In studies applying both MVD and CC to breast cancer, only the latter was a significant prognostic marker [16,22,27]. Thus, the specific vascular quantity is of clinical significance. However, morphometric characteristics of the microvessels or distribution parameters may have equal impor-tance [28–32], but have so far not been elucidated in breast cancer [33,34].
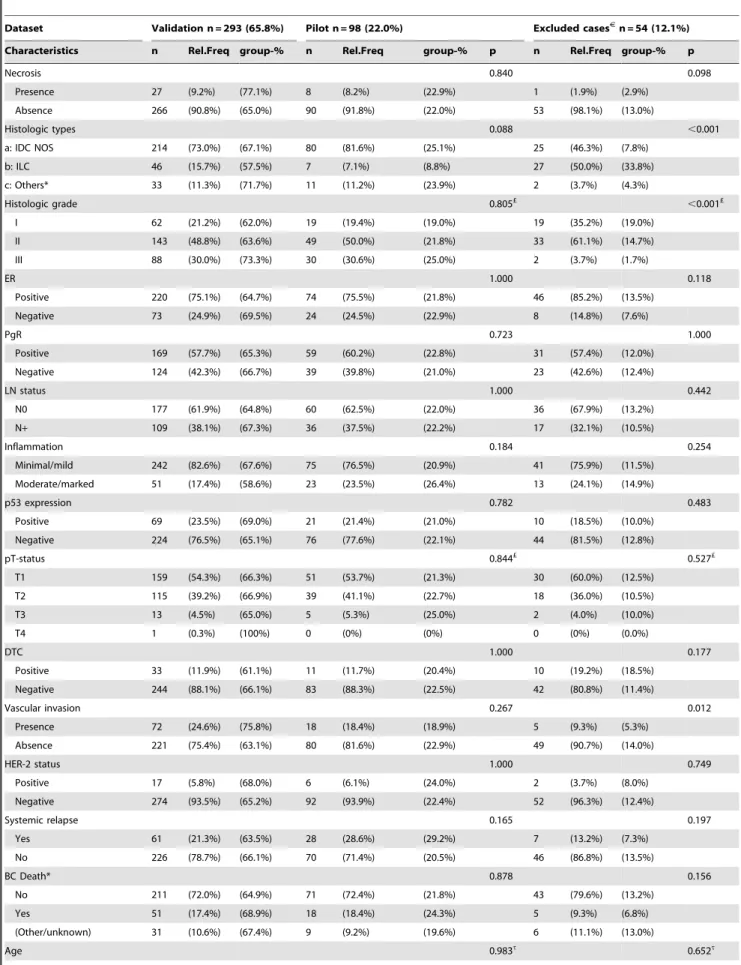
Table 1.Clinico-pathologic characteristics for patients in the different groups.
Dataset Validation n = 293 (65.8%) Pilot n = 98 (22.0%) Excluded casesJ
n = 54 (12.1%)
Characteristics n Rel.Freq group-% n Rel.Freq group-% p n Rel.Freq group-% p
Necrosis 0.840 0.098
Presence 27 (9.2%) (77.1%) 8 (8.2%) (22.9%) 1 (1.9%) (2.9%)
Absence 266 (90.8%) (65.0%) 90 (91.8%) (22.0%) 53 (98.1%) (13.0%)
Histologic types 0.088 ,0.001
a: IDC NOS 214 (73.0%) (67.1%) 80 (81.6%) (25.1%) 25 (46.3%) (7.8%)
b: ILC 46 (15.7%) (57.5%) 7 (7.1%) (8.8%) 27 (50.0%) (33.8%)
c: Others* 33 (11.3%) (71.7%) 11 (11.2%) (23.9%) 2 (3.7%) (4.3%)
Histologic grade 0.805£
,0.001£
I 62 (21.2%) (62.0%) 19 (19.4%) (19.0%) 19 (35.2%) (19.0%)
II 143 (48.8%) (63.6%) 49 (50.0%) (21.8%) 33 (61.1%) (14.7%)
III 88 (30.0%) (73.3%) 30 (30.6%) (25.0%) 2 (3.7%) (1.7%)
ER 1.000 0.118
Positive 220 (75.1%) (64.7%) 74 (75.5%) (21.8%) 46 (85.2%) (13.5%)
Negative 73 (24.9%) (69.5%) 24 (24.5%) (22.9%) 8 (14.8%) (7.6%)
PgR 0.723 1.000
Positive 169 (57.7%) (65.3%) 59 (60.2%) (22.8%) 31 (57.4%) (12.0%)
Negative 124 (42.3%) (66.7%) 39 (39.8%) (21.0%) 23 (42.6%) (12.4%)
LN status 1.000 0.442
N0 177 (61.9%) (64.8%) 60 (62.5%) (22.0%) 36 (67.9%) (13.2%)
N+ 109 (38.1%) (67.3%) 36 (37.5%) (22.2%) 17 (32.1%) (10.5%)
Inflammation 0.184 0.254
Minimal/mild 242 (82.6%) (67.6%) 75 (76.5%) (20.9%) 41 (75.9%) (11.5%)
Moderate/marked 51 (17.4%) (58.6%) 23 (23.5%) (26.4%) 13 (24.1%) (14.9%)
p53 expression 0.782 0.483
Positive 69 (23.5%) (69.0%) 21 (21.4%) (21.0%) 10 (18.5%) (10.0%)
Negative 224 (76.5%) (65.1%) 76 (77.6%) (22.1%) 44 (81.5%) (12.8%)
pT-status 0.844£ 0.527£
T1 159 (54.3%) (66.3%) 51 (53.7%) (21.3%) 30 (60.0%) (12.5%)
T2 115 (39.2%) (66.9%) 39 (41.1%) (22.7%) 18 (36.0%) (10.5%)
T3 13 (4.5%) (65.0%) 5 (5.3%) (25.0%) 2 (4.0%) (10.0%)
T4 1 (0.3%) (100%) 0 (0%) (0%) 0 (0%) (0.0%)
DTC 1.000 0.177
Positive 33 (11.9%) (61.1%) 11 (11.7%) (20.4%) 10 (19.2%) (18.5%)
Negative 244 (88.1%) (66.1%) 83 (88.3%) (22.5%) 42 (80.8%) (11.4%)
Vascular invasion 0.267 0.012
Presence 72 (24.6%) (75.8%) 18 (18.4%) (18.9%) 5 (9.3%) (5.3%)
Absence 221 (75.4%) (63.1%) 80 (81.6%) (22.9%) 49 (90.7%) (14.0%)
HER-2 status 1.000 0.749
Positive 17 (5.8%) (68.0%) 6 (6.1%) (24.0%) 2 (3.7%) (8.0%)
Negative 274 (93.5%) (65.2%) 92 (93.9%) (22.4%) 52 (96.3%) (12.4%)
Systemic relapse 0.165 0.197
Yes 61 (21.3%) (63.5%) 28 (28.6%) (29.2%) 7 (13.2%) (7.3%)
No 226 (78.7%) (66.1%) 70 (71.4%) (20.5%) 46 (86.8%) (13.5%)
BC Death* 0.878 0.156
No 211 (72.0%) (64.9%) 71 (72.4%) (21.8%) 43 (79.6%) (13.2%)
Yes 51 (17.4%) (68.9%) 18 (18.4%) (24.3%) 5 (9.3%) (6.8%)
(Other/unknown) 31 (10.6%) (67.4%) 9 (9.2%) (19.6%) 6 (11.1%) (13.0%)
Materials and Methods
Ethics Statement
Ethics approval for this study was obtained from the Regional Committee for Medical and Health Research Ethics (REC South East, Permit Number: S-97103). Written consent was obtained from all patients enrolled in the study.
Patients and Tumours
CD34-immunostained sections from 394 patients out of the 920 enrolled in the Oslo Breast Cancer Micrometastasis Project from 1995 to 1998 were examined. The current study is based on a subset of the material previously reported on regarding the prognostic significance and clinico-pathological associations of DTC and tumour vascularity [13,27,36–38]. Cases were selected based on the availability and adequacy of primary tumour material for immunohistochemistry, with further exclusion of cases with disturbing CD34+stromal elements (fibrocytes).
The material has a known significant impact from angiogenesis quantification using CC, but not MVD [27]. Clinico-pathological information was obtained from the database of the Oslo Breast Cancer Micrometastasis Study (Table 1). The patients were between 30 and 89 years (median 58). Seventy percent had received breast conservation surgery and 30% modified radical mastectomy. Out of 377 patients with information of non-surgical treatment, 22% received radiation therapy, 29% post operative adjuvant systemic therapy (chemotherapy and/or tamoxifen), while 25% received both. Patients undergoing preoperative chemotherapy or who developed metastasis prior to, or within one month of surgery were not included in the study. The follow-up time was from 1 to 125 months (median 85). Out of 385 patients with available information about relapse, 89 suffered systemic relapse; 36 patients (9%) had local recurrence. Out of the 391 patients, 69 died of breast cancer disease. Pathological tumour sizes were T1: 210, T2: 154 and T3–4: 18 cases. There were 237 node-negative patients. Tumours were graded according to Elston and Ellis [39]: G-I: 62, G-II: 143 and G-III: 88. Histologic types were according to WHO recommendations [9], there were 214 infiltrating ductal carcinoma not otherwise specified (IDC-NOS), 46 invasive lobular carcinoma (ILC) and 33 cases belonging to other types. VI was assessed in H&E-stained sections. The assessment of DTC by bone marrow aspiration from the iliac crest, its processing and evaluation has been previously described [37]. There were 90 cases with VI and 44 with DTC. The excluded cases (due to the presence of CD34+fibrocytes [40,41]) were associated with the ILC type, low tumour grade and VI-negativity, but were not significantly associated with survival end points (Table 1).
Immunohistochemistry
Paraffin-embedded blocks with representative tumour tissue were sectioned 4mm thick, as previously described [13]. Briefly, sections were deparaffinised and microwaved in Tris/EDTA (pH 9.0), then treated with 0.03% hydrogen peroxidase for 5 min. The sections were incubated with a CD34 monoclonal murine antibody (IgG1) QBEND-10 (Monosan, the Netherlands) at room temperature for 30 min, then with a peroxidase-labelled polymer conjugated to goat anti-mouse antibody for 30 min, and finally with 3-39-diaminobenzidine tetrahydrochloride for 10 min (Dako EnVisionTM
+System Peroxidase (DAB) (K4007; DakoCytoma-tion, CA, USA) and Dako Autostainer). Haematoxylin was used for counterstaining. Appropriate controls were included and showed satisfactory results.
Image Analysis
The image acquisition and field selection were performed as previously described [35]. Briefly, a low magnification scan in a light microscope was used to find the most vascular areas of the tumour. Three fields were photographed (image area 0.38 mm2; pixel pitch 0.34mm). The image subjectively judged to be most vascular of the three was selected for each case. Cases with CD34-positive fibroblastic cells or spindle cells in the tumour stroma [40,41] were excluded. Out of 445 photographed cases, 54 (12%) were excluded. Figure 1 shows examples of image quality and vascular characteristics.
CD34 positive pixels were automatically identified in the images, according to previously reported specifications [35].
Briefly, stains were identified from dynamically calculated intensity thresholds that identified all dark pixels, and pre-set colour hue thresholds which rejected any pixel associated with haematoxylin (i.e. blue). While determining vessel profiles from the distributions of CD34+
pixels, only gaps in the stains wider than 1.0mm were considered to be lumens, and only stained objects at least 3.5mm wide, lumens included, were considered to be microvessels. Width was defined as the diameter of the largest inscribable circle, (Figure 2A). The remaining gaps and objects were considered to be noise, artefacts or similar, and were removed. The method achieved an intraclass correlation coeffi-cient of r2= 0.96 when the number of automatically identified vessels were compared to manual counting [35].
Statistics
Survival analysis was performed using the endpoints Distant Disease Free Survival (DDFS) and Breast Cancer-Specific Survival (BCSS). Times were measured from date of surgery to event (systemic relapse and breast cancer death), or censured at last follow-up or unrelated death.
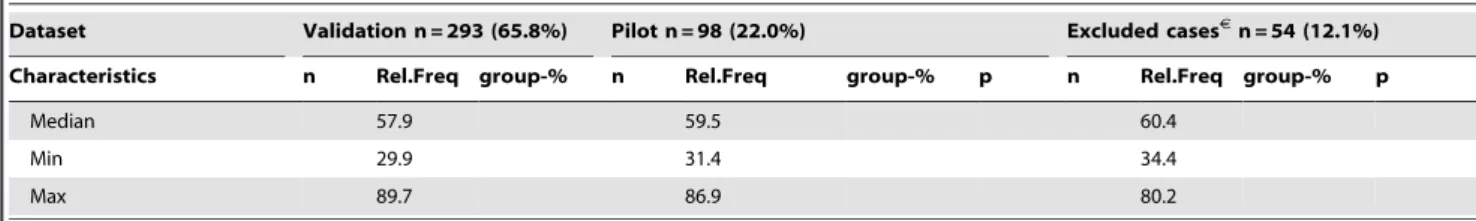
Table 1.Cont.
Dataset Validation n = 293 (65.8%) Pilot n = 98 (22.0%) Excluded casesJ
n = 54 (12.1%)
Characteristics n Rel.Freq group-% n Rel.Freq group-% p n Rel.Freq group-% p
Median 57.9 59.5 60.4
Min 29.9 31.4 34.4
Max 89.7 86.9 80.2
J
Cases excluded due to background stains. p-values: Difference in group composition compared to the validation set; by Pearsons Chi-square exact test; Linear-by-linear association exact test (p-values marked with £); t-tests (p-values marked witht).
The data material was randomly split into two parts, pilot (25%) and validation (75%). The pilot cases (n = 98; events: 28 DDFS and 18 BCSS) were used to aid parameter selection, while validation cases (n = 296; events: 61 DDFS and 51 BCSS) were used to determine prognostic significance. Seven markers were validated (see parameter selection) using a common null hypoth-esis. The Bonferroni correction was applied with significance level
a= 0.05 resulting in the test p#b=a/7 = 0.0071. Marker validity was studied using Cox proportional hazard regression analysis (Cox regression) with statistically standardized continuous vari-ables; hazard ratios (HR) correspond to an increase of one standard deviation. Markers that were significant (Wald test) for both DDFS and BCSS were considered prognostic.x2-values are reported outside the context of hypothesis testing.
Prognostic parameters were further evaluated using median cut-off categorization. All further tests were done at the 0.05 level. Kaplan Meier analysis applied the logrank test; corresponding HRs were obtained using Cox regression for high-riskvslow-risk group. Associations with clinico-pathologic parameters were tested using the Pearsons chi-square or Linear-by-linear association exact test. Multivariate Cox regression was performed with parameters restricted to about 1 variable per 10 events.
Statistical calculations were carried out using IBM SPSS Statistics (version 19); IBM, Endicott, NY, US.
Parameter Selection
Eighty-four pilot parameters were derived (cf. supporting information Pilot S1), and grouped together into six categories: a) vascular densities; b) vessel sizes; c) vessel shape characteristics; d) lumen measurements; e) distance parameters; and f) density scaling/fractal analysis parameters; (Figure 2). Using Cox regression x2-values, each parameter category was sorted according to survival performance. Based on this and findings in the literature [30,33,42–45], six promising non-density parameters were selected for validation, ensuring no strong correlations among markers, or to vascular density. Additionally, MVSmwas added directly to validation, as there were no shape complexity markers in the pilot.
Parameter names and definitions
The following markers were selected: MVPm, the mean length of the vessels’ outer perimeters; MVACV, the vessel areas’
coefficient of variation; MVArx4, the ratio of the total vascular
area (MVAS) of the field to that of the highest scoring subfield
corresponding to four times higher magnification; MVluminal, the
fraction of vessel profiles with at least one discernible lumen. MVscaleis the average slope of the vascular content vs. field size
curve in a double-logarithmic plot. The vessel profiles were first transformed to minimum connected strokes (skeleton) by removing their thickness (Figure 2A), reducing the association with MVAS.
Square subfields were then randomly distributed across the image and the average vascular content (sum of stroke-lengths) of the fields computed using fifty different field sizes ranging from 3px to the image height. Low values are associated with uniform vessel distributions and small, simple vessels. MVSmis the mean vessel solidity; i.e. the vascular area of the vessel divided by the area of its
Figure 1. CD34 section case examples.A) High MVSm; low MVPm, MVASand MVD; B) Average MVSm, high MVPmand MVAS,and low MVD; C) Low MVSm, high MVPmand MVAS, and low MVD; D) Low MVSm,
average MVPm and MVAS, and high MVD. High MVPmvalues (large vessels) and low MVSmvalues (high complexity shapes) contribute to poor prognosis; as well as high MVASvalues (high vascular area) [29],
but MVD is inconsequential [29]. doi:10.1371/journal.pone.0075954.g001
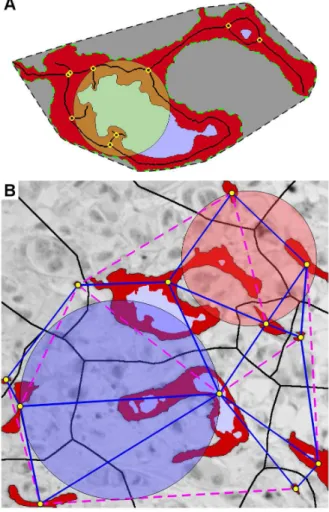
Figure 2. Illustration of the quantified vascular features. A)
Individual vessel characterization: Endothelial area (red); luminal area (blue); vessel/vascular area (red + blue); vessel perimeter (stapled green); width (diameter of imposed yellow circle); skeleton (black line); branching points (yellow markers); convex hull (interior of stapled black line, i.e. vessel+gray). B) Contextual vasculature characterization: centre of vessel (yellow markers); Neighbouring vessels according to the Gabriel’s Graph criterion (blue lines), i.e. all connections between vessels such that no other vessel centres are found within the circle spanned by the connecting line (see blue circle). Vertices which do not fit the criteria are not considered neighbours (magenta stapled lines; see red circle); equidistant watershed lines (black), each region within the black lines is closer to the enclosed vessel than any other vessel.
convex hull, i.e. the region with the shortest possible perimeter still containing the entire vessel (Figure 2A). High solidity is obtained for compact vessel profiles without branching, curvy shapes or otherwise concave regions, irrespective of elongation. ICD is the average intercapillary distance between neighbouring vessels, where neighbour is defined by the Gabriels graph criterion (Figure 2B). The calculation used vessel centre points, not the true distance between vessel boundaries.
Results
New vascular markers MVPm, MVSm
Seven parameters were tested in the validation material (Table 1). MVPm and MVSm demonstrated survival significance in continuous analysis for both endpoints (all p#0.004). HRs were 1.3 and 1.4 for DDFS and BCSS respectively, for a one standard deviation increase in perimeter length, and 0.69 and 0.71 for an increase in solidity (i.e. reduced complexity) (Table 2). Trends were seen with MVACV, MVluminal and MVscale for BCSS
(p-values 0.026–0.081).
MVPm, MVSmand Clinico-Pathological Parameters
MVPm and MVSm were found to be strongly associated with higher histologic grade, hormone receptor negativity, histologic type, presence of necrosis, moderate/marked inflammation, and p53 expression (Table 3). No associations were observed for tumour size, DTC, HER-2-status or VI.
MVPm, MVSmand Survival Analyses
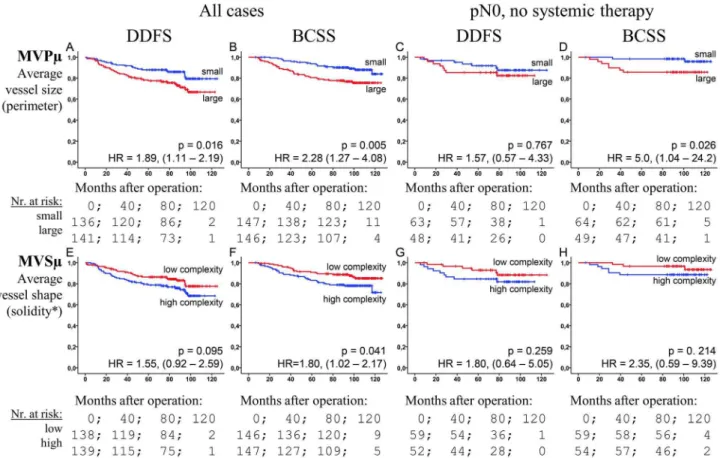
While the loss of information incurred by grouping makes it optimal to use continuous data whenever possible [34,46], grouping may be a necessary tool in clinical applications. Using median cut-offs and comparing the high risk group to the low risk, the HRs, for MVPm and MVSm respectively, were found to be 2.28 (p,0.005) and 1.80 (p = 0.041) for BCSS, and 1.89 (p = 0.016) and 1.55 (p = 0.095) for DDFS (Figure 3). In the node-negative no systemic treatment subgroup (n = 113), MVPm
showed significance for BCSS (HR = 5.0, p = 0.026) (Figure 3).
Multivariate survival analysis was performed separately for MVPm and MSVm. The models included clinico-pathological parameters that were significant in univariate survival analyses: histologic grade, LN-status, T-status, VI and hormone receptor status. In addition, systemic therapy was included. Neither marker came out significant in the multivariate model (Table 4).
MVPm, MVSm, DTC, VI and Survival
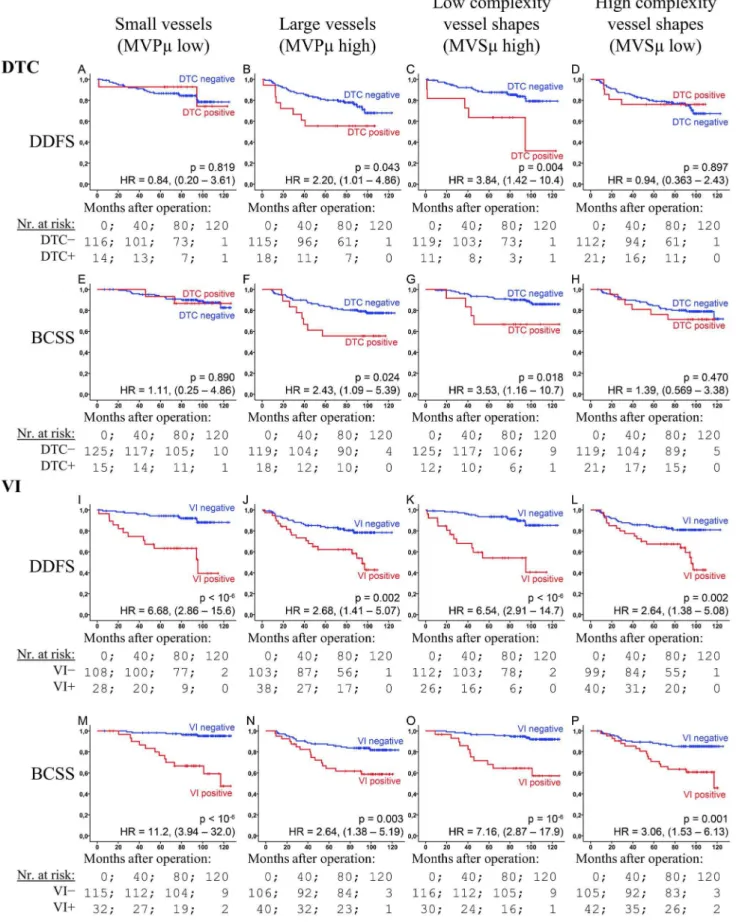
Both MVPm and MVSm were found to strongly affect the prognostic properties of DTC and VI (Figure 4). In the large vessel group both DTC and VI had a moderately-high prognostic association (HRs = 2.21–2.68; p-values = 0.002–0.043). In con-trast, the HR for VI was 6.68 (CI: 2.86–15.6) and 11.2 (3.94–32.0) in the small vessel group (for DDFS and BCSS, respectively), while DTC was insignificant (p.0.8). In the low vessel complexity group both DTC and VI demonstrated a stronger prognostic ability—all p,0.018; HR = 3.84 (1.42–10.4) and 3.53 (1.16–10.7) for DTC, and 6.54 (2.91–14.7) and 7.16 (2.87–17.9) for VI—than in the high vessel complexity group, in which VI demonstrated only moderately-high prognostic ability (HR = 2.64 and 2.06), and DTC none at all (p.0.47). HRs were in most cases (eleven out of sixteen) found to lie outside the confidence interval of the compared group (Figure 4).
Relationship between Vascular Markers
MVPmwas the highest scoring of several strongly related vessel size measurements in the pilot. The others were the mean of the vascular area (MVAm), endothelial area and vessel length (skeleton size). This result was repeated in the validation material
(DDFS-x2
-values 6.3–7.7 vs. 9.1 for MVPm; BCSS: 12.3–12.9vs.14.2; all p,0.012). Thus, all would be prognostic, but MVPm performed somewhat stronger (trend). However, total perimeter length in the field (MVPS) was not associated to survival at all (x2#1.0); it had
an eight times lowerx2
-value than the total vascular area (MVAS).
The Pearson’s correlation of MVSmto MVPmwas found to be r2= 0.35 (Kendall’s t2
= 0.21 for categorized data), while it was r2= 0.16 to MVAm. Despite being only moderately correlated, MVSm and MVPm were not independently significant in the bi-variate Cox regression model. MVSm was, however, found to
Table 2.Continuous Cox regression survival analysis of validation parameters.
DDFS BCSS
number of cases = 277 number of cases = 292
number of events = 60 number of events = 51
Parameter candidates from pilot: p HR#
p HR#
MVACV [size] 0.320 1.115 0.026 1.243
MVPm [size] 0.003* 1.286 ,0.001* 1.369
MVluminal [lumen] 0.198 1.178 0.060 1.287
MVscale [scale] 0.102 1.235 0.081 1.278
MVArx4 [scale] 0.540 1.139 0.633 0.935
ICD [pattern] 0.760 1.038 0.904 1.016
Additional parameter candidates:
MVSm [shape] 0.004* 0.706 0.004* .685
*Significant at the Bonferroni corrected 0.05/7 level.
#Hazard ratios (HR) are for one standard deviation increase in the parameter value.
MVACV: Coefficient of variation of the vessel areas. MVPm: Mean vessel perimeter length; MVluminal: Fraction of vessels with open lumen. MVscale: Marker for the vascular
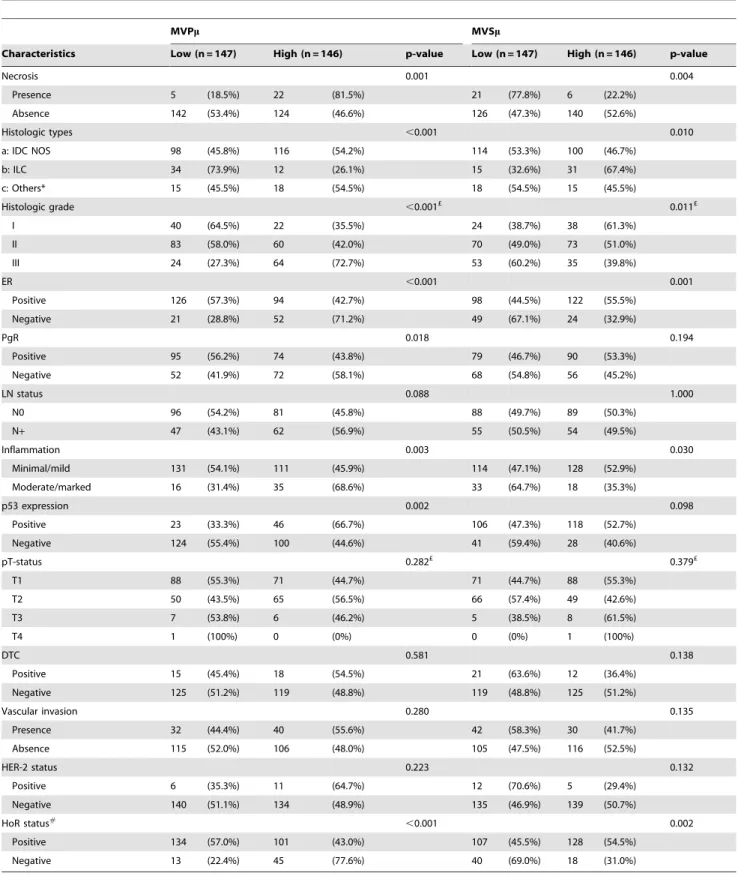
Table 3.Clinico-pathological characteristics for patients and their relationship with the identified angiogenesis markers.
MVPm MVSm
Characteristics Low (n = 147) High (n = 146) p-value Low (n = 147) High (n = 146) p-value
Necrosis 0.001 0.004
Presence 5 (18.5%) 22 (81.5%) 21 (77.8%) 6 (22.2%)
Absence 142 (53.4%) 124 (46.6%) 126 (47.3%) 140 (52.6%)
Histologic types ,0.001 0.010
a: IDC NOS 98 (45.8%) 116 (54.2%) 114 (53.3%) 100 (46.7%)
b: ILC 34 (73.9%) 12 (26.1%) 15 (32.6%) 31 (67.4%)
c: Others* 15 (45.5%) 18 (54.5%) 18 (54.5%) 15 (45.5%)
Histologic grade ,0.001£ 0.011£
I 40 (64.5%) 22 (35.5%) 24 (38.7%) 38 (61.3%)
II 83 (58.0%) 60 (42.0%) 70 (49.0%) 73 (51.0%)
III 24 (27.3%) 64 (72.7%) 53 (60.2%) 35 (39.8%)
ER ,0.001 0.001
Positive 126 (57.3%) 94 (42.7%) 98 (44.5%) 122 (55.5%)
Negative 21 (28.8%) 52 (71.2%) 49 (67.1%) 24 (32.9%)
PgR 0.018 0.194
Positive 95 (56.2%) 74 (43.8%) 79 (46.7%) 90 (53.3%)
Negative 52 (41.9%) 72 (58.1%) 68 (54.8%) 56 (45.2%)
LN status 0.088 1.000
N0 96 (54.2%) 81 (45.8%) 88 (49.7%) 89 (50.3%)
N+ 47 (43.1%) 62 (56.9%) 55 (50.5%) 54 (49.5%)
Inflammation 0.003 0.030
Minimal/mild 131 (54.1%) 111 (45.9%) 114 (47.1%) 128 (52.9%)
Moderate/marked 16 (31.4%) 35 (68.6%) 33 (64.7%) 18 (35.3%)
p53 expression 0.002 0.098
Positive 23 (33.3%) 46 (66.7%) 106 (47.3%) 118 (52.7%)
Negative 124 (55.4%) 100 (44.6%) 41 (59.4%) 28 (40.6%)
pT-status 0.282£ 0.379£
T1 88 (55.3%) 71 (44.7%) 71 (44.7%) 88 (55.3%)
T2 50 (43.5%) 65 (56.5%) 66 (57.4%) 49 (42.6%)
T3 7 (53.8%) 6 (46.2%) 5 (38.5%) 8 (61.5%)
T4 1 (100%) 0 (0%) 0 (0%) 1 (100%)
DTC 0.581 0.138
Positive 15 (45.4%) 18 (54.5%) 21 (63.6%) 12 (36.4%)
Negative 125 (51.2%) 119 (48.8%) 119 (48.8%) 125 (51.2%)
Vascular invasion 0.280 0.135
Presence 32 (44.4%) 40 (55.6%) 42 (58.3%) 30 (41.7%)
Absence 115 (52.0%) 106 (48.0%) 105 (47.5%) 116 (52.5%)
HER-2 status 0.223 0.132
Positive 6 (35.3%) 11 (64.7%) 12 (70.6%) 5 (29.4%)
Negative 140 (51.1%) 134 (48.9%) 135 (46.9%) 139 (50.7%)
HoR status#
,0.001 0.002
Positive 134 (57.0%) 101 (43.0%) 107 (45.5%) 128 (54.5%)
Negative 13 (22.4%) 45 (77.6%) 40 (69.0%) 18 (31.0%)
#
HoR– hormone receptor, combination of ER and PgR, positive if either is positive, negative if both are negative. *Other histologic types were ignored for the purpose of determining significance.
p-value: Pearsons Chi-square exact test and Linear-by-linear association exact test (p-values marked with £). MVPm: average perimeter length (low = small vessels). MVSm: average vessel solidity (low = complex vessel shapes).
significantly add prognostic information to MVAm for DDFS (p = 0.031) and a trend for BCSS (p = 0.071). Both MVPm and MVSmsignificantly added independent prognostic information to MVAS—a marker closely related to Chalkley counts—for both
end-points (p-values: 0.013–0.028). MVAS was positively
corre-lated with MVPm(r2= 0.35) and negatively with MVSm(r2= 0.17).
Discussion
In the present study, the mean vessel size and the mean vessel shape complexity, as measured by MVPmand MVSmrespectively, were identified as strong prognosticators in invasive breast carcinoma patients. We observed a significantly reduced survival in patients with large vessels compared to those who had smaller vessels, especially in the continuous model (Table 2 and Figure 3).
Figure 3. The prognostic associations of the dichotomized markers.The Kaplan-Meier plots of the median-categorized MVPm(A–D) and
MVSm(E–H) data against DDFS (A, C, E, G) and BCSS (B, D, F, H) end-points in the set of all cases (A,B,E,F) and the set of node-negative no systemic therapy cases (C,D,G,H). p-values are by the log-rank test. Hazard ratios (HR) with 95-% confidence intervals in parentheses are for Cox regression of high-risk vs low-risk groups. *: Low and high solidity corresponds, respectively, to high and low vessel profile complexity.
doi:10.1371/journal.pone.0075954.g003
Table 4.Multivariate Cox-regression.
MVPm MVSm
DDFS BCSS DDFS BCSS
p HR p HR p HR p HR
Histologic grade 0.083 1.565 0.343 1.311 0.080 1.564 0.260 1.380
LN status 0.002 2.901 0.002 3.331 0.002 2.902 0.001 3.553
pT status 0.002 1.901 0.000 2.442 0.002 1.901 0.000 2.385
Vascular invasion 0.002 2.351 0.002 2.634 0.003 2.349 0.005 2.451
HR 0.013 2.264 0.033 2.173 0.011 2.263 0.012 2.438
MVPm 0.998 0.999 0.147 1.656
MVSm 0.989 1.004 0.472 1.257
MVPmand MVSmare dichotomized at the median-value; MVPmis highvs.low; MVSmis lowvs.high. In addition to the shown parameters systemic therapy was included in the model. Neither MVPmor MVSmin their dichotomous versions were independently prognostic in the multivariate Cox model.
Figure 4. DTC and VI’s prognostic dependency upon the vascular markers.The figure shows Kaplan-Meier plots of DTC (A–H) and VI (I–P) for the end-points DDFS (A–F and I–L) and BCSS (E–H and M–P) within vascular sub-groups (columns): Small vessels (A, E, I and M), large vessels (B, F, J and N), low complexity vessels (C, G, K, and O) and high complexity vessels (D, H, L and P). Gray curves: DTC or VI negative; black: Positive. HR: Cox regression hazard ratios with 95% confidence interval. p-values are by log-rank test.
The finding is in accordance with previous reports for MVD and CC measurements in breast cancer [22,27]. S Similarly, high vessel complexity was associated with poor prognosis (Table 2 and Figure 3). Furthermore, the microvessel size and vessel complexity had strong influences on the prognostic properties of DTC and VI (Figure 4). DTC has earlier been reported to have prognostic effect in high angiogenesis cases [13,14], and VI in low angiogenesis cases [14]. Finally, the analysis of the relationship between the vascular markers shows that vessel size is a robust pathological marker with respect to different definitions, and that the prognostic ability of these markers is independent of vascular density. There is relevant work on similar markers in other cancers [29–31,42,47–54], but—to the best of our knowledge—no prognostic studies in breast cancer. There is, however, some literature on the association between vascular density measure-ments and DTC in breast cancer [11–14].
In this study, we used an automatic system to explore different vascular parameters that might be useful in evaluating tumour angiogenesis in a clinical setting. The size of the parameter-space far exceeded the statistical resolving power of the dataset; only a limited number of parameters could be analyzed. The literature concerning advanced quantifiers is limited and inconclusive [30,34,42,55]. For this reason, we applied a pilot-validation setup, providing a basis for the selection of vascular descriptors, although at the expense of statistical power. Further, we applied strict significance criteria in order to provide a sound basis for inference. The discovery of new independent vascular markers highlights a methodological challenge. The quantified fields are hot-spots selected in accordance with Weidner et.al. ’s criteria [19,24]. The fields were selected based on total vascular density. The question arise: Should angiogenesis markers be measured in the areas of the tumour where they are most extreme, i.e. MVPm in the region with largest vessels, or are they prognostic because they characterize the hot-spot? This is relevant even with the traditional markers. In our case MVD was emphasised slightly higher than area when the hot-spot was selected, yet the area (CC) is by far the most prognostically powerful in breast cancer [16,22,27].
Hot-spot vascular density assessment is interpreted as a measurement of the biologically most active part of the tumour. Thus, to some extent, it reflects the tumours growth potential, as angiogenesis is a limiting factor for both proliferation and metastasis [5,56,57]. In contrast to MVD and CC, the new markers are at the individual vessel level. MVPmand MVSmrelate to how functional the vessels are from a circulatory point of view. The mean vessel size has strong biological implications for the flow of blood through the vessels, and possibly the vessels ability to deal with mechanical stress, which is a driving force for acute hypoxia and confluent necrosis through arterial or venous infarct [56]. The MVSm marker relates to several features including branching points, interconnectivity of vessels, and irregular vessel shapes in general; the marker has been used in anti-angiogenesis treatment studies to quantify vessel abnormality [58]. Disordered, heteroge-neous and tortuous vascular networks are directly associated with hypoxia [59].
These characteristics are reflected, not only in a strong association with necrosis, but also in how the vascular morphology affects DTC’s prognostic ability (Figure 4). DTC+patients in the poorly functioning vascular groups (small or complex vessels) suffered no worse survival; DTC was only prognostic in the groups with large vessels, or low vessel complexity. Thus, vascular morphology can be used to screen patients for which DTC examination is beneficial. Possible explanations for DTC’s lack of prognostic value in these groups are: Dormancy induced through increased biophysical stress (shear forces) on intravasated cells [60], increased time spent in the vasculature [61], or a tumour phenotype ill suited to initiate angiogenesis at the secondary site [62]. Finally, there is an association between vessel size and the size of tumour cell-aggregates entering the circulation; larger aggregates resulting in more metastases [63]. VI showed increased prognostic ability in groups associated with low angiogenesis, in accordance with earlier findings [14]. In breast cancer, VI has been found to primarily be of the lymphovascular type [64].
MVPm and MVSm were not found to be associated with physical tumour extension characteristics; T-status, LN-status, VI, and DTC status were insignificant. Strong associations were, however, observed for tumour grade, ER, necrosis, inflammation, and histologic type (Table 3). Thus, the markers’ associations seem linked to the biology of the tumour, than physical extent. These associations differ from those reported for CC, which is strongly associated with T-status and VI [13,21,65].
In conclusion, we have identified two new prognostic vascular markers, MVPm and MVSm, pertaining to features at the individual vessel level. Not only is the overall amount of neo-vascularisation of prognostic value in breast cancer, but also morphological characteristics of the produced vessels. These new parameters add into our further understanding the role of angiogenesis in tumour progression, dissemination and metastasis. We find that the measurement of average vessel size and vessel shape in the hot-spot provides new prognostic information.
Supporting Information
Pilot S1 Description of pilot parameters.
(DOC)
Acknowledgments
We thank Ellen Hellesylt and Mette Førsund for the high quality immunohistochemistry, and the Oslo Breast Cancer Micrometastasis Project for permitting the use of data.
Author Contributions
Conceived and designed the experiments: LTM HPD JN DRO ØB. Performed the experiments: LTM HPD JN EB BN. Analyzed the data: LTM. Contributed reagents/materials/analysis tools: LTM HPD JN. Wrote the paper: LTM.
References
1. Folkman J (1990) What is the evidence that tumors are angiogenesis dependent? Journal of the National Cancer Institute 82: 4–6.
2. Hashizume H, Baluk P, Morikawa S, McLean JW, Thurston G, et al. (2000) Openings between defective endothelial cells explain tumor vessel leakiness. AmericanJournal of Pathology 156: 1363–1380.
3. Konerding MA, Malkusch W, Klapthor B, van Ackern C, Fait E, et al. (1999) Evidence for characteristic vascular patterns in solid tumours: quantitative studies using corrosion casts.Br J Cancer 80: 724–732.
4. Carmeliet P, Jain RK (2000) Angiogenesis in cancer and other diseases.Nature 407: 249–257.
5. Vermeulen PB, Gasparini G, Fox SB, Toi M, Martin L, et al. (1996) Quantification of angiogenesis in solid human tumours: an international consensus on the methodology and criteria of evaluation.Eur J Cancer 32A: 2474–2484.
6. Uzzan B, Nicolas P, Cucherat M, Perret GY (2004) Microvessel density as a prognostic factor in women with breast cancer: a systematic review of the literature and meta-analysis.Cancer Res 64: 2941–2955.
8. Braun S, Naume B (2005) Circulating and disseminated tumor cells.Journal of clinical oncology 23: 1623.
9. Ellis IO, Sastre-Garau X, Bussolati G, Tavassoli FA, Eusebi V, et al. (2003) Invasive breast carcinoma. In: Tavassoli FA, Devilee P, editors.World Health Organization Classification of Tumours Pathology and Genetics: Tumours of the Breast and Female Genital Organs. IARC Press: Lyon, France. pp 9–110. 10. Kato T, Kameoka S, Kimura T, Nishikawa T, Kobayashi M (2001) Angiogenesis and blood vessel invasion as prognostic indicators for node-negative breast cancer.Breast Cancer Res Treat 65: 203–215.
11. McDonnell CO, Hill AD, McNamara DA, Walsh TN, Bouchier-Hayes DJ (2000) Tumour micrometastases: the influence of angiogenesis.Eur J Surg Oncol 26: 105–115.
12. Fox SB, Leek RD, Bliss J, Mansi JL, Gusterson B, et al. (1997) Association of tumor angiogenesis with bone marrow micrometastases in breast cancer patients.Journal of the National Cancer Institute 89: 1044–1049.
13. Dhakal HP, Naume B, Synnestvedt M, Borgen E, Kaaresen R, et al. (2008) Vascularization in primary breast carcinomas: its prognostic significance and relationship with tumor cell dissemination.Clin Cancer Res 14: 2341–2350. 14. Dhakal HP, Naume B, Synnestvedt M, Borgen E, Kaaresen R, et al. (2012)
Expression of vascular endothelial growth factor and vascular endothelial growth factor receptors 1 and 2 in invasive breast carcinoma: prognostic significance and relationship with markers for aggressiveness.Histopathology 61: 350–364. 15. Weidner N (2008) Chapter 14. Measuring intratumoral microvessel density.
Methods Enzymol 444: 305–323.
16. Offersen BV, Borre M, Overgaard J (2003) Quantification of angiogenesis as a prognostic marker in human carcinomas: a critical evaluation of histopatholog-ical methods for estimation of vascular density.Eur J Cancer 39: 881–890. 17. Hlatky L, Hahnfeldt P, Folkman J (2002) Clinical application of antiangiogenic
therapy: microvessel density, what it does and doesn’t tell us.Journal of the National Cancer Institute 94: 883–893.
18. Weidner N (1998) Tumoural vascularity as a prognostic factor in cancer patients: The evidence continues to grow.Journal of Pathology 184: 119–122. 19. Weidner N, Semple JP, Welch WR, Folkman J (1991) Tumor angiogenesis and
metastasis–correlation in invasive breast carcinoma.N Engl J Med 1991; 324: 1–8.
20. Jacquemier JD, Penault-Llorca FM, Bertucci F, Zhen ZS, Houvenaeghel GF, et al. (1998) Angiogenesis as a prognostic marker in breast carcinoma with conventional adjuvant chemotherapy: a multiparametric and immunohisto-chemical analysis.J Pathol 184: 130–135.
21. Offersen BV, Sorensen FB, Yilmaz M, Knoop A, Overgaard J (2002) Chalkley estimates of angiogenesis in early breast cancer–relevance to prognosis.Acta Oncol 41: 695–703.
22. Hansen S, Sorensen FB, Vach W, Grabau DA, Bak M, et al. (2004) Microvessel density compared with the Chalkley count in a prognostic study of angiogenesis in breast cancer patients.Histopathology 44: 428–436.
23. Nieto Y, Woods J, Nawaz F, Baron A, Jones RB, et al. (2007) Prognostic analysis of tumour angiogenesis, determined by microvessel density and expression of vascular endothelial growth factor, in high-risk primary breast cancer patients treated with high-dose chemotherapy.Br J Cancer 97: 391–397.
24. Weidner N, Folkman J, Pozza F, Bevilacqua P, Allred EN, et al. (1992) Tumor Angiogenesis: A New Significant and Independent Prognostic Indicator in Early-Stage Breast-Carcinoma.Journal of the National Cancer Institute 84: 1875– 1887.
25. Vermeulen PB, Gasparini G, Fox SB, Colpaert C, Marson LP, et al. (2002) Second international consensus on the methodology and criteria of evaluation of angiogenesis quantification in solid human tumours.Eur J Cancer 38: 1564– 1579.
26. Fitzgibbons PL, Page DL, Weaver D, Thor AD, Allred DC, et al. (2000) Prognostic factors in breast cancer. College of American Pathologists Consensus Statement 1999.Arch Pathol Lab Med 124: 966–978.
27. Dhakal HP, Bassarova A, Naume B, Synnestvedt M, Borgen E, et al. (2009) Breast carcinoma vascularity: a comparison of manual microvessel count and Chalkley count.Histol Histopathol 24: 1049–1059.
28. Farinha P, Kyle AH, Minchinton AI, Connors JM, Karsan A, et al. (2010) Vascularization predicts overall survival and risk of transformation in follicular lymphoma.Haematologica 95: 2157–2160.
29. Luukkaa H, Laitakari J, Vahlberg T, Klemi P, Grenman R, et al. (2007) Morphometric analysis using automated image analysis of CD34-positive vessels in salivary gland acinic cell carcinoma.Acta Otolaryngol 127: 869–873. 30. Korkolopoulou P, Konstantinidou AE, Kavantzas N, Patsouris E, Pavlopoulos
PM, et al. (2001) Morphometric microvascular characteristics predict prognosis in superficial and invasive bladder cancer.Virchows Arch 438: 603–611. 31. Mucci LA, Powolny A, Giovannucci E, Liao Z, Kenfield SA, et al. (2009)
Prospective study of prostate tumor angiogenesis and cancer-specific mortality in the health professionals follow-up study.J Clin Oncol; 27: 5627–5633. 32. Taverna G (2009) Fractal analysis of two-dimensional vascularity in primary
prostate cancer and surrounding non-tumoral parenchyma.Pathology, research and practice 2009; 205: 438.
33. Sharma S, Sharma MC, Sarkar C (2005) Morphology of angiogenesis in human cancer: a conceptual overview, histoprognostic perspective and significance of neoangiogenesis.Histopathology 2005; 46: 481–489.
34. Fox SB, Harris AL (2004) Histological quantitation of tumour angiogenesis. APMIS 2004; 112: 413–430.
35. Mikalsen LT, Dhakal HP, Bruland OS, Nesand JM, Olsen DR (2011) Quantification of angiogenesis in breast cancer by automated vessel identifica-tion in CD34 immunohistochemical secidentifica-tions.Anticancer Research 2011; 31: 4053–4060.
36. Naume B, Wiedswang G, Borgen E, Kvalheim G, Karesen R, et al. (2004) The prognostic value of isolated tumor cells in bone marrow in breast cancer patients: evaluation of morphological categories and the number of clinically significant cells.Clin Cancer Res 2004; 10: 3091–3097.
37. Naume B, Borgen E, Kvalheim G, Karesen R, Qvist H, et al. (2001) Detection of isolated tumor cells in bone marrow in early-stage breast carcinoma patients: comparison with preoperative clinical parameters and primary tumor charac-teristics.Clin Cancer Res 2001; 7: 4122–4129.
38. Wiedswang G, Borgen E, Karesen R, Kvalheim G, Nesland JM, et al. (2003) Detection of isolated tumor cells in bone marrow is an independent prognostic factor in breast cancer.J Clin Oncol 2003; 21: 3469–3478.
39. Elston CW, Ellis IO (1991) Pathological prognostic factors in breast cancer. I. The value of histological grade in breast cancer: experience from a large study with long-term follow-up.Histopathology 1991; 19: 403–410.
40. Mangia A, Malfettone A, Rossi R, Paradiso A, Ranieri G, et al. (2011) Tissue remodelling in breast cancer: human mast cell tryptase as an initiator of myofibroblast differentiation.Histopathology 58: 1096–1106.
41. Ebrahimsade S, Westhoff CC, Barth PJ (2007) CD34+fibrocytes are preserved in most invasive lobular carcinomas of the breast.Pathol Res Pract 203: 695– 698.
42. Weyn B, Tjalma WA, Vermeylen P, van Daele A, Van Marck E, et al. (2004) Determination of tumour prognosis based on angiogenesis-related vascular patterns measured by fractal and syntactic structure analysis.Clin Oncol (R Coll Radiol) 16: 307–316.
43. Wild R, Ramakrishnan S, Sedgewick J, Griffioen AW (2000) Quantitative assessment of angiogenesis and tumor vessel architecture by computer-assisted digital image analysis: effects of VEGF-toxin conjugate on tumor microvessel density.Microvascular Research 59: 368–376.
44. Fox SB, Leek RD, Weekes MP, Whitehouse RM, Gatter KC, et al. (1995) Quantitation and prognostic value of breast cancer angiogenesis: comparison of microvessel density, Chalkley count, and computer image analysis.J Pathol 1995; 177: 275–283.
45. West CM, Cooper RA, Loncaster JA, Wilks DP, Bromley M (2001) Tumor vascularity: a histological measure of angiogenesis and hypoxia.Cancer Res 61: 2907–2910.
46. Altman DG, Lausen B, Sauerbrei W, Schumacher M (1994) Dangers of using ‘‘optimal’’ cutpoints in the evaluation of prognostic factors. Journal of the National Cancer Institute 86: 829–835.
47. Dadras SS, Lange-Asschenfeldt B, Velasco P, Nguyen L, Vora A, et al. (2005) Tumor lymphangiogenesis predicts melanoma metastasis to sentinel lymph nodes.Mod Pathol 18: 1232–1242.
48. Laitakari J, Nayha V, Stenback F (2004) Size, shape, structure, and direction of angiogenesis in laryngeal tumour development.J Clin Pathol 2004; 57: 394–401. 49. Korkolopoulou P, Thymara I, Kavantzas N, Vassilakopoulos TP, Angelopoulou MK, et al. (2005) Angiogenesis in Hodgkin’s lymphoma: a morphometric approach in 286 patients with prognostic implications.Leukemia 19: 894–900. 50. Dadras SS, Paul T, Bertoncini J, Brown LF, Muzikansky A, et al. (2003) Tumor lymphangiogenesis: a novel prognostic indicator for cutaneous melanoma metastasis and survival.Am J Pathol 162: 1951–1960.
51. Korkolopoulou P, Apostolidou E, Pavlopoulos PM, Kavantzas N, Vyniou N, et al. (2001) Prognostic evaluation of the microvascular network in myelodysplastic syndromes.Leukemia 15: 1369–1376.
52. Korkolopoulou P, Gribabis DA, Kavantzas N, Angelopoulou MK, Siakantaris MP, et al. (2003) A morphometric study of bone marrow angiogenesis in hairy cell leukaemia with clinicopathological correlations.Br J Haematol 122: 900– 910.
53. Luukkaa H, Laitakari J, Vahlberg T, Klemi P, Stenba¨ck F, et al. (2009) Morphometric analysis of CD34-positive vessels in salivary gland adenoid cystic and mucoepidermoid carcinomas.Journal of Oral Pathology & Medicine 38: 695–700.
54. Korkolopoulou P, Viniou N, Kavantzas N, Patsouris E, Thymara I, et al. (2003) Clinicopathologic correlations of bone marrow angiogenesis in chronic myeloid leukemia: a morphometric study.Leukemia 17: 89–97.
55. Safali M, Karslioglu Y, Arpaci F, Bu¨lent K, Gu¨nhan O¨ (2010) A distinct microvascular pattern accompanied by aggressive clinical course in breast carcinomas: a fact or a coincidence?Pathology Research and Practice 206: 93– 97.
56. Weidner N (1999) Tumour vascularity and proliferation: clear evidence of a close relationship.J Pathol 189: 297–299.
57. Belien JA, van Diest PJ, Baak JP (1999) Relationships between vascularization and proliferation in invasive breast cancer.J Pathol 189: 309–318.
58. Chlenski A, Guerrero LJ, Peddinti R, Spitz JA, Leonhardt PT, et al. (2010) Anti-angiogenic SPARC peptides inhibit progression of neuroblastoma tumors.Mol Cancer 9: 138.
59. Hardee ME, Dewhirst MW, Agarwal N, Sorg BS (2009) Novel imaging provides new insights into mechanisms of oxygen transport in tumors.Curr Mol Med 9: 435–441.
61. Meng S (2004) Circulating tumor cells in patients with breast cancer dormancy. Clinical cancer research 10: 8152.
62. Steeg PS (2006) Tumor metastasis: mechanistic insights and clinical challenges. Nature medicine 12: 895.
63. Liotta LA, Saidel MG, Kleinerman J (1976) The significance of hematogenous tumor cell clumps in the metastatic process.Cancer Res 36: 889–894.
64. Mohammed RAA, Martin SG, Mahmmod AM, Macmillan RD, Green AR, et al. (2011) Objective assessment of lymphatic and blood vascular invasion in lymph node-negative breast carcinoma: findings from a large case series with long-term follow-up.Journal of Pathology 223: 358–365.