Submitted15 August 2016 Accepted 29 November 2016 Published3 January 2017
Corresponding author Jeremy Burton,
jeremy.burton0@gmail.com, Jeremy.Burton@lawsonresearch.com
Academic editor Siouxsie Wiles
Additional Information and Declarations can be found on page 10
DOI10.7717/peerj.2840
Copyright 2017 Al et al.
Distributed under
Creative Commons CC-BY 4.0
OPEN ACCESS
Impact of birth weight and postnatal diet
on the gut microbiota of young adult
guinea pigs
Kait Al1,2,3, Ousseynou Sarr3,4,5,6, Kristyn Dunlop4,5, Gregory B. Gloor7,
Gregor Reid1,2,3,8, Jeremy Burton1,2,3,8and Timothy R.H. Regnault3,4,5,6
1Department of Microbiology and Immunology, University of Western Ontario, London, Ontario, Canada 2Canadian Centre for Human Microbiome and Probiotic Research, London, Ontario, Canada
3Lawson Health Research Institute, London, Ontario, Canada
4Department of Physiology and Pharmacology, University of Western Ontario, London, Ontario, Canada 5Department of Obstetrics and Gynaecology, University of Western Ontario, London, Ontario, Canada 6Children’s Health Research Institute, London, Ontario, Canada
7Department of Biochemistry, University of Western Ontario, London, Ontario, Canada
8Department of Surgery, Division of Urology, University of Western Ontario, London, Ontario, Canada
ABSTRACT
Background. The gastrointestinal tract (GIT) microbiota is essential to metabolic health, and the prevalence of the Western diet (WD) high in fat and sugar is increasing, with evidence highlighting a negative interaction between the GIT and WD, resulting in liver dysfunction. Additionally, an adversein uteroenvironment such as placental insufficiency resulting in low birth weight (LBW) offspring, contributes to an increased risk of metabolic diseases such as fatty liver infiltration and liver dysfunction in later life. We sought to understand the potential interactive effects of exposure to a WD upon growing LBW offspring. We postulated that LBW offspring when challenged with a poor postnatal diet, would display an altered microbiota and more severe liver metabolic dysfunction.
Methods. The fecal microbiota of normal birth weight (NBW) and LBW young guinea pig offspring, weaned onto either a control diet (CD) or WD was determined with 16S rRNA gene next generation sequencing at young adulthood following the early rapid growth phase after weaning. A liver blood chemistry profile was also performed. Results. The life-long consumption of WD following weaning into young adulthood resulted in increased total cholesterol, triglycerides and alanine aminotransferase levels in association with an altered GIT microbiota when compared to offspring consuming CD. Neither birth weight nor sex were associated with any significant changes in microbiota alpha diversity, by measuring the Shannon’s diversity index. One hundred forty-eight operational taxonomic units were statistically distinct between the diet groups, independent of birth weight. In the WD group, significant decreases were detected in Barnesiella, Methanobrevibacter smithii and relatives of Oscillospira guillermondii, whileButyricimonasandBacteroides spp.were increased.
SubjectsMicrobiology, Veterinary Medicine, Zoology
Keywords Microbiome
INTRODUCTION
Metabolic diseases such as obesity and the related metabolic syndrome are now considered to be an epidemic and an increasing burden on health care systems (Mathers et al., 2001). The gastrointestinal tract (GIT) microbiota is essential to metabolic health, and a dysfunctional GIT is closely linked to the development of aspects of metabolic syndrome. The GIT microbiota utilizes indigestible components of our diets and some suggest it may influence calorie harvesting from food (Turnbaugh et al., 2006;Zeng et al., 2013). It also has an important role in homeostasis and the maintenance of epithelial barriers, which when degraded may contribute to inflammation leading to chronic diseases characterized by metabolic dysfunction such as non-alcoholic fatty liver disease (NAFLD) and diabetes (Bäckhed et al., 2004;Dunne et al., 2014).
Due to the divergent nutritional requirements of various bacteria residing in the gut, diet has been shown to shape the composition of the microbiota, which in turn may lead to adverse health outcomes such as metabolic syndrome (Turnbaugh et al., 2008; Turnbaugh et al., 2009). Specifically, the consumption of a typical ‘‘Western’’ diet (WD) high in fat and sugar has been shown by some groups to alter the microbial diversity and relative abundance of two main phyla in humans and mice,BacteroidetesandFirmicutes
(Turnbaugh et al., 2009). For these reasons, the gastrointestinal microbiota is considered one of the potential environmental factors that advance the host to a metabolically diseased state (Hildebrandt et al., 2009).
Guinea pigs have been used interdependently in the study ofin uterogrowth, fetal development, and the impact diet has on postnatal growth (Fernandez & Volek, 2006; Sarr et al., 2014;Sarr et al., 2015;Thompson et al., 2014). A limited number of studies have described the guinea pig intestinal microbiota and have highlighted an overlap of phyla present in both the guinea pig and human GIT (Yanabe et al., 2001;Takahashi et al., 2005; Hildebrand et al., 2012). The aims of the present pilot study were to determine whether an
in uteroenvironment resulting in LBW is a factor in the compositional development of the gut and hepatic manifestations of metabolic syndrome, specifically altered ALT, and to investigate how a WD may impact these outcomes in growing offspring.
MATERIALS AND METHODS
Ethics statementAnimal care, maintenance, and surgeries were conducted in accordance with the standards set by the Canadian Council on Animal Care. The University of Western Ontario Animal Use Subcommittee approved all procedures (AUP # 2010-229).
Animals and diets
Time-mated pregnant Dunkin-Hartley guinea pigs (Charles River Laboratories, Wilmington, MA, USA) were housed in a temperature (20–22◦C) and humidity (30%)
controlled environment with a 12 h light–dark cycle and had access to chow and tap water providedad libitum.
Chow-fed pregnant guinea pigs underwent uterine artery ablation (UAA) surgery at mid gestation (∼32 days, term 69 days) to generate normal and low birth weight offspring (NBW and LBW, respectively) due to chronic placental insufficiency as described previously (Turner & Trudinger, 2009; Sarr et al., 2014;Thompson et al., 2014). Sows delivered spontaneously at term (∼67 days) and birth weight was recorded. Guinea pig pups from a UAA pregnancy weighing less than 85 grams were defined as LBW, and pups weighing 90 grams or greater at birth were defined as NBW (Elias et al., 2015). Five days prior to weaning the postnatal control diet (CD, TD: 110240; Harlan Laboratories, Madison, WI, USA) was introduced to the pups through the maternal feeding tray. At 15 days of age the offspring were weaned, separated by sex, weighed, housed in individual cages, and randomized to either CD or a Western diet (WD, WD: 110239; Harlan Laboratories), as described previously (Thompson et al., 2014). Briefly, the diets differed in kilocalorie density (3.4 vs 4.2 kcal g−1), but were matched for protein and macronutrients. The
percentage of kilocalories for CD and WD from protein was 21.6 and 21.4, from fat was 18.4 and 45.3, and from carbohydrates was 60 and 33.3. Additionally, the WD contained 2.5 g kg−1cholesterol. To avoid litter effects, only one LBW/NBW animal per sex from a
single litter was assigned to each diet. From the time of weaning, food intake was recorded daily until sacrifice by CO2inhalation at young adulthood∼150 days. At sacrifice, blood
Fecal DNA extraction
The MoBio PowerSoilR 96-Well Soil DNA Isolation Kit (Mobio, Carlsbad, CA), was used
according to the modified Earth Microbiome Project standard protocols (Earth Microbiome Project, 2016). Approximately 0.25 g of each fecal sample was transferred to each well using sterile pipette tips, and extracted DNA was stored sealed at−20◦C until PCR.
Fecal sample polymerase chain reaction
Fifty microlitres of the DNA template extract was transferred to a 96-well PCR plate (Axygen, Union City, CA). The BioMekR 3000 Laboratory Automation Workstation was
used for automated PCR reagent set up. Amplifications of the V4 region of the 16S ribosomal RNA gene were carried out with the primers ACACTCTTTCCCTACACGACGCTCTTC-CGATCTNNNNxxxxxxxxGTGCCAGCMGCCGCGGTAA and CGGTCTCGGCATTC-CTGCTGAACCGCTCTTCCGATCTNNNNxxxxxxxxGGACTACHVGGGTWTCTAAT wherein xxxxxxxx is a sample specific nucleotide barcode and the preceding sequence is a portion of the Illumina adapter sequence for library construction. Ten microlitres (2.3 pmol/µl) each of a total of 32 primers, 16 left and right with unique barcodes were arrayed in 96 well plates. Using a BioMek 3000R (Beckman Coulter, Brea, CA, USA)
2µl of the DNA template was transferred into a plate containing 10µl of each unique primer. Then 20µl of Promega GoTaqR Colourless Master Mix (Promega, Maddison, WI,
USA), containing the necessary dNTPs, PCR reaction buffer, MgCl2, and GoTaqR DNA
Polymerase was added to the DNA template and primers. The final plate was firmly sealed with a foil PCR plate cover. This plate was placed in the Eppendorf MastercyclerR thermal
cycler (Eppendorf, Mississauga, ON), where the lid was kept at 105◦C. An initial hot start
temperature of 95◦C was used for two minutes to activate the GoTaqR. This was followed
by 25 cycles of 95◦C for one minute, 50◦C for one minute, and 72◦C for one minute. After
completion, the reaction was held at 4◦C until collection and then the amplicons were stored
at−20◦C.
DNA sequencing and data analysis
Samples were sent to the London Regional Genomics Centre at Robarts Research Institute (Western University, London, ON, CAN), where the sample quantification, clean-up, and sequencing were also performed. Amplicons were quantified using Picogreen (Quant-It; Life Technologies, Burlington, ON, CAN) and pooled at equimolar concentrations before cleanup (QIAquick PCR clean up; Qiagen, Germantown, MD, USA). The final samples were sequenced using the MiSeq by IlluminaR platform, with 2×300 bp paired-end
chemistry. Obtained reads were quality filtered and overlapped using USEARCH including reads with one or fewer sequencing errors, and binned into OTUs based on 97% identity (Edgar, 2010). Statistical significance in animal characteristics and hematological analysis was determined using 2-way ANOVA (GraphPad Software, San Diego, CA, USA). Diversity analysis was performed using the R package Vegan (version 2.3-2), differential abundance analysis was performed using the R package ALDEx2 (version 1.4.0) and all additional analysis was performed in base R (version 3.2.2). Utilized scripts are provided inData S7
Table 1 Animal characteristics and metadata.
Control diet Western diet Diet Birth weight Interaction
NBWa(n=9) LBWb(n=10) NBW (n=6) LBW (n=8)
Distribution of Sex F:4/M:5 F:5/M:5 F:2/M:4 F:5/M:3
Body weight (g) 752.13±36.00 648.46±42.15 704.45±27.9 585.99±46.59 NSc P<0.05 NS
Daily energy intake (kcal)
149.94±5.48 192.98±22.16 213.92±9.40 210.81±19.17 P<0.05 NS NS
Liver Triglycerides 3.92±0.74 5.51±1.08 68.40±11.39 75.74±14.20 P<0.0001 NS NS
Blood analysis
ALBd 4.04±0.10 3.50±0.41 4.20±0.17 4.33±0.17 P<0.05 NS NS
ALPe 62.40±11.30 43.00±8.50 65.14±7.67 76.67±7.56 NS NS NS
ALTf 49.20±3.11 49.00±5.58 94.57±16.40 125.50±32.57 P<0.05 NS NS
BAg 58.80±21.26 46.00±19.09 59.43±10.19 63.33±16.67 NS NS NS
BUNh 27.80±35.60 26.75±4.77 33.57±4.35 28.83±2.01 NS NS NS
TBILi 0.05±0.05 0.20±0.00 0.23±0.04 0.10±0.06 NS NS P <0.05
Cholesterol 77.00±14.08 72.50±15.18 418.00±41.07 449.67±30.41 P<0.0001 NS NS
Notes.
aNBW, Normal birth weight, or >90 g. bLBW, Low birth weight, or <85 g. cNS, Not significant.
dALB, Albumin.
eALP, Alkaline Phosphatase. fALT, Alanine Aminotransferase. gBA, Bile Acids.
hBUN, Blood Urea Nitrogen. iTBIL, Total Bilirubin.
Values are represented as mean±the standard error of the mean. Significance tests were performed using 2-way ANOVA.
PRJNA344687(Edgar, 2010;Fernandes et al., 2013;Fernandes et al., 2014;R Development Core Team, 2008).
RESULTS
Physical and hematological analysis of animal groups
The characteristics of each animal feeding group are displayed inTable 1. Animals body weights at sacrifice were lower in the LBW group (p=0.011), but were not significantly different between the diet groups, despite the differences in the diets’ nutritional compositions. Both daily caloric intake and liver triglycerides were significantly elevated in the WD group (p=0.027 and p<0.0001). Liver blood chemistry profiles revealed no difference in alkaline phosphatase, bile acids, or blood urea nitrogen. Diet, but not birth weight, was a significant factor where WD groups had higher albumin, alanine aminotransferase, and cholesterol than CD groups (p=0.031,p=0.011, p<0.0001, respectively). There was a significant diet and birth weight interaction in total bilirubin (p=0.024).
16S rRNA gene sequence-based characterization of the guinea pig fecal microbiota
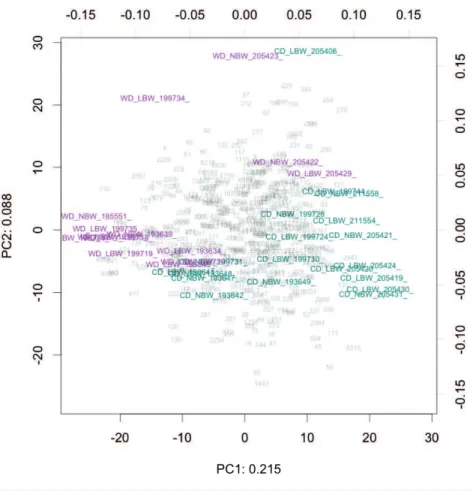
Figure 1 Compositional biplot of all samples.Samples are coloured according to diet, OTUs are shown as grey numbers. Approximately 30% of the variance is explained in the first two components. The biplot is drawn to show the relationship between the samples (scale=0), as opposed to OTUs.
2007). The sequences were grouped into 11 phyla, 19 classes, 29 orders, 45 families, and 73 genera, after filtering for OTUs representing 0.1% in any sample (data inData S1). The Shannon’s index was used to measure the diversity of the individual samples (Shannon, 1948;Haegeman et al., 2013) and, surprisingly, a 2-way ANOVA did not detect a statistically significant effect of diet or birth weight groups (Fig. S1A,Data S2). Similarly, there were no significant differences between the mean number of reads per sample (Fig. S1B).
Principal component analysis (PCA) of centered log-transformed distances highlighted differences in the microbiota samples between the CD and WD fed animals (Fig. 1) (Van den Boogaart & Tolosana-Delgado, 2013). Distance on this plot represents overall dissimilarity between the microbiota profiles of the samples using the Aitchison distance which is appropriate for compositional data (Van den Boogaart & Tolosana-Delgado, 2013). The distance of each OTU from the centre of the plot is proportional to the standard deviation in the dataset (up to the limit of the projection displayed). Comparing Aitchison distance, microbiota profiles did not cluster on the plot by sex or birth weights of the animals, but did cluster distinctly when the animals were grouped by diet type (Fig. 1,
−1.5 −1.0 −0.5 0.0 0.5 1.0 Adlercreutzia AkkermansiaAllobaculum AnaeroplasmaBacteroides BifidobacteriumBilophila Blautia Butyricimonas ChristensenellaClostridium Collinsella Coprococcus DehalobacteriumDesulfovibrio Dorea FusobacteriumGemella GranulicatellaHaemophilus Klebsiella LactobacillusLeptotrichia MethanobrevibacterNeisseria Oscillospira Parabacteroides PhascolarctobacteriumPorphyromonas Prevotellarc4−4 RuminococcusStreptococcus Sutterella ug_c_Alphaproteobacteriaug_c_Mollicutes ug_f_Christensenellaceaeug_f_Clostridiaceae ug_f_Desulfovibrionaceaeug_f_Elusimicrobiaceae ug_f_Erysipelotrichaceaeug_f_Lachnospiraceae ug_f_Micrococcaceae ug_f_Mogibacteriaceaeug_f_Peptococcaceae ug_f_Rikenellaceae ug_f_Ruminococcaceae ug_f_Xanthomonadaceaeug_o_Bacteroidales ug_o_Clostridiales ug_p_Cyanobacteriaug_p_Tenericutes unknown Veillonella Wautersiella
Effect Size Elevated in WD
Elevated in CD
Figure 2 Stripchart of differential OTUs between diet groups.OTUs with a Benjamini–Hochberg cor-rectedp-value from Wilcoxon rank-sum test <0.1 are plotted in blue. OTUs withp<0.1 and an absolute effect size >1 are red. OTUs are summarized to genus. If genus is unknown (ug_), the lowest known taxo-nomic rank is stated (f_Clostridiaceae).
discovery rate correction (Data S3,Fig. S3). The most significant of the 148 is OTU 22, and is most closely related to the genusBarnesiellafrom the familyPorphyromonadaceae
(p=1.08×10⁻⁴) which was decreased in the WD animals. Other notable OTUs include
the ArchaeaMethanobrevibacter (OTU 11 and 6160) andOscillospira(OTU 77) which were reduced in the WD animals, while the generaBacteroides(OTU 26 and 51),Bilophila
The most abundant phyla in all samples wereBacteroidetesandFirmicutes. Diet had a suggestive but not significant effect increasing the relative proportion ofBacteroidetes
(p=0.0832) in the WD group. The relative proportion ofFirmicuteswas significantly lower in the WD group compared to control (p=0.0049). Birth weight had no effect on the relative proportions of either phylum.
DISCUSSION
This was a pilot study investigating the gut microbiota in an established guinea pig model of metabolic syndrome. The model utilizes a combination of uterine artery ablation to induce LBW offspring, with a postnatal diet high in total fat and sugar, and produces a non-overweight phenotype with impaired vascular function, increased visceral adiposity, and liver fibrosis with fatty infiltration of the liver, hallmarks of metabolic disease (Sarr et al., 2014;Sarr et al., 2015;Thompson et al., 2014).
In the current study, birth weight was not significantly associated with an altered GIT microbiota. However, a change in GIT microbiota was observed as a function of the animals’ diet, an effect strong enough to possibly overshadow any potential influence of birth weight on the microbiota. Alterations in the relative abundance of specific OTUs in the guinea pig GIT are in agreement with both human studies and other animal models. For example, the genusBacteroideswas significantly higher in the WD group, and is observed to be elevated in overweight women, while the genusMethanobrevibacter and relatives of
Oscillospira guillermondiihave been associated with low BMI in humans and were both comparatively decreased in the WD group (Collado et al., 2008;Million et al., 2011;Million et al., 2013). OTU 22 is most closely related to the genusBarnesiella, and was the most significantly different between our diet groups.Barnesiellahas previously been shown to be increased in a non-obese diabetic rat model, but was decreased in our WD group (Zened et al., 2012;Marietta et al., 2013). Interestingly, this organism has been shown in rodents to be a marker of health as it assists in the clearance of less desirable bacterial colonization following antibiotic use, and is important in microbiome restoration (Ubeda et al., 2013). Similarly, this bacterial group may be outcompeted in our WD group but act as a marker of health in the CD animals.
When analyzing the data at the phylum level, it was observed that the guinea pig fecal microbiota is dominated byBacteroidetesandFirmicutesin all diet and birth weight groups, similar to other rodent reports (Eckburg et al., 2005;Hildebrand et al., 2012). It was interesting to note that the prototypical decrease in relative abundance ofBacteroidetes
Other factors contributing to the current study’s lack ofB/F change may be that guinea pigs are herbivorous and undergo hindgut fermentation, or that changes inB/F present at a later life stage than what was investigated herein (Duncan et al., 2008;Ley et al., 2008; Schwiertz et al., 2009;Walters, Xu & Knight, 2014). We caution that the convention of using the ratio ofB/F as a marker of the microbiome in metabolic disease may not be suitable for all animal models, especially in studies investigating the animal’s native microbiota as opposed to animals colonized by the human microbiota. Functional metagenomics, or reporting changes in particular genera and species, are likely to provide more insight (Hildebrand et al., 2012).
Alanine aminotransferase is one of the most commonly used markers in screening for liver disease, and levels were elevated in our WD fed animals independent of birth weight (Miyake et al., 2012). It is known that the GIT microbiota is a major factor in shifting the host to a metabolically diseased state, and the WD fed groups not surprisingly displayed elevated ALT levels and altered microbial markers, many of which are observed in humans with metabolic syndrome (Ley et al., 2006;Tims et al., 2012;Zened et al., 2012;Marietta et al., 2013;Ubeda et al., 2013). If diet is predominantly shaping the GIT microbiota, undesirable microbial products associated with WD may be translocating to the liver via the portal vein, impacting the liver function (Moore et al., 1991;Ilan, 2012;Hu et al., 2016). This can further induce hepatic tissue injury via activation of the inflammasome and chemokine release, creating a vicious circle of liver dysfunction (Ilan, 2012).
This study reports the WD-related changes to the gut microbiota of non-overweight young-adult guinea pigs with signs of early metabolic dysfunction (Sarr et al., 2014). Thein uteroenvironment resulting in low birth weight and metabolic disease at young adulthood appeared to have no impact upon the GIT microbiota, contrary to other reports in rats (Fan¸ca-Berthon et al., 2010). This lack of birth weight associated GIT changes at the age studied was in contrast to the driving role that diet appeared to play. A large number of OTUs identified by partial 16S rRNA gene sequence analysis were significantly different based on diet. Since changes were not largely detected in response to birth weight, if the microbiome does have a role here it may be occurring on a subtler basis rather than a global microbial shift. It is also possible the dietary effect on the microbiota was overshadowing any birth-weight related effects. An increase in the relative proportion ofFirmicutesand decrease inBacteroideteswas not observed in our WD group, and microbial diversity was largely unchanged. Despite this, several differential OTUs reported in the guinea pig associated with elevated ALT are also reported to occur in association with human metabolic disease. These observations highlight the potential usefulness of the guinea pig in understanding the negative impact of a diet high in saturated fats and sugar upon the GIT and its possible contribution to the development of metabolic disease.
ACKNOWLEDGEMENTS
ADDITIONAL INFORMATION AND DECLARATIONS
Funding
Funding was provided by the Canadian Institutes of Health Research (#MOP-209113) and the W. Garfield Weston Foundation. OS was supported by the Whaley Postdoctoral Fellowship. The funders had no role in study design, data collection and analysis, decision to publish, or preparation of the manuscript.
Grant Disclosures
The following grant information was disclosed by the authors: Canadian Institutes of Health Research: MOP-209113.
W. Garfield Weston Foundation. Whaley Postdoctoral Fellowship.
Competing Interests
The authors declare there are no competing interests.
Author Contributions
• Kait Al conceived and designed the experiments, performed the experiments, analyzed the data, wrote the paper, prepared figures and/or tables, reviewed drafts of the paper. • Ousseynou Sarr performed the experiments, analyzed the data, reviewed drafts of the
paper.
• Kristyn Dunlop reviewed drafts of the paper.
• Gregory B. Gloor analyzed the data, reviewed drafts of the paper.
• Gregor Reid contributed reagents/materials/analysis tools, reviewed drafts of the paper. • Jeremy Burton conceived and designed the experiments, contributed
reagents/material-s/analysis tools, wrote the paper, reviewed drafts of the paper.
• Timothy R.H. Regnault conceived and designed the experiments, performed the experiments, contributed reagents/materials/analysis tools, wrote the paper, reviewed drafts of the paper.
Animal Ethics
The following information was supplied relating to ethical approvals (i.e., approving body and any reference numbers):
The University of Western Ontario Animal Use Subcommittee approved all procedures, AUP Number: 2010-229. Animal care, maintenance, and surgeries were conducted in accordance with the standards set by the Canadian Council on Animal Care.
Data Availability
The following information was supplied regarding data availability: The raw data has been supplied as aSupplemental File.
Supplemental Information
REFERENCES
Angulo P, Keach JC, Batts KP, Lindor KD. 1999.Independent predictors of liver fibrosis in patients with nonalcoholic steatohepatitis.Hepatology30:1356–1362.
Arrieta M-C, Stiemsma L, Amenyogbe N, Brown E, Finlay B. 2014.The intestinal microbiome in early life: health and disease.Frontiers in Immunology5:Article 427
DOI 10.3389/fimmu.2014.00427.
Bäckhed F, Ding H, Wang T, Hooper LV, Koh G, Nagy A, Semenkovich CF, Gordon JI. 2004.The gut microbiota as an environmental factor that regulates fat storage.
Proceedings of the National Academy of Sciences of the United States of America
101:15718–15723.
Barker DJP. 2000.In utero programming of cardiovascular disease.Theriogenology
53:555–574DOI 10.1016/S0093-691X(99)00258-7.
Barker DJP, Hales CN, Fall CHD, Osmond C, Phipps K, Clark PMS. 1993.Type 2 (non-insulin-dependent) diabetes mellitus, hypertension and hyperlipidaemia (syndrome X): relation to reduced fetal growth.Diabetologia36:62–67.
Browne J. 1962.Placental insufficiency.Postgraduate Medical Journal38:225–228
DOI 10.1136/pgmj.38.438.225.
Collado M, Isolauri E, Laitinen K, Salminen S. 2008.Distinct composition of gut microbiota during pregnancy in overweight and normal-weight women.The American Journal of Clinical Nutrition88:894–899.
Duncan SH, Lobley GE, Holtrop G, Ince J, Johnstone AM, Louis P, Flint HJ. 2008. Hu-man colonic microbiota associated with diet, obesity and weight loss.International Journal of Obesity32:1720–1724DOI 10.1038/ijo.2008.155.
Dunne JL, Triplett EW, Gevers D, Xavier R, Insel R, Danska J, Atkinson MA. 2014. The intestinal microbiome in type 1 diabetes.Clinical & Experimental Immunology
177:30–37DOI 10.1111/cei.12321.
Earth Microbiome Project. 2016.EMP protocols and standards: DNA extraction protocol.Available athttp:// www.earthmicrobiome.org/ emp-standard-protocols/ dna-extraction-protocol/ (accessed on 7 July 2016).
Eckburg PB, Bik EM, Bernstein CN, Purdom E, Dethlefsen L, Sargent M, Gill SR, Nelson KE, Relman DA. 2005.Diversity of the human intestinal microbial flora.
Science308:1635–1638DOI 10.1126/science.1110591.
Edgar RC. 2010.Search and clustering orders of magnitude faster than BLAST. Bioinfor-matics26:2460–2461DOI 10.1093/bioinformatics/btq461.
Elias AA, Ghaly A, Matushewski B, Regnault TR, Richardson BS. 2015.Maternal nutrient restriction in guinea pigs as an animal model for inducing fetal growth restriction.Reproductive Sciences23:219–227DOI 10.1177/1933719115602773. Fan¸ca-Berthon P, Hoebler C, Mouzet E, David A, Michel C. 2010.Intrauterine growth
Fernandes AD, Macklaim JM, Linn TG, Reid G, Gloor GB. 2013.ANOVA-like dif-ferential expression (ALDEx) analysis for mixed population RNA-seq.PLoS ONE
8:e67019–15DOI 10.1371/journal.pone.0067019.
Fernandes AD, Reid JN, Macklaim JM, McMurrough TA, Edgell DR, Gloor GB. 2014. Unifying the analysis of high-throughput sequencing datasets: characterizing RNA-seq, 16S rRNA gene sequencing and selective growth experiments by compositional data analysis.Microbiome2:1–13DOI 10.1186/2049-2618-2-15.
Fernandez M, Volek J. 2006.Guinea pigs: a suitable animal model to study lipoprotein metabolism, atherosclerosis and inflammation.Nutrition & Metabolism3:1–6
DOI 10.1186/1743-7075-3-17.
Furet J-P, Kong L-C, Tap J, Poitou C, Basdevant A, Bouillot J-L, Mariat D, Corthier G, Dore J, Henegar C, Rizkalla S, Clément K. 2010.Differential adaptation of human gut microbiota to bariatric surgery–induced weight loss links with metabolic and low-grade inflammation markers.Diabetes59:3049–3057DOI 10.2337/db10-0253. Haegeman B, Hamelin J, Moriarty J, Neal P, Dushoff J, Weitz J. 2013.Robust estimation
of microbial diversity in theory and in practice.The ISME Journal7:1092–1101
DOI 10.1038/ismej.2013.10.
Hales NC, Barker DJ. 2001.The thrifty phenotype hypothesis.British Medical Bulletin
60:5–20.
Hildebrand F, Ebersbach T, Nielsen H, Li X, Sonne S, Bertalan M, Dimitrov P, Madsen L, Qin J, Wang J, Raes J, Kristiansen K, Licht T. 2012.A comparative analysis of the intestinal metagenomes present in guinea pigs (Cavia porcellus) and humans (Homo sapiens).BMC Genomics13:514DOI 10.1186/1471-2164-13-514.
Hildebrandt MA, Hoffmann C, Sherrill-mix SA, Keilbaugh SA, Hamady M, Chen Y, Knight R, Ahima RS, Bushman F, Wu GD. 2009.High-fat diet determines the com-position of the murine gut microbiome independently of obesity.Gastroenterology
137:1716–1724DOI 10.1053/j.gastro.2009.08.042.
Hu Y, Zhang H, Li J, Cong X, Chen Y, He G, Chi Y, Liu Y. 2016.Gut-derived lym-phocyte recruitment to liver and induce liver injury in non-alcoholic fatty liver disease mouse model.Journal of Gastroenterology and Hepatology31:676–684
DOI 10.1111/jgh.13183.
Ilan Y. 2012.Leaky gut and the liver: a role for bacterial translocation in nonalcoholic steatohepatitis.World Journal of Gastroenterology 18:2609–2610
DOI 10.3748/wjg.v18.i21.2609.
Ley RE, Hamady M, Lozupone C, Turnbaugh PJ, Ramey R, Bircher SJ, Schlegel ML, Tucker TA, Schrenzel MD, Knight R, Gordon JI. 2008.Evolution of mammals and their gut microbes.Science320:1647–1651DOI 10.1126/science.1155725.
Ley RE, Turnbaugh PJ, Klein S, Gordon JI. 2006.Human gut microbes associated with obesity.Nature444:1022–1023DOI 10.1038/4441022a.
Luoto R, Kalliomaki M, Laitinen K, Isolauri E. 2010.The impact of perinatal pro-biotic intervention on the development of overweight and obesity: follow-up study from birth to 10 years.International Journal of Obesity34:1531–1537
Marietta EV, Gomez AM, Yeoman C, Tilahun AY, Clark CR, Luckey DH, Murray JA, White BA, Kudva YC, Rajagopalan G. 2013.Low incidence of spontaneous Type 1 diabetes in non-obese diabetic mice raised on gluten-free diets is associated with changes in the intestinal microbiome.PLoS ONE8:e78687–9
DOI 10.1371/journal.pone.0078687.
Mathers CD, Vos T, Lopez AD, Salomon J, Ezzati M. 2001.National burden of disease studies: a pratical guide. Geneva: World Health Organization.
Million M, Angelakis E, Maraninchi M, Henry M, Giorgi R, Valero R, Vialettes B, Raoult D. 2013.Correlation between body mass index and gut concentrations ofLactobacillus reuteri, Bifidobacterium animalis, Methanobrevibacter smithiiand
Escherichia coli.International Journal of Obesity 37:1460–1466
DOI 10.1038/ijo.2013.20.
Million M, Maraninchi M, Henry M, Armougom F, Richet H, Carrieri P, Valero R, Rac-cah D, Vialettes B, Raoult D. 2011.Obesity-associated gut microbiota is enriched in
Lactobacillus reuteriand depleted inBifidobacterium animalisandMethanobrevibacter smithii.International Journal of Obesity36:817–825DOI 10.1038/ijo.2011.153. Miyake T, Kumagi T, Hirooka M, Koizumi M, Furukawa S, Ueda T, Tokumoto
Y, Ikeda Y, Abe M, Kitai K, Hiasa Y, Matsuura B, Onji M. 2012.Metabolic markers and ALT cutoff level for diagnosing nonalcoholic fatty liver disease: a community-based cross-sectional study.Journal of Gastroenterology 47:696–703
DOI 10.1007/s00535-012-0534-y.
Moore FA, Moore EE, Poggetti R, McAnena OJ, Peterson VM, Abernathy CM, Parsons PE. 1991.Gut bacterial translocation via the portal vein: a clinical perspective with major torso trauma.Journal of Trauma31:629–636.
R Development Core Team. 2008.R: a language and environment for statistical computing. Vienna: R Foundation for Statistical Computing.Available athttp: // www.R-project.org.
Sangild P, Fowden A, Trahair J. 2000.How does the foetal gastrointestinal tract develop in preparation for enteral nutrition after birth?Livestock Production Science
66:141–150DOI 10.1016/S0301-6226(00)00221-9.
Sarr O, Blake A, Thompson JA, Zhao L, Rabicki K, Walsh JC, Welch I, Regnault TR. 2015.The differential effects of low birth weight and western diet consumption upon early life hepatic fibrosis development in guinea pig.The Journal of Physiology
594:1753–1772DOI 10.1113/JP271777.
Sarr O, Thompson JA, Zhao L, Lee T-Y, Regnault TR. 2014.Low birth weight male guinea pig offspring display increased visceral adiposity in early adulthood.PLoS ONE9:e98433–13DOI 10.1371/journal.pone.0098433.
Schwiertz A, Taras D, Schäfer K, Beijer S, Bos NA, Donus C, Hardt PD. 2009. Mi-crobiota and SCFA in lean and overweight healthy subjects.Obesity 18:190–195
DOI 10.1038/oby.2009.167.
Takahashi T, Karita S, Yahaya M, Goto M. 2005.Radial and axial variations of bacteria within the cecum and proximal colon of guinea pigs revealed by PCR-DGGE.
Bioscience, Biotechnology, and Biochemistry69:1790–1792DOI 10.1271/bbb.69.1790. Thompson JA, Sarr O, Piorkowska K, Gros R, Regnault TR. 2014.Low birth weight fol-lowed by postnatal over-nutrition in the guinea pig exposes a predominant player in the development of vascular dysfunction.The Journal of Physiology592:5429–5443
DOI 10.1113/jphysiol.2014.275016.
Thorn S, Rozance P, Brown L, Hay W. 2011.The intrauterine growth restriction pheno-type: fetal adaptations and potential implications for later life insulin resistance and diabetes.Seminars in Reproductive Medicine29:225–236
DOI 10.1055/s-0031-1275516.
Tims S, Derom C, Jonkers D, Vlietinck R, Saris W, Kleerebezem M, Vos W, Zoetendal E. 2012.Microbiota conservation and BMI signatures in adult monozygotic twins.
The ISME Journal7:707–717DOI 10.1038/ismej.2012.146.
Trahair JF, DeBarro TM, Robinson JS, Owens JA. 1997.Restriction of nutritionin utero
selectively inhibits gastrointestinal growth in fetal sheep.The Journal of Nutrition
127:637–641.
Turnbaugh PJ, Bäckhed F, Fulton L, Gordon JI. 2008.Diet-induced obesity is linked to marked but reversible alterations in the mouse distal gut microbiome.Cell Host & Microbe3:213–223DOI 10.1016/j.chom.2008.02.015.
Turnbaugh P, Ley R, Mahowald M, Magrini V, Mardis E, Gordon J. 2006.An obesity-associated gut microbiome with increased capacity for energy harvest.Nature
444:1027–1131DOI 10.1038/nature05414.
Turnbaugh PJ, Ridaura VK, Faith JJ, Rey FE, Knight R, Gordon JI. 2009.The effect of diet on the human gut microbiome: a metagenomic analysis in humanized gnotobi-otic mice.Science Translational Medicine1:1–12DOI 10.1126/scitranslmed.3000322. Turner AJ, Trudinger BJ. 2009.A modification of the uterine artery restriction
tech-nique in the guinea pig fetus produces asymmetrical ultrasound growth.Placenta
30:236–240DOI 10.1016/j.placenta.2008.11.023.
Ubeda C, Bucci V, Caballero S, Djukovic A, Toussaint NC, Equinda M, Lipuma L, Ling L, Gobourne A, No D, Taur Y, Jenq RR, Van den Brink MR, Xavier JB, Pamer EG. 2013.Intestinal microbiota containingBarnesiellaspecies cures vancomycin-resistantEnterococcus faeciumcolonization.Infection and Immunity81:965–973
DOI 10.1128/IAI.01197-12.
Van den Boogaart GK, Tolosana-Delgado R. 2013.Analyzing compositional data with R. Berlin Heidelberg: Springer-Verlag.
Walters W, Xu Z, Knight R. 2014.Meta-analyses of human gut microbes associated with obesity and IBD.FEBS Letters588:4223–4233DOI 10.1016/j.febslet.2014.09.039. Wang Q, Garrity GM, Tiedje JM, Cole JR. 2007.Naive Bayesian classifier for rapid
Yan X, Huang Y, Wang H, Du M, Hess B, Ford S, Nathanielsz P, Zhu M. 2011.Maternal obesity induces sustained inflammation in both fetal and offspring large intestine of sheep.Inflammatory Bowel Diseases17:1513–1522DOI 10.1002/ibd.21539.
Yanabe M, Shibuya M, Gonda T, Asai H, Tanaka T, Sudou K, Narita T, Matsui T, Itoh K. 2001.Establishment of specific pathogen-free guinea-pig colonies using limited-flora guinea-pigs associated with conventional guinea-pig limited-flora, and monitoring of their cecal flora.Experimental Animals/Japanese Association for Laboratory Animal Science50:105–113.
Zened A, Combes S, Cauquil L, Mariette J, Klopp C, Bouchez O, Troegeler-Meynadier A, Enjalbert F. 2012.Microbial ecology of the rumen evaluated by 454 GS FLX pyrosequencing is affected by starch and oil supplementation of diets.FEMS Microbiology Ecology83:504–514DOI 10.1111/1574-6941.12011.
Zeng H, Liu J, Jackson MI, Zhao FQ, Yan L, Combs GF. 2013.Fatty liver accompanies an increase inLactobacillusspecies in the hind gut of C57BL/6 mice fed a high-fat diet.