Epidemiologic Identification
of Infants with Low
Birth Weight in Urban Areas of Latin America:
II. A Simplified Risk Score for Early Prenatal
Identification
in Guatemala City1
E.
KESTLER,~J
J.VILLAR,
~4 L. BOLAROS,* & W. CALVE@A simple, empirically derived instrument is needed in developing countries to iden- tify mothers at risk of delivering low birth weight (LBW) infants, in order to help reduce the incidence of LBW deliveries and provide mothers at high risk with appro- priate health care. The study reported here was devoted to developing an instrument of this kind using data obtained before the twenty-sixth week of gestation from an urban study population of 17,135 Guatemalan women. It appears that this instru- ment could be appropriately applied to urban populations in other developing countries.
L
ow birth weight (LBW), defined as birth weight below 2,500 g, is one of the most important maternal and child health problems in both developed and developing countries. The incidence of LBW in different populations varies from as little as 3.6% in Sweden to as much as 40% in some parts of India and Gua- temala (I). LBW infants have a higher‘The work reported here was supported by the Research Grant Program of the Board of Sciences and Technology for International Development (BOSTID), National Academy of Sciences (Grant Number REA GT 4-84-2). Reprint requests should be addressed to Dr. Edgar Kestler, Division of Re- productive Health, Center for Disease Control, 1600 Clifton Road, NE, Building 114054 C06, At- lanta, Georgia 30333, USA. This article will also be published in Spanish in the Bolefin de la Oficina Sanitaria Panamericana, vol. 111.
V’erinatal Research Unit, Gynecology and Obstet- rics Hospital, Guatemalan Social Security Insti- tute, Guatemala City, Guatemala.
JDivision of Reproductive Health, WHO Perinatal Collaborating Center Activity, Center for Disease Control, Atlanta, Georgia, U.S.A.
Vrevention Research Program, National Institute of Child Health and Human Development, Na- tional Institutes of Health, Bethesda, Maryland, U.S.A.
risk of neonatal morbidity and mortality (2, 3) and of abnormal postnatal growth and neurologic development than do their counterparts with normal birth weights (4-6).
The early identification of pregnant women at relatively high risk of deliver- ing LBW infants can enable health care workers to implement appropriate prena- tal interventions to reduce the risk of LBW. If prevention is not possible, such early notice can at least help ensure that adequate care is available for the infant at birth.
Several obstetric risk scores aimed at early detection of these high-risk mothers have been reported in the literature. With some exceptions (7, 8), these scores were evolved using populations from devel- oped areas.
A review indicates that several meth- odologic and practical problems diminish these scores’ usefulness. Among other things, outcome variables (including LBW) are seldom clearly defined. In gen- eral, LBW is simply termed “pre- maturity.” Only one score uses LBW in-
dependently of other variables (9). Many of these risk scores are calculated using subjective sampling weights based on clinical experiences rather than statis- tically derived weights (10-22). And those risk scores which are statistically derived are too complex to be used in clinical settings in a developing country (13, 24).
Although two studies have derived risk scores based on populations from developing countries (7, B), these scores’ usefulness for predicting LBW in de- veloping countries is diminished by sociocultural differences within the populations studied and methodologic problems involved in deriving the scores. Specifically, Lechtig’s score for predicting LBW in rural Guatemala (7) is simple and yields acceptable predictability rates; nevertheless, it cannot be used in an ur- ban setting because one of the main vari- ables, “housing characteristics,” differs markedly in urban and rural areas. Fort- ney and Whitehorne’s risk score (a), de- veloped in Colombia, includes data that must be obtained during labor and deliv- ery, and hence is of little or no use for early detection and referral of high-risk mothers.
In other words, a simple, empirically derived instrument is needed in de- veloping countries to identify mothers at risk of delivering LBW infants. Such an instrument could provide information useful for deciding about rational distri- bution of perinatal care resources, per- mitting allocation of more sophisticated diagnostic and treatment resources to mothers and newborns at high risk of morbidity and mortality associated with LBW.
MATERIALS AND METHODS
We selected our study population from the prenatal care clinics of the Gynecol- ogy and Obstetrics Hospital (GOH) of 140 Bulletin ofPAH0 25(2), 1992
the Guatemalan Social Security Institute in Guatemala City. This 230-bed hospital is the place where all eligible Guatemala City women who use the social security system deliver their babies. A detailed description of our study’s population characteristics and resources has been published elsewhere (25).
The study enrolled pregnant women who made their first visit to the hospital’s prenatal clinic between 1 April 1984 and 10 January 1986. Women who did not re- ceive any prenatal care (who accounted for 9% of the hospital’s deliveries) or who attended the system’s peripheral clinics (22% of the total deliveries) were not eli- gible to participate. In the latter case, this was because appropriate standardized procedures and data quality control could not be applied in the peripheral clinics.
A total of 17,135 women enrolled in the study when they registered at one of the hospital’s clinics after having their preg- nancy confirmed on-site or by a labora- tory. During each subsequent visit to the clinic, a medical record form for each woman was filled out by available per- sonnel (the nurses, a GOH resident, or the clinic staff). A social worker obtained sociodemographic data. This form, part of the GOH’s prenatal record, conforms to that proposed by PAHO for Latin America (16).
After each prenatal visit, study person- nel abstracted information from the medical record and the social worker’s form to a preceded data collection form developed especially for this study. At the time of delivery and before discharge, study interviewers visited each partici- pating mother to collect any further infor- mation needed by the study to minimize missing values in the final data set.
variables. This system was used to mini- mize the potential influence of variations in different individuals’ data collection methods. A study of inter-rater agree- ment (17) was performed to demonstrate how well these procedures worked and to evaluate the reliability of collected data.
Data were collected on 97 variables about which information was available to clinicians before and after their patient’s 26th week of gestation. These variables related to the patient’s sociodemographic status, work and physical activity during pregnancy, obstetric history, medical conditions, and prenatal care. The main outcome variable was LBW, defined as a birth weight not over 2,500 g. The in- fant’s gestational age was determined using the date of the mother’s last men- strual period and physical evaluation of the newborn (18).
To develop the risk score, we took a random sample of 30% of the total study population (N=5,125). We then calcu- lated odds ratios and 95% confidence in- tervals for all variables in the univariate analysis, retaining a particular variable for further analysis if its odds ratio was significant at the p < 0.10 level, if it showed a biologically important trend to- ward an effect on the outcome variable, or if it had a well-known association with birth weight in other populations.
The variables were then grouped into the following categories: (1) maternal work and physical activity, (2) indicators of socioeconomic status, (3) obstetric his- tory, (4) items relating to the present pregnancy and prenatal care, including drugs or treatments received during ges- tation, and (5) maternal nutritional sta- tus. Each category was analyzed sepa- rately using a logistic regression model (19). After doing these subanalyses and adjusting for all other variables, we se- lected for consideration in the final model those variables that remained statistically
significant at the p<O.O5 level. We also did a final multiple regression analysis, again using the logistic model, to select those variables that were independent predictors of the increased risk of LBW in this population.
We then transformed the logistic re- gression coefficients obtained in this final model into odds ratios. These ratios were used to weigh each variable in construct- ing the risk score, and the risk score itself was then evaluated by applying it to the 6,542 eligible women who had received prenatal care at the hospital clinic before 26 weeks of gestation but who had not been included in the foregoing analysis. Using these women as a sample, the sen- sitivity, specificity, and predictive value of a range of risk scores were assessed (20). We also charted sensitivity versus specificity for different risk scores in or- der to help in selecting the best score to use as a cutoff point for identifying mothers at high risk of delivering LBW infants (21).
RESULTS
In the univariate analysis (used to de- rive a crude odds ratio and 95% confi- dence interval), neither the variables in- dicating socioeconomic status (marital status, sanitation, zone of home, average number of persons per bedroom, home water supply, house floor, monthly in- come per capita) nor those related to ma- ternal work and physical activity during pregnancy yielded statistically significant odds ratios.
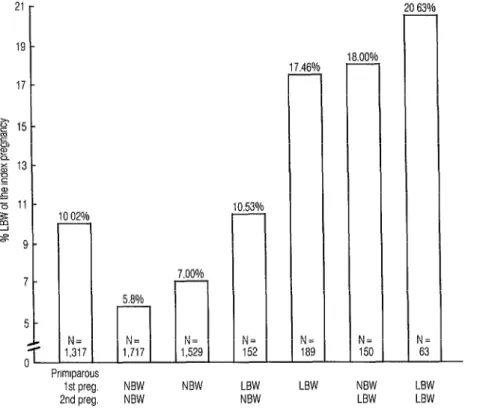
However, a history of LBW in the two previous pregnancies was strongly asso- ciated with delivery of an LBW infant (Figure 1). For mothers delivering two normal birth weight (NBW) infants (>2500 g), the incidence of LBW in the third gestation was only 5.8%. Con- versely, after delivery of two previous
Prlmlparous 1st preg. 2nd preg.
NBW LBW
LBW LBW NBW NBW LBW LBW
NBW NBW
Figure 1. Influence of birth weights of the study mothers’ previous deliveries upon birth weights of the infants studied. (NBW = normal birth weight.)
17 46% L
N= 189 - -
1.00% -
N= 150 - -
63% -
N= 63 -
LBW infants, the incidence of LBW in the third pregnancy was 20.6%.
Interestingly, the birth weight of the immediately preceding pregnancy had
the strongest effect on the next birth weight. As Figure 1 shows, an NBW de- livery followed by an LBW delivery was associated with an LBW rate on the next delivery of 18.0%. In contrast, an LBW delivery followed by an NBW delivery was associated with an LBW rate on the next delivery of only 10.5%.
Multivariate analysis yielded the fol- lowing results: The presence of medical pathology during pregnancy (respiratory infections before 26 weeks of gestation, vaginal hemorrhage, cardiopathy, hyper- tension, diabetes) was found to indepen- dently increase the risk of LBW. Mothers who did not make their first visit to the
prenatal clinic until after 19 weeks of ges- 142 Bulletin ofPAH0 25(2), 1991
tation had an odds ratio of 1.53 (95% CI 1.08-2.18). Mothers over 35 years old were twice as likely as others in the sam- ple to deliver LBW infants. Mothers un- der 17 years of age seemed more likely to deliver LBW infants (odds ratio 1.98, 95% CI 0.90-4.37) than did those 17-19 years old (odds ratio 1.53, 95% CI 0.98-2.40), although the observed associations were not statistically significant. A previous LBW was associated with an increased risk of LBW, the odds ratio being 5.55 if the previous birth weight was less than 1,500 g and 2.18 if it was between 1,501 g and 2,500 g. Two indicators of early ma- ternal nutritional status, maternal weight at first visit <47 kg (odds ratio 1.73, 95% CI 1.10-2.71) and weight gain per week
tional factors. Finally, uterine height be- low the tenth percentile was associated with an increased risk of LBW (odds ratio 1.78,95% CI 1.32-2.40).
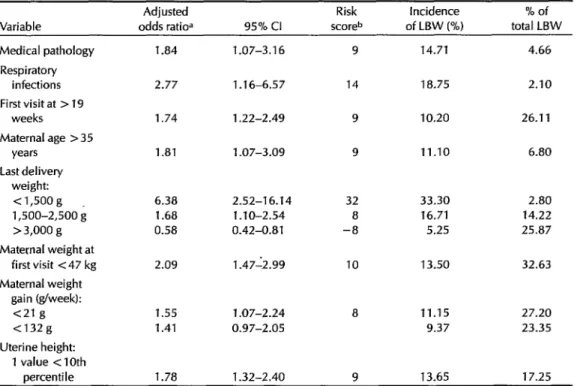
All these variables identified in the subgroup analysis were included in the final logistic regression model to identify those which were independent contribu- tors to the incidence of LBW, after the other variables in the model were ac- counted for (Table 1). We used these lat- ter variables to construct a risk score in- dex, multiplying the odds ratio for each variable by 5.0063 and rounding off to ob- tain a whole number representing the risk score for that variable. Then, by add- ing together the scores corresponding to the variables present in each case, it was possible to assign a total score (corre-
sponding to an LBW risk level) to each pregnant woman before her 26th week of gestation. A maximum score of 100 was possible if all the adverse variables were present.
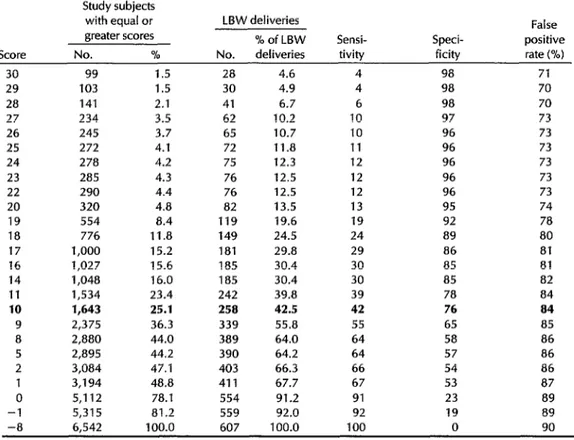
When risk scores were assigned to the 6,542 enrolled women who had received prenatal care at the hospital clinic but were not included in the foregoing analy- sis, it was found, as would be expected, that relatively high cutoff scores yielding increased sensitivity also produced de- creased specificity. Table 2 shows the pat- tern involved. In our case, using a risk score between 5 and 10 to select mothers at high risk of LBW delivery was found to produce a sensitivity of 4264% and a specificity of 57-76%.
Naturally, the best cutoff point to
Table 1. Adjusted odds ratiosa for variables associated with low birth weight (LBW) deliveries among 5,125 women selected at random from the study population. Logistic regression analysis: number of LBW deliveries = 429, logistic regression = 364; number in total sample = 5,125, logis- tic regression = 4,447.
Variable
Adjusted
odds ratioa 95% Cl
Risk Incidence % of scoreb of LBW (%) total LBW
Medical pathology Respiratory
infections First visit at > 19
weeks
Maternal age > 35 years
Last delivery weight:
<1,5oog 1,500-2,500 i > 3,000 g Maternal weight at
first visit <47 kg Maternal weight
gain (g/week): <21 g <132g Uterine height:
1 value < 10th oercentile
1 .a4 1.07-3.16
2.77 1.16-6.57
1.74
1.81
1.22-2.49
1.07-3.09
6.38 2.52-16.14 32 33.30 2.80 1.68 1.10-2.54 8 16.71 14.22 0.58 0.42-0.81 -8 5.25 25.87
2.09
1.55 1.07-2.24 1.41 0.97-2.05
1.78 1.32-2.40 9 13.65 17.25 1.47-2.99
9
14
9
9
10 13.50 32.63
8
14.71
i a.75
10.20
11.10 6.80
11.15 27.20 9.37 23.35 4.66
2.10
26.11
aAdjusted odds ratios were obtained from the natural antilog of the logistic regression coefficient.
bThe risk score was obtained by multiplying the odds ratio for each variable by a scaling factor of 5.0063 to obtain a maximum of 100 if all the risk factors (including a last delivery birth weight < 1,500 g) were present in a pregnant woman.
Table 2. Cumulative distribution by total risk score of the 6,542 women to whom the risk scores shown in Table 1 were applied, showing the distribution of LBW deliveries predicted by adopting each particular score as a cutoff-together with the sensitivity, specificity, and percentage of false positive results obtained by applying each cutoff.
Score
Study subjects with equal or greater scores No. %
LBW deliveries % of LBW No. deliveries
Sensi- tivity
Speci- ficity
False positive rate (%)
30 29 28 27 26 25 24 23 22 20 19 18 17 16 14
11
10 9 8 5 2
0 -1
99 1.5 28 4.6 4 98 71
103 1.5 30 4.9 4 98 70
141 2.1 41 6.7 6 98 70
234 3.5 62 10.2 10 97 73
245 3.7 65 10.7 10 96 73
272 4.1 72 11.8 11 96 73
278 4.2 75 12.3 12 96 73
285 4.3 76 12.5 12 96 73
290 4.4 76 12.5 12 96 73
320 4.8 82 13.5 13 95 74
554 8.4 119 19.6 19 92 78
776 I 1.8 149 24.5 24 89 80
1,000 15.2 181 29.8 29 86 81
1,027 15.6 185 30.4 30 85 81
1,048 16.0 185 30.4 30 85 82
1,534 23.4 242 39.8 39 78 84
1,643 25.1 258 42.5 42 76 a4
2,375 36.3 339 55.8 55 65 85
2,880 44.0 389 64.0 64 58 86
2,895 44.2 390 64.2 64 57 86
3,084 47.1 403 66.3 66 54 86
3,194 48.8 411 67.7 67 53 87
5,112 78.1 554 91.2 91 23 89
5,315 81.2 559 92.0 92 19 89
-8 6,542 100.0 607 100.0 100 0 90
choose in any given situation will depend on factors related to medical treatment and health services available to the popu- lation. It is also true that sensitivity and specificity will vary in different popula- tions, depending among other things upon the prevailing incidence of LBW de- liveries. Similarly, the percentage of false positive results and the risk scores’ psi- tive predictive value (a value equalling 100 minus the percentage of false posi- tives) are strongly influenced by the inci- dence of LBW in the population in- volved . Therefore, it should be understood that the results cited here ap- ply only to the specific population studied.
As shown in Table 2, we calculated the proportion of the population included at different cutoff points and the extent to which application of the risk scores at those cutoff points would have predicted LBW. For example, if those 1,534 women (23.4%) with a risk score of 11 or higher had been deemed at high risk of LBW, we would have predicted 39.8% of the LBW deliveries (sensitivity 39%, specificity 78%, false positive rate 34%).
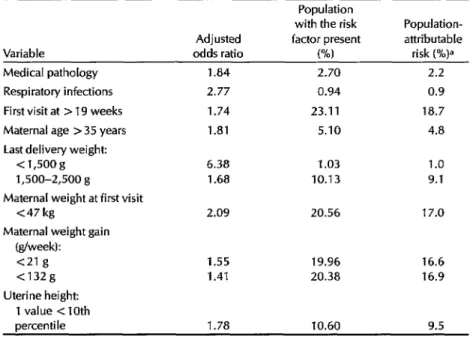
Table 3 shows the population-attributa- ble risk of the different variables signifi- cantly associated with LBW, population- attributable risk being defined as the
extent to which the outcome variable (LBW) could be reduced by eliminating
Table 3. Attributable risks for the variables directly associated with LBW (p<O.O5).
Population
with the risk Population- Adjusted factor present attributable Variable odds ratio (W risk (%)a Medical pathology
Respiratory infections First visit at > 19 weeks Maternal age > 35 years Last delivery weight:
<1,5oog 1,500-2,500 g Maternal weight at first visit
<47 kg
Maternal weight gain (g/week):
<21 g <132g Uterine height:
1 value < 10th
1.84 2.70 2.2
2.77 0.94 0.9
1.74 23.11 18.7
1.81 5.10 4.8
6.38 1.03 1.0
1.68 10.13 9.1
2.09 20.56 17.0
1.55 19.96 16.6
1.41 20.38 16.9
percentile 1.78 10.60 9.5
aThe attributable risk for the total population (as a percentage of the total risk) is expressed by the fol- lowing equation:
Attributable risk (%) = 1OOF (OR - 1) 1 +F(OR-1)
where F is the decimal portion of the population with the risk factor present and OR is the odds ratio.
the particular risk factor in question from tions during pregnancy and the previous the population. This was calculated for
all the risk factors shown in Table 1,
birth of an infant weighing less than 1,500 g carried high relative risks, reduc- based on each risk factor’s prevalence in tion of these factors would have contrib- the study population and the odds ratio uted only minimally to reduction of LBW
for that factor. because of their low prevalences.
These calculations give an idea of the expected impact that preventive pro- grams could have in reducing the inci- dence of the outcome variable (LBW) un- der consideration, an impact heavily influenced by the prevalence of the risk factor involved. For example, as Table 3 shows, the number of women in our population who received late prenatal care or who had a poor maternal nutri- tional status before and during the first part of pregnancy accounted for up to 19% of the LBW infants, even though the odds ratios involved were relatively low. In contrast, while both respiratory infec-
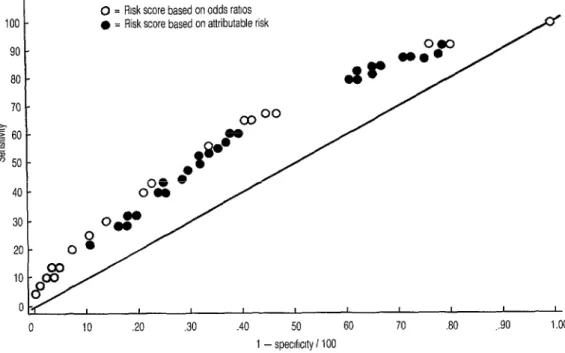
We also constructed a receiver-operat- ing characteristic curve (22) to depict the relationship between sensitivity and specificity at different cutoff levels. This curve, using reciprocal X-axis values to chart specificity, is shown in Figure 2. In this format, the closer a dot is to the diag- onal line, the less the predictive value of the particular risk score cutoff point it represents.
Such a curve can be used to select the best risk score cutoff point to employ when several combinations of variables are available or when previous scores have to be compared. For example, Fig-
0 = Risk score based on odds ratios
l = Risk score based on attributable risk
.40 50 60 70 30 ,.90 1.00 1 - speclfrclty i 100
Figure 2. Receiver operating characteristics curve for the LBW risk scores of 6,542 study women. The white dots represent risk scores based on odds ratios, while the black dots represent risk scores based on attributable risk.
me 2 compares the risk scores reflecting odds ratios (the only risk scores we have employed up to this point, see Table 1) with other risk scores reflecting popula- tion-attributable risks (see the right-hand column of Table 3 for this risk score in- dex). No significant differences were ob- served in the results obtained with the two methods.
DISCUSSION
In illustrating our method of deriving a risk score that could be used in develop- ing countries to select women at high risk of delivering an LBW infant, we chose LBW itself as the outcome variable be- cause it is the simplest dependent vari- able and the one most commonly re- ferred to in similar studies. We recognize, however, that LBW is a heterogeneous
syndrome (I, 23) and that the two causes of LBW, prematurity and intrauterine growth retardation (IUGR), can be asso- ciated with different risk factors (23).
The variables we selected by using a multiple regression logistic model are similar to ones previously reported as be- ing associated with LBW. Various mater- nal medical complications early in preg- nancy are known indicators of maternal health before pregnancy (8). The effect of late prenatal care attendance, measured by gestational age at the first visit, is also recognized as a risk factor for adverse pregnancy outcomes (8, 24), though it has been suggested that this adverse ef- fect may be due to some methodologic limitations of the published studies (25, 26). Another well-recognized risk factor for LBW, a woman’s history of delivering LBW infants or infants of low gestational
age (27), is also recognized as a risk factor for delivering both preterm (28) and IUGR (29) infants.
Prepregnancy weight and early mater- nal weight gain, two indicators of mater- nal nutritional status, are also associated with LBW (30). Twenty percent of the women in our study population gained less than 21 g per week, and 70% of these (14% of the total) actually
had
weight losses. The association we observed with LBW further indicates a need for early weight gain during pregnancy as a “pre- paratory” step for fetal growth during late pregnancy. In addition, our data con- firm that systematic use of uterine height measurements provides an excellent way of monitoring fetal growth (20, 31-33).We found respiratory infections to ex- ert a strong independent effect on LBW. Because of the low prevalence of respira- tory infections in our population (0.94%), their effect on the overall incidence of LBW was very slight (attributable risk = l%, see Table 3).
Respiratory infections could be seen as a proxy indicator of overall maternal health rather than as a direct influence on LBW. However, this indicator’s indepen- dent significant association and lack of an interaction effect with other indicators of maternal nutritional status point more toward a causal or direct relationship. Recently, a preventive effect of erythromycin treatment on LBW has been reported (34). It could be that this effect is mediated, at least partially, through an effect on respiratory as well as vaginal infections (34).
Our risk score index uses data obtained before 26 weeks of pregnancy. Data on some of the variables used (e.g., mater- nal age, last delivery weight) can be ob- tained at any time during pregnancy, but others (e.g., weight gain, uterine height) require an early prenatal care visit. Our analysis used 26 weeks as the latest time at which information should be obtained.
If high-risk mothers are detected as early as that in pregnancy, it is likely that inter- ventions to prevent LBW deliveries would have a chance of being effective. After 26 weeks, the probability of preven- tion would be lower; and referring pa- tients to a tertiary care center for their delivery might then be the only available course in preparing to deal with a pre- dicted problem.
Several methodologic problems can help to explain the poor performance to date of previously published risk scores. For one thing, the outcome variable is of- ten not clearly stated (8). Also, risk scores have sometimes been evaluated without using the most appropriate epidem- iologic methods (20), or the methods have been poorly described in the pub- lications-less information being pro- vided than what is needed to allow the
reader to perform the evaluation. Also,
the screening is sometimes done too late
in pregnancy to permit successful pre- ventive interventions (8); and the weights assigned to each variable are sometimes derived without using appro- priate statistical techniques. In our analy- sis, we have tried to overcome all of these limitations.
One limitation we could not control in this study was the effect of “treatment” on pregnancy outcome. It is possible that physicians, by providing treatment in re- sponse to the presence of a known risk factor, thereby avoided the negative out- come. A mother originally classified as having a high-risk pregnancy could thus deliver a normal (2,500 g) infant as a re- sult of treatment and be registered in the evaluation as a false positive result. How- ever, while such possible misclassifica- tion seems relatively likely to affect deliv- ery outcome variables involving death or morbidity, it seems less likely to affect LBW-particularly in this study, where no special intervention was offered. This does not exclude the possibility that the
high false positive rate observed in ap- plying our risk scores might to some de- gree represent an overestimation.
The best overall predictability was ob- tained when 25% of the population was classified as being at high risk (score = 10, with high-risk mothers accounting for 42% of all LBW deliveries). At this cutoff point sensitivity was 42%, specificity was 76%, and the false positive rate was 84% (see Table 2).
It should be noted that the false posi- tive rate is heavily influenced by the inci- dence of LBW in the population (20). That is, the lower the incidence the higher the false positive rate. Thus, when the risk score approach described is used in other developing populations with higher LBW rates, the score may show lower false positive rates and higher posi- tive predictive values than those ob- tained for our study population, where the LBW rate was 8.4%. Unfortunately, populations with higher LBW rates tend to have fewer prenatal care services avail- able and tend to start prenatal care later in pregnancy, when data on some of the important variables (e.g., early weight gain) are difficult to obtain.
Of course, the cutoff point applied above is by no means the only one that might have been selected for use with this risk score. The final selection of the cutoff value depends on several factors. For one thing, the value selected always represents a trade-off between sensitivity and specificity. For another, the selection made should depend on the severity and incidence of the outcome (LBW), the availability of preventive measures, and the financial cost of the intervention of- fered-particularly in a situation involv- ing high false positive values. It should also be remembered that by and large a change in the cutoff point will not im- prove the accuracy of prediction pro- vided by the risk score; it will only take from one desired element (sensitivity or 148 Bulletin of PAHO 25(2), 1991
specificity) and give to the other. That is because improving the accuracy of pre-
diction depends not on the cutoff value but upon developing a better risk score, devising better operations (providing su- perior information quality and data col- lection), or selecting a population with a higher incidence of LBW.
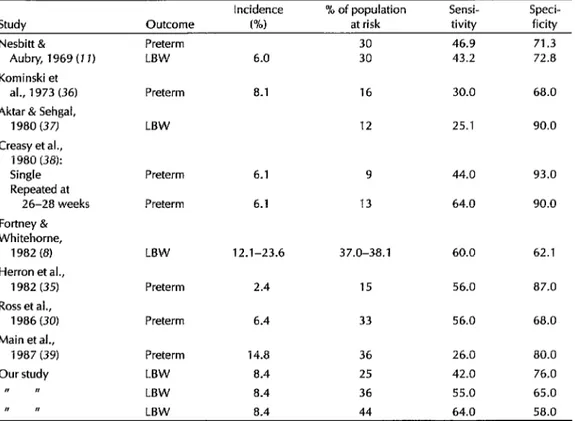
The sensitivity and specificity of the risk score employed here are similar to the sensitivities and specificities of other risk scores used to predict LBW or pre- maturity in several populations in both developing and developed countries (Table 4). Two of three studies shown in that table which predicted LBW yielded sensitivities and specificities closely re- sembling those of the present study, while most of those predicting preterm deliveries were within the same general range. This indicates that risk scores are fairly successful at taking a population of pregnant women and identifying a high- risk sample that includes between 40% and 75% of all the women who will deliver LBW infants.
Table 4. Prediction abilities found for different risk score systems seeking to predict LBW or prematurity.
Incidence % of population Sensi- Speci- Study Outcome PM at risk tivity ficity
Nesbitt & Preterm 30 46.9 71.3
Aubry, 1969 (7 1) LBW 6.0 30 43.2 72.8 Kominski et
al., 1973 (36) Preterm 8.1 16 30.0 68.0
Aktar & Sehgal,
1980 (37) LBW 12 25.1 90.0
Creasy et al.,
1980 (38):
Single Preterm 6.1 9 44.0 93.0
Repeated at
26-28 weeks Preterm 6.1 13 64.0 90.0 Fortney &
Whitehorne,
i 982 (8) LBW 12.1-23.6 37.0-38.1 60.0 62.1 Herron et al.,
i 982 (35) Preterm 2.4 15 56.0 87.0
Ross et al.,
1986 (30) Preterm 6.4 33 56.0 68.0
Main et al.,
i 987 (39) Preterm i 4.8 36 26.0 80.0
Our study LBW 8.4 25 42.0 76.0
I, N LBW 8.4 36 55.0 65.0
I I, LBW 8.4 44 64.0 58.0
proving our knowledge in these areas may allow us to select more specific indi- cators for predicting LBW.
An important question arises here. Could the risk factors found in our low- income Guatemalan population be used in another developing country? Or would every country have to invest a considerable amount of money to iden- tify its own risk factors? The available evi- dence suggests it may not be necessary to implement longitudinal studies of risk factors in all health regions or countries. The biological association between risk factors and pregnancy outcome has been documented, and with some exceptions its magnitude appears to be relatively constant through the populations stud- ied. Thus, determining the prevalence of a given risk factor and using that infor-
mation to determine the attributable risk within and among populations could be- come an important epidemiologic tool for planning and organizing perinatal health interventions. The alternative-imple- menting a study like ours in Guatemala that requires establishment of a new structure parallel to the hospital bureau- cracy-may entail excessive costs for a developing country.
We believe that our risk score could be used as a “basic” risk score for most of the urban populations in developing countries, and that those conducting the study should add “specific” risk factors for a given population only if the basic set proves not to have much discriminatory power to detect mothers in early preg- nancy who are at high risk of delivering LBW infants. To improve the predict-
ability of LBW deliveries, we suggest that when an initial screening yields a high percentage of false positives but a low percentage of false negatives, some of the following activities should be imple- mented: By 32-34 weeks of gestation, all women who were previously classified as being at high risk could be systematically rescreened using techniques such as ul- trasound examination to monitor fetal growth. Women with a history of pre- term deliveries could be clinically eval- uated for cervical dilatation and uterine contractibility, or could monitor their own uterine activity, or both. And women with a previous IUGR delivery could be evaluated by fetal movement counting. It is also true, of course, that some of these suggested activities would need to be systematically evaluated be- fore being applied to large populations.
Acknowledgments. The authors are grateful to Dr. Brian McCarthy from the CDClWHO Perinatal Collaborating Cen- ter Activity for his critique of the manu- script. We are also grateful to the staff and authorities of the Gynecology and Obstetric Hospital of the Guatemalan So- cial Security Institute for their collabora- tion, to all the clerks of the Guatemalan Perinatal Study for the assistance they provided, and especially to Mrs. Gloria Garcia, Field Director of that study.
REFERENCES
Villar J, Belizln JM. The relative contri- bution of prematurity and fetal growth retardation to low birth weight in devel- oped and developing societies. Am 1 Obstef Gynecol. 1982;143:793-98.
Low JA, Balbraith RS, Muir D. Intra- uterine growth retardation: a prelimi- nary report of long-term morbidity. Am J Obstet Gynecol. 1978; 130:534-45.
Fitzhardinge PM, Steven EM. The small- for-date infant: II, neurological and intel-
4.
5.
6.
7.
8.
9.
10.
11.
12.
13.
14.
15.
lectual sequelae. Pediatrics. 1972;50: 50-57.
Villar J, Beliz6n JM, Spalding D, Klein R. Postnatal growth of intrauterine growth retarded infants. Early Hum Dev. 1982;6:265-71.
Cruise MO. A longitudinal study of the growth of low birth weight infants: I, ve- locity and distance growth, birth to 3 years. Pediatrics. 1973;51:620-28.
Villar J, Smeriglio V, Martorell R, Brown HC, Klein R. Heterogeneous growth and mental development of intrauterine growth retarded infants during the first three years of life. Pediatrics. 1984;74: 783-91.
Lechtig A, Delgado H, Yarbrough C. A simple assessment of the risk of low birth weight to select women for nutri- tional intervention. Am J Obstet Gynecol. 1976;125:25-34.
Fortney JA, Whitehorne EW. The devel- opment of an index of high-risk preg- nancy. Am J Obstet Gynecol. 1982;143: 501-08.
Feisner V, Brazied JV, Pratt MW. The risk of low birth weight. Am J Public Health. 1979;69:887-93.
Godwin JM, Dunne JT, Thomas BW. An- tepartum identification of the fetus at risk. Can Med Assoc J. 1969;101(458): 57-67.
Nesbitt REL, Aubry RI-I. High-risk ob- stetrics: II, value of semiobjective grad- ing system in identifying the vulnerable group. Am J Obstet Gynecol. 1969;103: 972-85.
Hobel CJ, Yonkeles L, Forsythe A. Pre- natal and intrapartum high-risk screen- ing: I, prediction of the high-risk neo- nate. Am J Obsfef Gynecol. 1973;117:1-9. Fredrick J. Antenatal identification of women at risk of spontaneous pre-term birth. BY] Obstet Gynecol. 1976;83:351-54. Donahue CL, Wan TTH. Measuring ob- stetrics risks of prematurity: a prelimi- nary analysis of neonatal death. Am J Ob- sfet Gynecol. 1973;116:911-15.
Kestler E, Dorgan J, Sibrian R, Aquino 0, Villar J. Epidemiological identification of low birth weight in urban areas in Latin America: I, organization, popula- tion, and methodology of the Gua- temalan Perinatal Study. Bull Pan Am Health Organ. 1987;21(4):369-76.
16.
17.
18.
19.
20.
21.
22.
23.
24.
25.
26.
27.
28.
Belizan JM, Dfaz AG, Gioconmini H, et al. Historia clinica perinatal: propuesta de un modelo. Buenos Aires: Ministerio de Bienestar Social, Secretaria de Estado de Salud Publica, Direction National de Maternidad e Infancia, Centro Latinoamericano de Administracidn Medica;1976.
Villar J, Dorgan J, Menendez R, Bolar?os L, Pareja G, Kestler E. Perinatal data re- liability in a large teaching obstetric unit. Br J Obsfet Gynecol. 1988;95:841-48. Capurro H, Konichezky S, Fonseca D, Caldeyro-Barcia R. A simplified method for diagnosis of gestational age in the newborn infant. J Pediatr. 1978;93: 120-22.
Kleinbaum D, Kupper L, Chambless L. Logistic regression analysis of epidem- iological data: theory and practice. Com- mon Stat Theory and Methods. 1982; 11:485-547.
Villar J, Belizan JM. The evaluation of the methods used in the diagnosis of intra- uterine growth retardation. Obsfet Gyne- co1 Swv. 1986;41:187-99.
Richardson DK, Schwartz JS, Weinbaum PJ, Gabbe SG. Diagnostic tests in obstet- rics: a method for improved evaluation. Am J Obsfet Gynecol. 1985;152:613-18. Her&in AA, liwig LM, Groeneveld HT. Evaluating obstetrics risk scores by re- ceiver operating characteristics curves. Am J Epidemiol. 1988;127:831-42.
Villar J, Khoury MJ, Finucane FF, Del- gado H. Differences in the epidemiology of prematurity and intrauterine growth
retardation. Early Hum Den.
1986;14:307-20.
Barros F, Victoria C, Vaughan JP, Smith l? Bajo peso al nacer en el municipio de Pelotas, Brazil: factores de riesgo. BoZ Of Sanit Panam. 1987;102:541-43.
Strachan D. Antenatal booking and peri- natal mortality in Scotland 1972-1982. Inf J Epidemiol. 1987;16:229-31.
Chng PK, Hall M, et al. An audit of an- tenatal care: the value of the first antena- tal visit. Br Med J. 1980;281:1184-87. Kaltreider DF, Johnson JWC. Patients at high risk for low birth-weight delivery. Am J Obsfef Gynecol1976;124:251-54. Carr-Hill RA, Hall MA. The repetition of
29.
30.
31.
32.
33.
34.
35.
36.
37.
38.
39.
spontaneous preterm labor. Br J Obstet Gynecol. 1985;92:921-23.
Bakketeig L, Bjerkedal T, Hoffman H. Small for gestational age births in SUC-
cessive pregnancy outcomes: results from a longitudinal study of births in Norway. Early Hum Dee. 1986;14:187-89. Ross M, Hovel C, Bragonier JR, Bear M, Bemis RL. A simplified risk-scoring sys- tem for prematurity. Am J Perinafol. 1986;3:339-41.
Belizan JM, Villar J, Nardin JC. Diag- nosis of intrauterine growth retardation by a simple clinical method: measure- ment of uterine height. Am J Obstet Gyne-
col. 1978; 131:64345.
Quaranta P, Currell R, Redman CW, Rob- inson JS. Prediction of small for dates infants by measurement of symphysial- fundal height. BY J Obstet Gynecol. 1981; 88:115-19.
Pearce M, Campbell S. A comparison of symphysis-fundal height and ultrasound as screening test for light-for-gestational age infants. Br J Obsfet Gynecol. 1987;94:100-04.
Kass EH, McCormack WM, Lin JS, Rosner B, Muiioz A. Genital my- coplasmas as a cause of excess prema- ture delivery. Trans Assoc Am Physicians. 1981;94:261-66.
Herron MA, Katz M, Creasy RK. Evalua- tion of a preterm birth prevention pro- gram: preliminary report. Obstet Gynecol. 1982;59:452-56.
Kominski M, Gouford J, Runeau-Rou- quette C. Prediction of low birth-weight and prematurity by a multiple regression analysis with maternal characteristics known since the beginning of the preg- nancy. Int J Epidemiol. 1973;2:195-204. Akhtar J, Sehgal NN. Prognostic value of prepartum and intrapartum risk-scoring method. South Med J. 1980;73:411-14. Creasy RK, Gummer BA, Liggins GC. System for predicting spontaneous pre- term birth, Obsfef GynecoI. 1980;55: 692-95.
Main D, Richardson D, Gabbe S. Pro- spective evaluation of a risk scoring sys- tem for predicting preterm delivery in black inner city women. Obsfef Gynecol. 1987;69:61-66.