ABSTRACT
Gas production in broiler houses and their emissions are closely related to the microclimate established inside the house according to air temperature, humidity, and velocity. Therefore, the internal house environment is influenced by building typology and ventilation system. The objective of the present study was to evaluate ammonia emission rates in broiler houses equipped with different ventilation systems (negative or positive pressure) and litter conditions (new or built-up). The environment of six commercial broiler houses was evaluated internal and external NH3 concentrations. Ventilation rates were recorded to estimate ammonia emission rates. The efficiency of circulation and exhaust fans was assessed, and higher ventilation rates were determined in negative-pressure houses due to the higher flow of the fans. Houses with new litter increased ammonia emission rates along the rearing period, indicating the relationship between gas emissions, bird age and ventilation rates, and presented a typical curve of NH3 emission increase. Negative-pressure houses with built-up litter presented higher emission rates during the first rearing week due to the high NH3 concentration during the brooding period, when the ventilation rates required to maintain chick thermal comfort are low. Although the results of the present study indicate an advantage of the positive-pressure systems as to gas emissions, further research is needed reduce gas emissions in broiler houses with negative-pressure systems.
INTRODUCTION
The broiler industry is one of the most technology-intensive and automated livestock activities. Its rapid progress during the past 50 years was allowed by improvements in the field of nutrition, which has promoted higher broiler weight gain in increasingly shorter periods, and in genetics, with the development of high-yield strains. Moreover, advances in the environmental control of broiler houses, providing thermal comfort, has allowed broilers to express their genetic potential. Despite the advances in ventilation systems, it is difficult to analyze their performance, mainly due to changes in ventilation patterns and the use of different equipment in a same house, as reported by several studies (Vranken et al., 2005; Casey et al., 2008; Calvet et al., 2010). The inaccuracy in the evaluation of gas emissions is probably due to factors such as long ventilation systems inside the poultry houses, and the complexity of measurement of air renewal in naturally-ventilated houses (Hinz & Linke, 1998; Calvet et al., 2010). Ventilation rate was identified as a major source of uncertainty when evaluating gas emissions from livestock production (Gates et al., 2009). Moreover, the understanding of some relations generated inside poultry houses, such as gas concentration and emission, may be a challenge.
nAuthor(s)
Lima KAO1
Moura DJ2
Carvalho TMR3
Bueno LGF4
Vercellino RA5
1 Post-graduation student, School of
Agricultural Engineering, Universidade
Estadual de Campinas.
2 Professor, School of Agricultural
Engineering, Universidade Estadual de Campinas.
3 Post-graduation student, School of
Agricultural Engineering,Universidade
Estadual de Campinas.
4 Professor, Schoolof Animal Science,
Universidade Estadual “Julio de Mesquita Filho”.
5 Post-graduation student, School of
Agricultural Engineering, Universidade
Estadual de Campinas.
nMail Adress
E-mail: daniella.moura@feagri.unicamp.br
nKeywords
Broiler production, gas emissions, ventilation systems.
Submitted: February/2011 Approved: September/2011
nAcknowledgements
and were equipped with fans with diameters between 0.91 and 1.29 m. Negative-pressure houses were also equipped with a cooling pad placed on the opposite wall of the exhaust fans. Litter materials were a mixture of rice and coffee hulls or wood shavings.
Adiabatic evaporative cooling was also provided by foggers distributed throughout the house. In all six broiler houses, two ventilation management systems were used to maintain the recommended environmental temperature: natural ventilation with side ventilation or tunnel ventilation. In the positive-pressure houses C1 and C2, ventilation rate was controlled by opening of side curtains. In the negative-pressure houses B1, B2, D1 and D2, ventilation rate was controlled by intermittently turning on the exhaust fans.
Straight-run Cobb® broilers were reared to a market
age of 42-49 days. Birds were fed a commercial diet and water was supplied in nipple drinker. Feed and water were supplied ad libitum during the entire rearing period.
As gas emission rates are a combination of air pollutant concentrations and ventilation rates, measurement techniques were based in gas concentrations and on ventilation flow to calculate house ventilation rates. Emissions were estimated using the following equation, adapted from Zhang et al. (2005) and described as:
AER = Q (NH3air, house – NH3air, out),
where: AER = ammonia emission rate (kg h-1), Q
= ventilation rate (m3 h-1), NH
3air, house = air ammonia
concentration inside the broiler house (kg m-3) and NH 3
air, out = air ammonia concentration outside the house (kg m-3). The estimates obtained from the equation
were then calculated for a 24h cycle (day), and units were transformed into grams per bird.
The concentration of NH3 was measured using a portable gas analyzer (BW Technologies®), which
monitors atmospheric levels of up to five gases, including carbon monoxide (CO), oxygen (O2), ammonia (NH3), hydrogen sulfide (H2S), and combustible gases (LEL). Despite the large number of studies published
on this subject in poultry production (Harper et al., 2010), gas emission rates are difficult to compare due to differences in geographic locations, management practices, and litter material (Vergé et al., 2009), leading to wide variations in the estimation of green-house gas emissions, according to Pescatoreet al. (2005). Other authors also mention bird age, nutrition, and litter conditions as sources of variation in gas emission estimation (Fergusson et al., 1998; Casey et al., 2004 and Wheeler et al., 2006).
Broilers houses present substantial differences in mechanic ventilation systems. The positive-pressure system is based on circulation fans, and most houses with this system are equipped with yellow curtains. Houses with negative-pressure systems use exhaust fans and blue curtains (blue houses) or are completely closed, and are called dark houses, which are also characterized by low lighting intensity.
These differences among broiler houses must be considered when evaluating the relationship between commonly used ventilation systems and the house environment. Based on this knowledge, improvements can be made in house air quality and litter conditions, thereby reducing health problems, carcass downgrading, and consequently, improving meat quality.
This study aimed at evaluating ammonia emissions in broiler houses with different ventilation systems and litter conditions (new or built-up litter).
MATERIALS AND METHODS
The study was carried out between 2008 and 2009 in three commercial broiler farms located in Capivari, Pedreira and Monte Alegre do Sul, state of São Paulo, Brazil. Six commercial broiler houses with mechanic ventilation were monitored during the rearing period of two flocks. The broiler houses presented two air renewal systems: negative pressure (houses B1, B2, D1 and D2) and positive pressure (C1 and C2). Table 1 shows the description of the broiler houses.
Houses were 3.5m high under the dropped ceiling,
Table 1 - Information on broiler houses monitored for ammonia emissions in the presente study.
Houses Ventilation system Dimensions (m) Number of fans
(diameter in m)
Housing density (bird m-2)
Total n. birds
housed Litter condition
B1 Negative pressure 13x125 8 (1.22) 14.1 23000 New
B2 (Blue Houses) 22x90 10 (1.22) 15.1 30000 Built-up
C1 Positive pressure 12x120 10 (0.91) 13.8 20000 New
C2 12x120 10 (0.91) 14.0 20200 Built-up
D1 Negative pressure 18x120 10 (1.29) 15.8 34000 New
Ventilation rate was measured using a vane thermo-anemometer (Model 451126, EXTECH, Waltham, MA). The anemometer was used to measure air velocity at 18 points on the fan surface at a distance of approximately 5 cm from each fan. Mean velocity was calculated and multiplied by the fan area to obtain the estimated ventilation rate (ASHRAE, 2009). Total ventilation rate was calculated as the sum of the flow rates of each fan.
The evaluated broiler houses were divided in six equally distant points, where measurements were weekly made at bird height (0.30 m). Gas concentration and ventilation rates were measured at four different times: 9h00min, 11h00min, 14h00min and 16h00min. Emission data were also weekly evaluated to estimate mean emission per bird in both ventilation systems and in both litter conditions (new or built-up litter).
Statistical analyses were performed with the aid of Statgraphics Plus 5.1® software program. Ammonia
emission rate data were submitted to analysis of variance.
RESULTS AND DISCUSSION
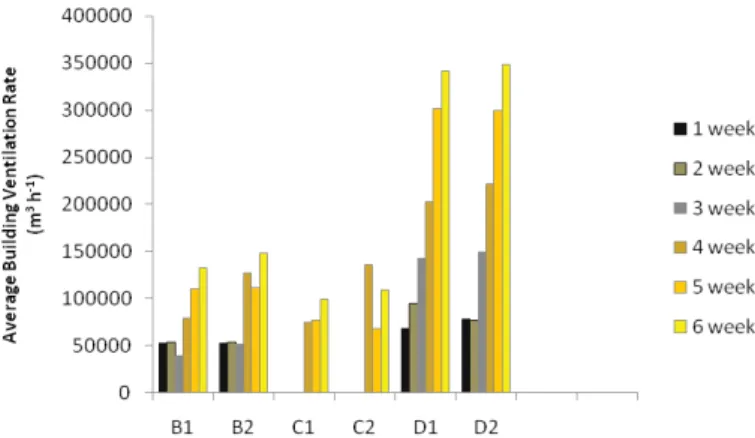
Ammonia emission rate was calculated by multiplying ammonia concentration by ventilation rate, which was measured according to the performance of the fans. Fan average capacities were 21538, 23381, 13012, 13761, 34147 and 34807 m3 h-1 in houses B1,
B2, C1, C2, D1 and D2 respectively. House ventilation rates are shown in Figure 1.
Figure 1 – Average building ventilation rate from week 1 to 6 of the rearing period.
Figure 1 shows higher ventilation rates in dark houses D1 and D2 due to the higher air flow of the exhaust fans. However, the differences in ventilation rates can also be attributed to differences in flow caused by shutters, engine capacity, and by the wear
of the fan components caused by time of use. The average ventilation rates of 1.22m diameter exhaust fans in houses B1 and B2 were lower than those reported by Calvetet al. (2010), who obtained 34,000 m3 h-1 for exhaust fans of the same diameter. According
to Casey et al. (2008), the ventilation efficiency of identical exhaust fans can vary up to 24%.
As ventilation rate is highly dependent on weather and bird size, there is a high potential for high gas emissions even in poultry houses with low NH3 concentrations due to the high ventilation rates used to provide thermal comfort and environmental control in these houses. According to Demmerset al. (1999), the ventilation rates in broiler houses can increase from 4000 m3 h-1 up to 42000 m3 h-1, particularly
during periods of temperature extremes in the summer. However, independently of season, 60% of the negative-pressure systems can be operated to maintain thermal comfort after the second week of rearing (Czarick, 2006). On the other hand, in positive-pressure systems, curtain management is commonly used as minimal ventilation for air renewal during the first week of rearing, as observed in houses C1 and C2, which fans were not turned on during brooding.
These differences in fan management make ventilation comparisons between positive and negative pressure systems difficult. As mentioned by Casey et al. (2008), the main source of uncertainty in the assessment of gas emissions is related to house ventilation rates, possibly due to sampling error, effects of wind dynamics, and to replacement and maintenance of equipment during the experiment.
Ammonia emission rates increase with bird age (Elwinger & Svensson, 1996, Redwine et al., 2002, Liu et al., 2006) due to the increase in nitrogen excretion during rearing, which is significant as birds approach market age. The ventilation rates required to maintain thermal comfort according to bird age should also be considered. Figure 2 shows ammonia emission rates in the studies broiler houses during the entire rearing period.
Ammonia emission in houses with new litter (B1, C1 and D1) increased along the rearing weeks, demonstrating the effect of the correlation between broiler age and ventilation rate on gas emission. The graph shows a typical growth curve of NH3 emission rate.
thermal comfort. Similar conditions were observed in the dark house D2, where minimal ventilation was not sufficient for air renewal.
Figure 2 – Average ammonia emission rates (AER) from week 1 to 6 of the rearing period.
The graph also shows that there were no emission rates in houses C1 and C2 in the first weeks of rearing. The estimate of ammonia emission was virtually zero in these houses during brooding due to the low ventilation rates, and therefore, it was not possible to collect emission data. Total emission rate in the houses was low during the entire rearing period. This indicates the linear relationship between gas emissions, bird age, and litter condition, as described in literature (Casey et al., 2004; Wheeler et al., 2006 and Gates et al., 2008; Casey et al., 2010).
Taking that relationship into account, a model was developed to estimate emission rate as the product of a factor (0.031) multiplied by the variablex, which would be bird age lower than seven days and new litter (Wheeler et al., 2006), when ammonia emission would be considered as zero. However, in the present study, this happened only due to the lack of ventilation in both positive-pressure houses (C1 and C2), indicating that the lack of ammonia emission was influenced only by ventilation rate, independently from litter conditions. In addition, the model considers that it is possible to evaluate emissions after the first week in houses both with new and built-up litter. However, it was not possible to confirm this assumption in the present experiment.
The analysis of variance (ANOVA) of the collected data is presented in Table 2 and the comparison of means is shown in Figure 3. As the p-value was significant (<0.05), the null hypothesis that all data belonged to populations with equal means was rejected.
The graph in Figure 3 allows identifying which means were significantly different. It shows the presence of three homogenous, i.e., statistically similar groups, as well as the influence of negative-pressure ventilation systems on ammonia emissions.
Figure 3 – Interval plot showing mean ammonia emissions (gNH3
bird-1 d-1) in the evaluated broiler houses.
There was no difference (p>0.05) in mean ammonia emissions among houses D1 with new litter and D2 and B2, both with built-up litter. This was probably caused by the relationship between ventilation rate and NH3 concentration in these houses, despite the significantly higher ventilation rates in the dark houses (D1 and D2) as compared to the blue house (B2). However, the low ventilation rate in B2 was compensated by the high NH3 concentrations, whereas the low ammonia concentration in D1 was compensated by its high ventilation rate.
According to Fairchild et al. (2009), during the summer, exhaust fans run approximately 96% of the rearing period in broiler houses. This explains the obtained results, as blue houses were monitored during the winter and dark houses were monitored during the summer, and therefore their ventilation rates were higher than in the other monitored houses.
The second homogenous group included houses B1 and C2, which AER were not significantly different. This emphasizes the importance on ventilation when comparing new with built-up litter.
House C1 is in the third group, which means AER was statistically different than those determined in
Table 2 – ANOVA of ammonia emission rates in the evaluated broiler houses.
Cause of variation Sum of squares Degrees of freedom Meansquare F p-value
Treatment 15.9852 5 3.19704 17.62 0.000
Residue 155.709 858 0.1814
Total 171.694 863
✁
✂
✄
☎
✆
✂
✝
✝
✞
✟
✠
☎
✡
✝
✠☛
☛
✠
✞
✟
☞
✡
✌
✍
✎ ✏ ✎ ✑ ✒ ✏ ✒ ✑ ✓ ✏ ✓ ✑
✔
✔ ✕✏ ✔ ✕✑ ✔ ✕✖ ✔ ✕✗ ✔ ✕✘ ✔ ✕✙
Average emission rates
(gNH
3
bird
-1d -1)
the other houses. This result may be explained by the combination of new litter with low ventilation rate in that house.
In general, the mean ammonia emission rates obtained in the present study are consistent with the range reported by Gates et al. (2008), who found 17.4 gNH3 bird-1 flock-1 on new litterand 25.4 gNH
3
bird-1flock-1on built-up litter. Other values were reported by Redwineet al. (2002), of 632 mgNH
3 bird
-1 flock-1,
and by the NRC (2003), of 99.7 gNH3 bird-1 flock-1.
The variability in ammonia emission estimates is related to bird age and litter conditions, as well as to bird nutrition, particularly in terms of dietary protein and amino acid content (Casey et al., 2004 and Wheeler et al., 2006). Houses with built-up litter (B2, C2 and D2) presented higher emissions per bird. According to Brewer and Costello (1999), built-up litter has high nitrogen content, and may present six times more ammonia emissions than new litter, even during the first weeks of rearing.
Table 3 presents mean AER obtained in the present study compared with the results of other studies.The AER results of the present study were lower than those obtained in the other studies shown in Table 3, but were comparable with the European research results reported by Groot Koerkamp et al. (1998) of 0.21, 0.27, 0.44, 0.48gNH3 bird-1 flock-1 for broilers reared
in Germany, the Netherlands, United Kingdom and Denmark, respectively.
However, it is difficult to compare results as the data presented in Table 3 were obtained under different conditions, such as different numbers of evaluated flocks and housing density. Harper et al. (2010) also
reported that it is complicated to compare AER results, and concluded that, despite presenting the same ranges, European AER could not be compared with AER obtained in the U.S. due to different management practices, housing types, and climate.
The assessment of gas emissions from broiler production should include all factors related to their management as well as specific characteristics and key parameters involved. Despite all obstacles, it is evident that gas emission inventories are required to evaluate the impact of animal production on the environment, and to be used as foundation of future plans for justified control and abatement measures (Seedorf, 2004).
CONCLUSION
Negative-pressure broiler houses presented higher emission rates related to the higher ventilation rates. In the present study, positive-pressure systems presented lower emission rates when new litter was used. As Brazilian climate and characteristics allow the use of positive-pressure systems in different regions, the information generated in this study could be used to reduce the impact of broiler production on the environment. Independently of ventilation system, the use of new litter for every flock housed could significantly reduce ammonia emissions, but it should be taken into consideration that it also increases production costs.
REFERENCES
ASHRAE Handbook of Fundamentals; 2009. 983p.
Brewer SK, Costello TA. In situ measurement
of ammonia volatilization from broiler litter using an enclosed air chamber. Transactions of ASAE 1999; 42(5):1415-1422.
Burns RT, Xin H, Gates RS, Li H, Overhults D, Moody L, Earnest JW. Ammonia emission from poultry broiler systems in the southeastern United States. Proceedings of the International Symposium on Air Quality and Waste Management for Agriculture; 2007; St. Joseph, Michigan. St.Joseph: ASABE.; 2007.
Calvet S, Cambra-López M, Blanes-Vidal V, Estellés F,Torres AG. Ventilation rates in mechanically-ventilated commercial poultry buildings in Southern Europe: Measurement system development and uncertainty analysis. Biosystems Engineering 2010; 1(06):423-432.
Table 3 – Ammonia emission rates obtained in the present study and in studies published in the US.
Reference Rearing
period (days)
Housing density (bird m-2)
N. flocks
Litter condition
Mean NH3 emission (g bird-1day-1)
Local
Current Study
42 15 2 New 0.25
SP/Brazil
42 15 2 Built-up 0.45
42 14 2 New 0.12
42 14 2 Built-up 0.25
42 16 2 New 0.41
42 16 2 Built-up 0.51
Burns et al. (2007 ) 52 12.7 3 New 0.49 KY/EUA
52 12.2 9 Built-up 0.62
Wheeler et al. (2006)
42 14.7 10 New 0.47
KY & PN/ EUA
42 14.7 12 Built-up 0.65
49 13.4 24 Built-up 0.76
63 10.8 20 Built-up 0.98
Seifert et al. (2004) 42 20 1 Built-up 1.18 TX/EUA
Casey KD, Gates RS, Pescatore AJ, Wheeler E, Xin H. The effect of litter management on ammonia emissions from U.S. broiler chicken houses. Proceedings of the 98th Annual A&WMA Conference and Exhibition: Exploring Innovative Solutions [CD-ROM]. Pittisburg:A&WMA; 2004. (Paper 615).
Casey KD, Gates RS, Wheeler E, Xin H, Liang Y, Pescatore AJ, Ford MJ. On-Farm Ventilation fan performance evaluations and implications. Journal of Applied Poultry Research 2008; (17):283-295.
Casey KD, Gates RS, Shores RC, Thomas D, Harris DB. Ammonia emissions from a U.S. broiler house--comparison of concurrent measurements using three different technologies. Journal of the Air &Waste Management Association 2010; 60(8):939-48.
Czarick M. The best performing tunnel fans. Poultry Housing Tips 2006; 18(5):4.
Demmers TGM, Burgess LR, Short JL, Philips VR, Clark JA, Wathes CM. Ammonia emissions from two mechanically ventilated UK livestock buildings. Atmospheric Environment 1999; (2):217–227.
Elwinger K, Svensson L. Effect of dietary protein content, litter and drinker type on ammonia emission from broiler houses. Journal of Agricultural Engineering Research 1996; (64):197-208.
Fairchild BD, Czarick M, Harper LA,Worley JW, Ritz CW, Hale BD, Naeher LP. Ammonia concentrations downstream of broiler operations. Journal of Applied Poultry Research 2009; (18):630-639.
Ferguson NS, Gates RS, Taraba JL, Cantor AH, Pescatore AJ, Ford MJ, Burnham DJ. The effect of dietary crude protein on growth, ammonia concentration and litter composition in broilers. Poultry Science 1998; (77):1481-1487.
Gates RS, Casey KD, Wheeler E, Xin H, Pescatore AJUS. broiler housing ammonia emissions inventory. Atmospheric Environment 2008; (42): 3342-3350.
Gates RS, Casey KD, Xin H, Burns RT. Building emissions uncertainty estimates. Transactions of ASABE 2009; 52(4):1345-1351.
Groot Koerkamp PWG, Metz JHM, Uenk GH, Phillips VR, Holder MR, Sneath RW, Short JL, White PP, Hartung J, Seedorf J, Schroder M, Linkert KH, Pederson S, Takai H, Johnsen JO, Wathes CM. Concentrations and emissions of ammonia in livestock buildings in northern Europe.Journal of Agricultural Engineering Research 1998; 70(10):79-95.
Harper LA, Flesch TK, Wilson JD. Ammonia emissions from broiler production in the San Joaquin Valley. Poultry Science 2010; (89):1802-814.
Hinz T, Linke SA. Comprehensive Experimental study of aerial pollutants in and emissions from Livestock buildings. Part 1: methods. Journal of Agricultural Engineering Research 1998; (70):111-118.
Lacey R, Redwine JS, Parnell Jr CB. Particulate matter and ammonia emission factors for tunnel-ventilated broiler production houses in the southern U.S. Transactions of ASAE2003; 46(4):1203-1214.
Liu Z,Wang L, Beasley DB. A review of emission models of ammonia released from broiler houses. ASABE 2006; 17p.
Nicholson FA, Chambers BJ, Walker AW. Ammonia emissions from broiler litter and laying hen manure management systems. Biosystems Engineering 2004; 89 (2):175-185.
National Research Council. Air emissions from animal feeding Operations: current knowledge, future needs. Washington; 2003.
Pescatore AJ, Casey KD, Gates RS. Ammonia emissions from broiler houses. Journal of Applied Poultry Research 2005; (14):635-637
Redwine JS, Lacey R, Mukhtar S, Carey JB. Concentration and emissions of ammonia and particulate matter in tunnel-ventilated broiler houses under summer conditions in Texas. U.S. Transactions of ASAE 2002; 45(4):1101-1109.
Seedorf J, Hartung J, Schröder M, Linkert KH, Pedersen S, Takai H, Johnsen JO, Metz JHM, Groot Koerkamp PWG, Uenk GH, Phillips VR, Holden M R, Sneath RW, Short JL, White RP, Wathes CM. A survey of ventilation rates in livestock buildings in Northern Europe. Journal of Agricultural Engineering Research 1998; (70):39-47.
Seedorf J. An emission inventory of livestock-related bioaerosols for Lower Saxony, Germany. Atmospheric Environment 2004; (38):6565-6581
Siefert RL, Scudlark JR, Potter AM, Simonsen KA, Savidge KB. Characterization of atmospheric ammonia emissions from a commercial chicken house on the Delmarva Peninsula. Environmental Science & Technology2004; 38(10):2769-2778.
Statistical Graphics Corporation (1994-2001) STATGRAPHICS plus for Windows, version 5.1. Rockville: Statistical Graphics; 2001.
Vergé XPC, Dyer JA, Desjardins RL, Worth D. Long-term trends in greenhouse gas emissions from the Canadian poultry industry. Journal of Applied Poultry Research 2009; (18):210-222.
Vranken GR, Aerts JM, Berckmans D. Performance of model-based predictive control of the ventilation rate with axial fans. Biosystems Engineering 2005; 91(1):87-98.
Wheeler E, Casey KD, Gates RS, Xin H, Zajaczkowski JL, Topper PA, Liang Y, Pescatore AJ. Ammonia emissions from twelve U.S.A. broiler chicken houses. Transactions of ASAE 2006; 49(5):1495-1512.