ABSTRACT: Ammonia (NH3) emissions from broiler production can affect human and animal health and may cause acidification and eutrophication of the surrounding environment. This study aimed to estimate ammonia emissions from broiler litter in two systems of forced ventilation, the tunnel ventilation (TV) and the dark house (DH). The experiment was carried out on eight commer-cial broiler houses, and the age of the birds (day, d), pH and litter temperature were recorded. Broilers were reared on built-up wood shaving litter using an average flock density of 14 bird m–². Temperature and relative humidity inside the broiler houses were recorded in the morning during the grow-out period. A factorial experimental design was adopted, with two types of houses, four replicates and two flocks with two replicates each. A deterministic model was used to predict ammonia emissions using the litter pH and temperature, and the day of grow-out. The highest litter temperature and pH were found at 42 d of growth in both housing systems. Mean ambient air temperature and relative humidity did not differ in either system. Mean model predicted am-monia emission was higher in the DH rearing system (5200 mg NH3 m
−2 h−1 at 42 d) than in the TV system (2700 mg NH3 m−2 h−1 at 42 d). TV presented the lowest mean litter temperature and pH at 42d of growth. In the last week of the broilers’ grow-out cycle, estimated ammonia emis-sions inside DH reached 5700 mg m−² h−1 in one of the flocks. Ammonia emissions were higher inside DH, and they did not differ between flocks. Assuming a broiler market weight in Brazil of close to 2 kg, ammonia emissions were equivalent to 12 g NH3 bird-marketed−1. Model-predicted ammonia emissions provided comprehensible estimations and might be used in abatement strat-egies for NH3 emission.
Keywords: noxious gases, environmental impact, dark house, poultry, tunnel ventilation
housings (Gates et al., 2008; Snoek et al., 2014). Full-scale in situ measurements are costly and time-consuming, and their accuracy might be compromised by variations in the final broiler market weight (Gates et al., 2008).
Field estimations of poultry NH3 emissions have already been calculated in some countries (Groot Koerkamp et al., 1998; Demmers et al., 1999; Guiziou and Béline, 2005; Pescatore et al., 2005; Wheeler et al., 2006; Gates et al., 2008; Harper et al., 2009; Calvet et al., 2011). Emissions per bird are suggested to be correlated with bird age and litter condition (Groot Koerkamp et al., 1998; Wheeler et al., 2006; Gates et al., 2008), but the results are highly variable (Wheeler et al., 2006; Casey et al., 2010). Mechanistic and deterministic algo-rithms have been used to estimate NH3 emissions from animal housing under particular circumstances (Bouw-man et al., 1997; Miragliotta et al., 2004; Gates et al., 2005; Siefert and Scudlark, 2008; Casey et al., 2010). The estimation of ammonia shows high variability influenc-ing the predictive emission models (Snoek et al., 2014), and found values have been adopted to define NH3 emis-sion inventories in different regions and countries (Groot Koerkamp et al., 1998; Demmers et al., 1999; Wheeler et al., 2006; Gates et al., 2008; Harper et al., 2009; Harper et al., 2010; Calvet et al., 2011).
This study aimed to estimate NH3 emissions in two broiler houses during the grow-out cycle using a predic-tive model.
Federal University of Grande Dourados/College of Agrarian Sciences, Rod. Dourados Itahum, km 12, C.P. 533 − 79804-970 − Dourados, MS − Brazil.
*Corresponding author <[email protected]>
Edited by: Carlos Eduardo Pellegrino Cerri
Model-predicted ammonia emission from two broiler houses with different rearing
Nilsa Duarte Silva Lima, Rodrigo Garófallo Garcia, Irenilza Alencar Nääs*, Fabiana Ribeiro Caldara, Roselaine Ponso
Received June 27, 2014 Accepted April 02, 2015
systems
Introduction
Agriculture contributes significantly to the anthro-pogenic emissions of ammonia and greenhouse gases (UNFCCC, 1997; Beusen et al., 2008). As the world's demand for food from livestock production increases, so do the effects of ammonia on rearing surroundings and the atmosphere (Bouwman et al., 1997). Ammonia (NH3) emission is the process of NH3 emission from litter to air, and it may cause eutrophication in the environment (UNFCCC, 1997). Ammonia emissions from poultry houses are a function of the NH3 concentration inside the housing, which is related to rearing flock density, quality of litter, birds’ diet and ventilation system (Gates et al., 2005; Ndegwa et al., 2008; Harper et al., 2010; Menegali et al., 2012).
Materials and Methods
Birds, housing and husbandry
The study was carried out in eight commercial broiler houses located at longitude 54°11’6” W and lati-tude 23°28’26” S from March to May, 2013. Birds from the Hubbard® genetic strain were reared in mixed flocks
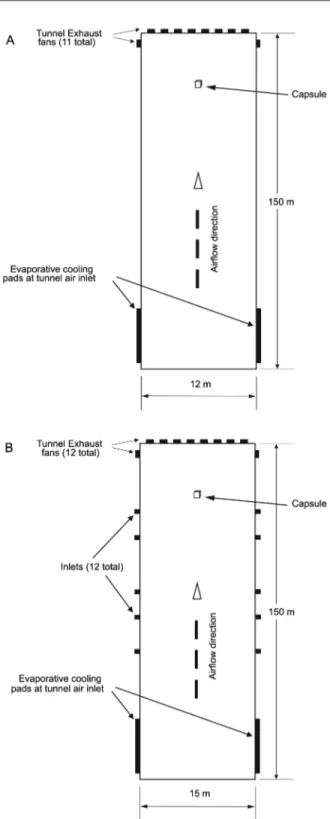
(male and female) for 42 d (market age). In the tunnel system (TV, Figure 1A), 25200 broilers were reared, and 31500 broilers were raised in the dark house sys-tem (DH, Figure 1B). The adopted average flock density was 14 bird m−2 in TV and DH. The bedding in both
houses was 10 cm of build-up wood shavings reused by the third time. The houses were east-west solar oriented. Four houses had the TV system and four the DH system. TV houses (12 m wide, 150 m long and 3.2 m high, and a floor area of 1800 m2) had forced ventilation,
exhaust fans (11 with air flow of 450 m3 s−1), a
high-pres-sure fogging system and the lateral areas were closed off with yellow polypropylene curtains. DH houses (15 m wide, 150 m long and 3.8 m high, and a floor area of 31500 m2) had forced ventilation; exhaust fans (12 with
air flow of 580 m3 s−1), a high-pressure fogging system,
and internal built walls painted with a black coating. In both houses the chick heating system used during day 1
to 14of the grow-out period consisted of a stove (burned wood) with the heat distributed through metallic tubes with sensors controlling the inlet air temperature. Light intensity inside the houses was set at 25 lx for the first weeks of grow-out (7-21 d), and at 5 lx for the remainder of the grow-out cycle (42 d) using automatic light control based sensors placed in the houses. The two systems had similar ventilation systems with the air inlet at one end, and the outlet at the opposite side. They differed in the reflectivity inside, as the inside walls in the DH houses were coated with black paint.
Ambient air temperature was controlled automati-cally using the association of the evaporative cooling sys-tem and negative pressure ventilation. The air flow was programmed to decrease air temperature from 32 °C on the first day to 27 °C after two weeks, and finally to 24 °C during the end of the grow-out phase.
Data recording
Air temperature (AT, ºC) and relative humidity (RH, %) were measured in the morning (10h00) in the houses using sensors equally distributed over 28 points during the grow-out cycle (Figure 2). Litter pH and tem-perature (LT, ºC) were recorded at the same time using a portable meter. Data recording in areas nearby or below drinkers and feeders were avoided. The age of birds was computed in days (d).
Ammonia emissions were assessed in the area near the air outlet of the houses using the capsule method suggested by Jeppsson (1999) at 21, 35 and 40 d of the grow-out cycle. The methodology allows for esti-mating the amount of ammonia emissions in a particu-lar area of the litter. The closed cubic capsule had an air inlet using a PVC tube (Φ 0.075 m) and inside it a small fan (12V, 60mA) was placed to promote homogeneity in the capsule’s inside air. The air outlet had a small exhaust fan (maximum flow of 90 m3 h−1) adjusted with
a dimmer. The samples of ammonia concentration were taken at a height of 1 m at a point in the PVC tube, after allowing the capsule to be under continuous flow for 20 min in the same place. Ammonia concentrations were measured using a gas pump. Ammonia emissions (ε
,
mg m−2 h−1) were estimated using Equation 1(Jepps-son, 1999).
ε= (Ccaps – C2) σ ϕ (1)
in which Ccaps = ammonia concentration inside the capsule (ppm),C2 = ammonia concentration at 2 m of height (ppm), σ = the corrected density of ammonia at the capsule outlet (0.765 kg m−2), and ϕ = air flow (m3
m−2 h−1).
Model-prediction of ammonia emission
Mean values of recorded variables were calcu-lated, and they were used as input to the software de-veloped using the deterministic algorithm described in Equation 2 (Miragliotta et al., 2004).
E = exp (-6.502 + 0.302 d + 0.122 LT + 0.614 pH – 0.004 d2) (2)
in which E = model-predicted ammonia emission (mg m−2 h−1), d = day of grow out, LT = mean litter
tempera-ture (°C), and pH = litter pH.
Statistical analysis
The experimental design was completely random-ized in a 2 × 4 factorial design (TV and DH; ages 7, 21, 35 and 42 d of growth) with four replicates per treat-ment, totaling 32 experimental units. The Kolmogorov-Smirnov test was used to verify the hypothesis of nor-mality for all variables, using a 95 % confidence limit. Analysis of variance was used to compare means using the Tukey and the F-test at a 95 % confidence level. For the model-predicted ammonia emission, a 2 × 2 factorial design was adopted, considering the type of the broiler house (TV and DH) and two replications for the number of flocks. All statistical analysis was carried out accord-ing to Wheater and Cook (2000) usaccord-ing ASSISTAT®
soft-ware (Assistat-Statistical Attendance Softsoft-ware, version 7.6).
Results and Discussion
The Kolmogorov-Smirnov test showed a normal distribution of the data. An effect of the type of house (factor, F1) or age of birds (F2) was found (p > 0.05) in the ambient air temperature and relative humidity only at 35 d (p = 0.1; Table 1). Environmental data inside the houses did not differ, indicating that the chosen vari-ables should not be the cause of possible variation in the estimation of NH3 emissions. Ambient air temperature is considered a primary factor in regulating the chemical processes involved in ammonia emissions (Wheeler et al., 2006; Sommer et al., 2006; Casey et al., 2010). Previ-ous studies showed that the distribution uniformity of environmental features may affect broiler weight gain (Miragliotta et al., 2006; Lima et al., 2011).
TV houses had lower mean values of LT and pH (30.0 ºC and 8.4, respectively) than DH houses (33.3 °C and 8.6, respectively), Table 2. The factor age of broil-ers presented the highest mean amount at the end of the grow-out cycle (42 d). The distribution uniformity of environmental features may affect broiler weight gain (Miragliotta et al., 2006; Lima et al., 2011). The mean pH values of the two houses (TV and DH) showed a slight difference from the 7 d (8.2) to 42d of growth. In the present study litter pH was 8.9 in the DH houses and 8.8 in the TV houses at 42 d of grow-out.
Figure 2 − Schematic plan view of the tunnel ventilated broiler houses TV (A) and DH (B) used in the study.
Table 1 − Analysis of variance using factors applied to litter temperature (LT), litter pH, ambient air temperature (AT) and relative humidity (RH).
Factor F (LT) F (pH) F (AT) F (RH)
House (F1) 42.82** 7.53* 0.29 ns 3.60 ns
Age of birds (F2) 12.44** 18.46** 140.24** 6.34*
Int. F1 × F2 1.35 ns 0.56 ns 2.30 ns 3.11*
Treatment 12.03** 9.23** 61.13** 4.56**
Standard deviation 2.73 0.31 2.99 8.27
Coefficient of variatio (%) 5 2 3 9
An important aspect of ammonia emission is the litter characteristics (Groot Koerkamp et al., 1998; Gates et al., 2008). Excreta accumulation on litter increases the litter pH and leads to a rise in NH3 concentrations inside broiler houses (Wheeler et al., 2006). The higher the lit-ter pH, the lower the conversion of NH3 (volatile) into NH4+ (nonvolatile). Consequently, high ammonia
volatil-ization in built-up litter without proper management is usual (Kristensen et al., 2000). The dark house present-ed higher litter temperature than the tunnel ventilation system and the ammonia emission in the DH should be greater than in the TV system (Table 2). Broiler housing presents a broad range of NH3 emission rates depending on the flock harvest day and the ambient temperature during the grow-out period (Guiziou and Béline, 2005; Wheeler et al., 2006).
NH3 emissions increased with bird age (Figure 3), which corroborates previous studies (Wheeler et al., 2006; Calvet et al., 2011; Lin et al., 2012). Ammonia emissions increased with broiler growth due to the consequent ex-creta build-up (Ngwabie et al., 2010, Calvet et al., 2011). There is a strong association between emissions, bird age, and litter condition (Gates et al., 2008; Casey et al., 2010). Broilers were reared on built-up litter, which is known to increase NH3 emissions. Gates et al. (2008) and Lima et al. (2011) assessed the ammonia emissions in tunnel
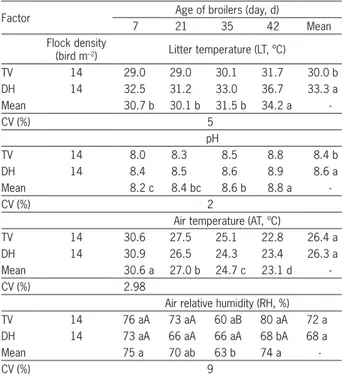
ventila-Table 2 − Mean values of litter temperature (LT) and pH, ambient air temperature (AT) and relative humidity (RH) inside the aviaries during the total grow out time.
Factor Age of broilers (day, d)
7 21 35 42 Mean
Flock density
(bird m–2) Litter temperature (LT, ºC)
TV 14 29.0 29.0 30.1 31.7 30.0 b DH 14 32.5 31.2 33.0 36.7 33.3 a
Mean 30.7 b 30.1 b 31.5 b 34.2 a
-CV (%) 5
pH
TV 14 8.0 8.3 8.5 8.8 8.4 b DH 14 8.4 8.5 8.6 8.9 8.6 a
Mean 8.2 c 8.4 bc 8.6 b 8.8 a
-CV (%) 2
Air temperature (AT, ºC)
TV 14 30.6 27.5 25.1 22.8 26.4 a DH 14 30.9 26.5 24.3 23.4 26.3 a
Mean 30.6 a 27.0 b 24.7 c 23.1 d
-CV (%) 2.98
Air relative humidity (RH, %) TV 14 76 aA 73 aA 60 aB 80 aA 72 a DH 14 73 aA 66 aA 66 aA 68 bA 68 a
Mean 75 a 70 ab 63 b 74 a
-CV (%) 9
Tukey test was applied. Mean values followed by the same letter did not differ (p > 0.05). For RH, mean values followed by the same letter in the column (lower case) do not differ. Different letters in the same row (upper case) are different (p ≤ 0.05). CV = Coefficient of variation; TV=tunnel ventilation; DH= dark house.
Table 3 − Analysis of variance for model-predicting ammonia emissions in two different broiler houses (mg m−2 h−1) during two
flocks and at four grow out days.
Factor F (7 d) F (21 d) F (35 d) F (42 d)
Type of aviary (F1) 7.69 ns 12.79* 33.67** 30.03** Number of flocks (F2) 0.13 ns 0.00 ns 19.06* 4.93 ns
Int. F1 × F2 1.29 ns 0.28 ns 9.98* 0.03 ns
Treatment 3.04 ns 4.36 ns 20.90** 11.66*
Standard deviation 26 193 877 1408
Coefficient of variation (%) 36 22 31 36
**significant at 1 % of confidence (p ≤ 0.01) F – value; *significant at 5 % of confidence (0.01 ≤ p < 0.05) F – value; ns = non-significant (p > 0.05). tion houses and found lower rates of NH3 emission in new bedding than in those with built-up litter. However, the renewal of bedding in each flock is not used by farmers as it may lead to an increase in production costs.
Mean values of ambient AT did not differ (p > 0.05) and varied according to broiler requirements in each grow-out period (Table 2). The values were 26.4 ºC in TV and 26.3 ºC in DH. Mean values of RH did not differ between houses; however, an interaction between the “house” and “age of broilers” factors was identified at 35 and 42 d of growth. The change in pH depends on the age of the birds, and it may be attributed to the effect of litter temperature, ambient temperature and density of birds (Pescatore et al., 2005; Menegali et al., 2012). The pH of litter also influences the release of ammonia, which is maximized at levels of pH above 7.0. The differ-ence between the temperature and litter pH at different ages provided a growing impact on the degradation reac-tion of nitrogen compounds in poultry litter and tended to be alkaline. The increase in temperature and pH of the litter provided greater microbial activity and the for-mation of noxious gases (Calvet et al., 2011). Thus, the quantity and quality of litter affect the ability of NH3 emissions from broiler housing (Toghyani et al., 2010).
The provision of minimum ventilation in the most uniform way is essential to ensuring good air quality control inside broiler housing. The small air exchange, high humidity, temperature and pH, and type of litter management may induce greenhouse gas emissions (Menegali et al., 2012).
Model-predicted ammonia emissions
Mean ammonia emission amounts measured in-side the TV using the capsule were similar for both hous-es studied at the first stage of the grow-out cycle (Figure 4). However, results varied during the broiler grow-out phase, 725 mg NH3 m−2 h−1 at 21 d, 2200 mg NH
3 m −2
h−1 at 35d, and 2700 mg NH 3 m
−2 h−1 at 42 d of grow-out.
model-predicted value of ammonia emission in DH in the second flock was 5200 mg m−2 h−1, and also on TV
with lower emission (2200 mg m−2 h−1; Table 4).
Siefert and Scudlark (2008) studied ammonia emis-sions from tunnel system houses and found values of 2700 mg NH3 bird−1, equivalent to 2.7 g NH
3 bird −1.
Re-sults obtained in the present experiment, at 35 d were lower than that with an average emission (in TV and DH) of ~ 4000 mg NH3 m−2 h−1 (12 g NH
3 bird
−1). Gates
et al. (2008) found values of ammonia emission near 20 g NH3 bird−1, practically double the results found in the
present study. Harper et al. (2010) evaluated the weekly average emission during the growth cycle of the birds, which resulted in a total of 4 kg NH3 per tunnel venti-lation house during the summer. The result is similar to that found in the present study, on average 5 kg of NH3 per flock in tunnel ventilation. Redwine et al. (2002) found that NH3 emission rates in broiler production var-ied from 38 to 2105 mg NH3 h–1. Despite the high
varia-tions between the results cited, the lowest value in the current literature is similar to that obtained in the pres-ent study, when considering the house with a total area of 1800 m2. Assuming a market bird weight of 2 kg the
highest ammonia emission value found was 12 g NH3 bird-marketed−1.
The highest model-predicted ammonia emission occurred on the 21st d of growth in DH (1000 mg NH
3
m−2 h−1). On the 35th d, there was an interaction
be-tween the “house” and “number of flocks” factors, and the largest model-predicted value of ammonia emission was for DH (4200 mg m−2 h−1) during flock 2,
differ-ent from flock 1 (2600 mg m−2 h−1). On the last day of
growth (market age, 42 d) considering the type of house, the highest model-predicted mean value of ammonia emission in DH (5700 mg m−2 h−1) was found.
Model-predicted NH3 emissions increased along the grow-out cycle, arising from an increase in excreta deposition on litter (Figure 3). The ammonia emission found using the model-predicted ammonia, and those measured inside
Figure 3 − Model-predicted ammonia emissions from two broiler houses (Tunnel ventilation, TV and dark house, DH) at four grow-out phases, 7 days (A), 21 days (B), 35 days (C) and 42 days (D).
the houses were similar on the grow-out days 21, 35 and 42 in TV. Nevertheless, the values differed from those found in the DH on days 35 and 42 (Figure 4).
The emission rate of ammonia tends to be rela-tively stable in the first weeks of growth, rising by the third week of life. This increase coincides with the growth period of the birds, and the feed intake is higher than in other phases of the cycle. These emission factors such as concentration of excreta in litter temperature, pH and rate of ventilation may be associated (Harper et al., 2010).
Groot Koerkamp et al. (1998) found values of am-monia emissions in European countries near 11000 mg m−2 h−1. The highest value found in the present study
was ~6000 mg m−2 h−1 in the DH house (Table 4), which
is nearly half of the values found previously. Studying NH3 emissions from new and built-up litter Gates et al.
(2008) found that broilers raised on built-up litter emit ~25 g NH3 bird-marketed−1. Our highest findings of NH
3
emissions (with market weight in Brazil near 2 kg) in built-up litter was equivalent to 12 g NH3 bird-market-ed−1, which is lower than the results for broilers reared
in new bedding. Wheeler et al. (2006) found a mean value of 17 g NH3 bird-marketed−1, which was similar
to the results found in the present study. Values found here were similar to those found by Calvet et al. (2011) in southern Europe (24 g NH3 bird-marketed−1).
According to Liu et al. (2011) ventilation rate changes inside the housing may be the cause of differ-ent results in ammonia emission estimation. Liu et al. (2011) showed that when air velocity increased to a pre-determined level (≥ 1.6 m s–1), emission flux increases.
The loss of nitrogen and water from the litter is no lon-ger negligible, which results in reduced measurements of emission fluxes. The differences in air flow inside the houses might be the reason for significant differ-ences in the ammonia emission results found in current literature (Groot Koerkamp et al., 1998; Wheeler et al., 2006; Gates et al., 2008; Harper et al., 2009; Calvet et al., 2011).
Predicted levels of NH3 emissions from the model had a sharp increase after the 35th day of grow-out in the
DH, when compared to the predictive value of TV, and the measured quantity using the capsule (TVM, Figure 2). The NH3 emissions were similar to those estimated in the TV houses but differed substantially from those in the DH house after the 35th d of the grow-out cycle.
Whereas the methods applied to this study can be used for estimating ammonia emission trends, the information presented should not be used for making regulatory determinations. However, the model pro-vided comprehensible estimation and might be used as NH3 emission abatement strategies. The estimated am-monia emission was higher in the dark house than in the tunnel ventilation system. The amount of ammonia increased gradually throughout the grow-out cycle in both types of houses, and the highest mean value was attributed to the dark house system. The results from the predictive model showed a similar level of ammo-nia emissions in the tunnel ventilated house, but the level differed from the dark house starting during the broiler grow-out stage.
Acknowledgment
The authors wish to thank the Coordination for the Improvement of Higher Level Personnel (CAPES) for supporting this research.
References
Beusen, A.H.W.; Bouwman, A.F.; Heuberger, P.S.C.; Drecht, G. van; Hoek, K.W. van der. 2008. Bottom-up uncertainty estimates of global ammonia emissions from global agricultural production systems. Atmospheric Environment 42: 6067-6077.
Table 4−Mean model-predicting ammonia emission (mg NH3 m−2
h−1) in two broiler houses and during two flocks and at four phases
of the growth cycle (7, 21, 35 and 42 days).
Factor
Number of flocks
1 2 Mean Standard
deviation
Coefficient of variation (%) 7 d
TV 40 60 50 a 17 34
DH 100 90 95 a 20 17
Mean 70 a 70 a - 36 25
Standard
deviation 31 18 - -
-Coefficient of
variation (%) 46 25 - -
-21 d
TV 700 750 725 b 112 15
DH 1100 1000 1050 a 78 7
Mean 900 a 900 a - 192 21
Standard
deviation 212 173 - -
-Coefficient of
variation (%) 23 19 - -
-35 d
TV 2050 aA 2300 bA 2200 b 287 13
DH 2600 aB 4200 aA 3400 a 829 24
Mean 2330 b 3250 a - 877 31
Standard
deviation 317 1005 - -
-Coefficient of
variation (%) 13 30 - -
-42 d
TV 2200 3100 2700 b 686 25
DH 4600 5700 5200 a 670 13
Mean 3400 a 4400 a - 1408 36
Standard
deviation 1255 1387 - -
-Coefficient of
variation (%) 36 31 - -
Bouwman, A.F.; Lee, D.S.; Asman, W.A.H.; Dentener, F.J.; Hoek, K.W. van der; Oliver, G.J. 1997. A global high-resolution emission inventory for ammonia. Global Biogeochemical Cycles 11: 561-587.
Calvet, S.; Cambra-López, M.; Estellés, F.; Torres, A.G. 2011. Characterization of gas emissions from a Mediterranean broiler farm. Poultry Science 90: 534-542.
Casey, K.D.; Gates, R.S.; Shores, R.C.; Thomas, D.; Harris, D.B. 2010. Ammonia emissions from a U.S. broiler house-comparison of concurrent measurements using three different technologies. Journal of the Air & Waste Management Association 60: 939-48.
Demmers, T.G.M.; Burgess, L.R.; Short, J.L.; Phillips, V.R.; Clark, J.A.; Wathes, C.M. 1999. Ammonia emissions from two mechanically ventilated UK livestock buildings. Atmospheric Environment 33: 217-227.
Gates, R.S.; Casey, K.D.; Wheeler, E.F.; Xin, H.; Pescatore, A.J. 2008. US broiler housing ammonia emissions inventory. Atmospheric Environment 42: 3342-3350.
Gates, R.S.; Xin, H.; Casey, K.D.; Liang, Y.; Wheeler, E.F. 2005. Method for measuring ammonia emissions from poultry houses. Journal of Applied Poultry Research 14: 622-634. Groot Koerkamp, P.W.G.; Metz, J.H.M.; Uenk, G.H.; Phillips,
V.R.; Holden, M.R.; Sneath, R.W.; Short, J.L.; White, R.P.P.; Hartung, J.; Seedorf, J.; Schröder, M.; Linkert, K.H.; Pedersen, S.; Takai, H.; Johnsen, J.O.; Wathes, C.M. 1998. Concentrations and emissions of ammonia in livestock buildings in Northern Europe Journal of Agricultural Engineering Research 70: 79-95. Guiziou, F.; Béline, F. 2005. In situ measurement of ammonia
and greenhouse gas emissions from broiler houses in France. Bioresource Technology 96: 203-207.
Harper, L.A.; Flesch, T.K.; Wilson, J.D. 2010. Ammonia emissions from broiler production in the San Joaquin Valley. Poultry Science 89: 1802-814.
Harper, L.A.; Flesch, T.K.; Powell, J.M.; Coblentz, W.K.; Jokela, W.E.; Martin, N.P. 2009. Ammonia emissions from dairy production in Wisconsin. Journal of Dairy Science 92: 2326-2337.
Jeppsson, K.H. 1999. Volatilization of ammonia in deep litter systems with different bedding materials for young cattle. Journal of Agricultural Engineering Research 7: 49-57.
Kristensen, H.H.; Burgess, L.R.; Demmers, T.G.M.; Wathes, C.M. 2000. The preferences of laying hens for different concentrations of atmospheric ammonia. Applied Animal Behaviour Science 68: 307–318.
Lima, K.A.O.; Moura, D.J.; Carvalho, T.M.R.; Bueno, L.G.F.; Vercellino, R.A. 2011. Ammonia emissions in tunnel-ventilated broiler houses. Brazilian Journal of Poultry Science 13: 265-270. Lin, X.J.; Cortus, E.L.; Zhang, R.; Jiang, S.; Heber, A.J. 2012. Air
emissions from broiler houses in California. Transactions of the ASABE 55: 1895-1908.
Liu, Z.; Wang-Li, L.; Beasley, D.B.; Shah, S.B. 2011. Validation and uncertainty analysis of an ammonia emission model for broiler litter. Transactions of the ASABE 54: 1051-1057.
Menegali, I.; Tinôco, I.F.F.; Zolnier, S.; Carvalho, C.C.S.; Guimarães, M.C.C. 2012. Influence of different systems of minimum ventilation on air quality in broiler houses. Engenharia Agrícola 32: 1024-1033.
Miragliotta, M.Y.; Nääs, I.A.; Manzione, R. L.; Nascimento, F.F. 2006. Spatial analysis of stress conditions inside broiler house under tunnel ventilation. Scientia Agricola 63: 426-432. Miragliotta, M.Y.; Nääs, I.A.; Murayama, M.C.; Moura, D.J. 2004.
Software for estimating ammonia emission in broilers housing. Revista Brasileira de Agroinformática 6: 79-89 (in Portuguese, with abstract in English).
Ndegwa, P.M.; Hristov, A.N.; Arogo, J.; Sheffield, R.E. 2008. A review of ammonia emission mitigation techniques for concentrated animal feeding operations. Biosystems Engineering 100: 453-469.
Ngwabie, N.M.; Jeppsson, K.H.; Gustafsson, G.; Nimmermark, S. 2010. Influence of environmental factors and the addition of wood shavings on ammonia and odour emissions from fresh livestock manure. Agricultural Engineering International: CIGR Journal 12: 68-80.
Pescatore, A.J.; Casey, K.D.; Gates, R.S. 2005. Ammonia emissions from broiler houses. Journal of Applied Poultry Research 14: 635-637.
Redwine, J.S.; Lacey, R.E.; Mukhtar, S.; Carey, J.B. 2002. Concentration and emissions of ammonia and particulate matter in tunnel-ventilated broiler houses under summer conditions in Texas. Transactions of the ASAE 45: 1101-1109. Siefert, R.L.; Scudlark, J.R. 2008. Determination of ammonia
emission rates from a tunnel ventilated chicken house using passive samplers and a Gaussian dispersion model. Journal of Atmospheric Chemistry 59: 99-115.
Snoek, D.J.W.; Stigter, J.D.; Oginkc, N.W.M.; Groot Koerkamp, P.W.G. 2014. Sensitivity analysis of mechanistic models for estimating ammonia emission from dairy cow urine puddles. Biosystems Engineering 121: 12-24.
Sommer, S.G.; Zhang, G.Q.; Bannink, A.; Chadwick, D.; Misselbrook, T.; Harison, R.; Hutchings, N.J.; Menzi, H.; Monteny, G.J.; Ni, J.Q.; Oenema, O.; Webb, J. 2006. Algorithms determining ammonia emission from buildings housing cattle and pigs and from manure stores. Advances in Agronomy 89: 261-335.
Toghyani, M.; Gheisari, A.; Modaresi, M.; Tabeidian, S.A.; Toghyani, M. 2010. Effect of different litter material on performance and behavior of broiler chickens. Applied Animal Behaviour Science 122: 48-52.
UNFCCC. 1997. Kyoto Protocol to the United Nations Framework. Convention on Climate Change. Available at: http://unfccc. int/2860.php [Accessed Mar 30, 2014].
Wheater, C.P.; Cook, P.A. 2000. Using Statistics to Understand the Environment. Routledge, New York, NY, USA.