Printed version ISSN 0001-3765 / Online version ISSN 1678-2690 http://dx.doi.org/10.1590/0001-3765201820170432
www.scielo.br/aabc | www.fb.com/aabcjournal
Corn grain yield and
15N-fertilizer recovery as a function of urea sidedress timing
EVANDRO L. SCHONINGER1
, HUGO A. GONZÁLEZ VILLALBA2
,JOSÉ ALBERTINO BENDASSOLLI3
and PAULO CESAR O. TRIVELIN3
1
Universidade do Estado de Mato Grosso/UNEMAT, Câmpus Universitário de Nova Mutum, Departamento de Agronomia, Avenida das Arapongas, 1384-N, 78450-000 Nova Mutum, MT, Brazil
2
Escola Superior de Agricultura “Luiz de Queiroz”/ESALQ, Universidade do Estado de São Paulo/ USP, Departamento de Ciência do Solo, Avenida Pádua Dias, 11, 13418-900 Piracicaba, SP, Brazil 3
Centro de Energia Nuclear na Agricultura/CENA, Universidade de São Paulo/USP, Laboratório de Isótopos Estáveis, Avenida Centenário, 303, 13416-903 Piracicaba, SP, Brazil
Manuscript received on June 5, 2017; accepted for publication on January 3, 2018
ABSTRACT
Best fertilizer management practices such as adopting the right N sidedress timing can reduce N losses by volatilization, thus, raising N-fertilizer recovery and grain yield. To evaluate ammonia (N-NH3) losses,
N-fertilizer recovery and grain yield as a function of urea sidedress timing in corn, a field study was
conducted during the 2011-2012 and 2012-2013 growing seasons, adopting a complete randomized block design with four replications. Treatments consisted of urea sidedress timing (140 kg N ha-1) at V4, V6, V8, V10, and V12 growth stages, plus a control without sidedress N. The largest N losses by N-NH3 volatilization occurred when urea was applied at V10 or V12 growth stages, reaching losses of 35 and
41 % of the total applied N. Although climatic factors influences N-NH3 volatilization process, crop
characteristics such as canopy development also seems to affect N-NH3 losses. Nitrogen application at V4 or V6 growth stages resulted in greater N-fertilizer recovery from urea sidedress, reaching values of 53 %.
No increase in corn grain yield was observed with N application at different corn growth stages during the
two growing seasons evaluated, most likely due to high N mineralization rates from the soil.
Key words: 15
N isotope, Nitrogen fertilization, Nitrogen volatilization, Zea mays.
Correspondence to: Evandro Luiz Schoninger E-mail: [email protected]
INTRODUCTION
Among N sources in Brazil, urea is the most commonly used, mainly because it has the lowest cost per unit of N compared to other solid N fertilizers currently available in the market. When applied to soil, urea undergoes hydrolysis by the action of an enzime called urease, converting R-NH2 to NH4+. By consuming H+, this reaction increases
soil pH near the fertilizer granules, favoring deprotonation of NH4+ to NH
3, a gas possible of
volatilization losses that can reach values up to 78% of total N applied (Lara Cabezas et al. 2000). However, when urea is incorporated into soil, NH3 losses by volatilization decrease significantly (Lara Cabezas et al. 2000, Trivelin et al. 2002, Sangoi et al. 2003).
et al. 2000, Gava et al. 2006, Duete et al. 2008), reaching very low values of 9% in some cases (Lü et al. 2012). Nitrogen from fertilizer not recovered by the crop, in addition to being lost by volatilization, leaching and/or denitrification, can remain in the soil in organic or inorganic forms, without being absorbed by plants.
Among several strategies to reduce N losses, N supply at the optimal time and enhanced N-fertilizer recovery, N split application is very important (Randall and Vetsch 2005, Duete et al. 2008, Lü et al. 2012, Abbasi et al. 2013). In general, corn N fertilization is performed in two applications, with part of the rate applied at planting (30 to 40 kg ha-1 N) and the remaining during the V4-V6 growth stages (Cantarella and Duarte 2004). A higher recovery of N results from the synchrony between the N supply and the high nutrient requirement period (Amado et al. 2002). Although fertilizer N application is recommended between the V4 and V8 corn growth stages in tropical and subtropical regions, studies evaluating application time have found contrasting results. For example, Silva et al. (2006) verified no differences in fertilizer recovery by corn plants when N was applied during the V4 or V8 stages with an average recovery value of 50%. On the other hand, Lü et al. (2012), evaluating the amount and time of N application, observed higher fertilizer recovery when N was split applied at several times, including after flowering application.
Responses in grain yield and fertilizer recovery to late N application are observed because modern high-yielding hybrids take up a considerable amount of N after flowering (Huber et al. 1994 Ciampitti and Vyn 2013). Therefore, as N supply to grains via remobilization from leaves and the stem is limited, uptake of high amounts of N is required during the reproductive stages (Ciampitti and Vyn 2013).
Although it is hard to perform mechanized application of solid fertilizers to corn plants when they are well developed, it is becoming a common
practice in Brazil to broadcast N over the corn canopy because it is easier, faster and cheaper than incorporating fertilizers into the soil (Vargas et al. 2015). One of the strategies to maintain a greater amount of available N for a crop after flowering may be N application during more advanced growth stages than recommended (V4 – V8), but allowing for mechanized fertilization without damaging plants. In this context, the objective of this study was to evaluate ammonia volatilization, corn grain yield and N fertilizer recovery as a function of urea sidedress application time.
MATERIALS AND METHODS
Ammonia volatilization was measured using a semi-open static collector, adopting the model described by Nömmik (1973) and calibrated by Lara Cabezas et al. (1999), changing the collector base position between sampling dates, as proposed by Cantarella et al. (2003). Collectors were placed on the plots immediately after N fertilizer application. Four plants from the microplots (two plants from the center of each corn row adjacent to the
15N-urea application line) were sampled and
separated into leaves (leaves + tassel + husk leaves), stem, cob and grain, and then oven dried, weighed and finely milled for determination of total nitrogen (TN) and 15N abundance using a mass spectrometer
(Barrie and Prosser 1996). Accumulated N (AN) in the different parts of the plants was calculated using equation 1:
(
1)
(
) ( )
1000
DM NC
AN kg ha− = × (Eq. 1)
where AN is the accumulated N in the different parts of the plant (kg ha-1); DM is dry mass
accumulated in the different fractions of the plants (kg ha-1); and NC is N concentration in the different parts of the plants (g kg-1).
Summing the AN of each part of the plant (grains, cob, stalk and leaves), total accumulated Before corn planting, in Oct. 2011 and Nov.
2012, lime was applied to the soil aiming to increase the base saturation to 70%, with incorporation by disking harrow operation. On 12/8/2011 and 12/19/2012, corn was planted manually, placing seeds in pairs every 0.33 m in the planting furrow, with a manual thinning operation during V4 (leaving one plant every 0.33 m), aiming to obtain a uniform plant stand and a final population of 60,000 plants ha-1. For both growing seasons, the basal fertilization was 750 kg ha-1 of a formulated
04-14-08 applied on every plot, resulting in 30, 105 and 60 kg ha-1 of N, P2O5 and K2O, respectively. For sidedress N, 140 kg N ha-1 were applied as urea. During V4, 60 kg of K2O ha-1 were sidedressed as potassium chloride. Both the N and K2O rates were defined in order to obtain a high grain yield (10– 12 Mg ha-1), as recommended by Cantarella et al. (1997). Urea sidedress application was performed in a single-side surface banding (0.25 m from the crop row). Application times for every treatment were represented as the V4, V6, V8, V10 and V12 growth stages, as described by Ritchie et al. (1993). Corn hybrid 30F35HR from Pioneer® was used,
and cultural practices were performed according to the crop needs.
TABLE I
Chemical characterization and clay content of the experimental area. Piracicaba (SP), Brazil.
Layer pH†
P‡
K‡
Ca‡
Mg‡
H+Al§
Al¶
CEC#
BS††
OM‡‡
Clay
m mg dm-3 --- mmolc dm-3 --- % ---- g kg-1
----Growing season 2011-2012
0.00–0.20 4.9 27 1.9 30 13 42 1 87 52 29 529
0.20–0.40 4.5 32 0.6 19 8 58 5 86 32 22 548
Growing season 2012-2013
0.00–0.20 4.8 29 1.3 16 9 47 2 73 36 30
-0.20–0.40 4.6 21 0.6 10 7 52 3 70 25 24
-† pH in 0.01 mol L-1
CaCl2, with ratio of 1:2.5 for soil and solution; ‡ extracted with ion exchange resin;
§ determined by the SMP at 7.0 pH buffer method; ¶ extracted with KCl 1 mol L-1
, with ratio of 1:10 for soil and solution; # potential cation exchange capacity;
†† base saturation;
nitrogen in the aboveground part of the plant (TAN) was obtained.
Fertilizer recovery efficiency (FRE) was measured at the end of the crop cycle (physiological maturity) and calculated using equation 2:
( )
15
15
% 1 00 2
Np AN Nf FRE
NF
×
= × ×
(Eq. 2)
where FRE is fertilizer recovery efficiency (%); 15Np is the abundance of 15N in excess in the different parts of the plants (%); 15Nf is the abundance of 15N in excess in the fertilizer applied
(%); AN is the accumulated N in the different parts of the plants (kg ha-1); and NF is the amount of N applied via fertilizer (kg ha-1).
Considering that plants uptake a similar amount of nutrients from fertilizer applied on each side of a corn row (Jhonson and Kurtz 1974) and that labeled fertilizer was applied on the center of the inter-rows (equivalent to one of the sides of each row where plants were sampled), we assumed that 50% of the N derived from fertilizer in the plant is taken up from the labelled fertilizer and 50% from the conventional fertilizer, making it necessary to use the multiplication factor 2 in equation 2.
Nitrogen derived from fertilizer (NDFF) was calculated using equation 3:
( ) (
)
% FRE NF
NDFF
AN ×
= (Eq. 3)
where NDFF is N derived from fertilizer (%); FRE is fertilizer recovery efficiency in the different parts of the plants (%); NF is the amount of N applied via fertilizer (kg ha-1); and AN is the accumulated N in the different parts of the plants (kg ha-1).
At the end of the crop cycle, grain yield was measured by harvesting all ears from the two central rows (neglecting 1 m at the beginning and at the end of the plot). Ears were then threshed, and
grains were weighed with a humidity correction to 130 g kg-1.
Using the dry mass of the aboveground part of the plant, grain dry mass, N accumulated in the aboveground part of the plant and N accumulated in grain, the grain and nitrogen harvest indexes were calculated, according to equations 4 and 5, respectively:
( )
% GDM 1 00
GHI
TDM
= × (Eq. 4)
where GHI is grain harvest index (%); GDM is grain dry mass (kg ha-1); and TDM is total dry mass of the aboveground part of the plant (leaves, stalk, cob and grain) (kg ha-1).
( )
% GNA 100
NHI
TAN
= × (Eq. 5)
where NHI is nitrogen harvest index (%); GNA is grain nitrogen accumulation (kg ha-1); and TAN is total nitrogen accumulation in the aboveground part of the plant (kg ha-1).
Results of each growing season were submitted separately to analysis of variance (p≤0.05), and
when the F test resulted in significance, means of the treatments (time of nitrogen application) were compared by Tukey’s test (p≤0.05). For statistical
analysis, SAS version 9.2 was used (SAS Institute 2009).
RESULTS AND DISCUSSION
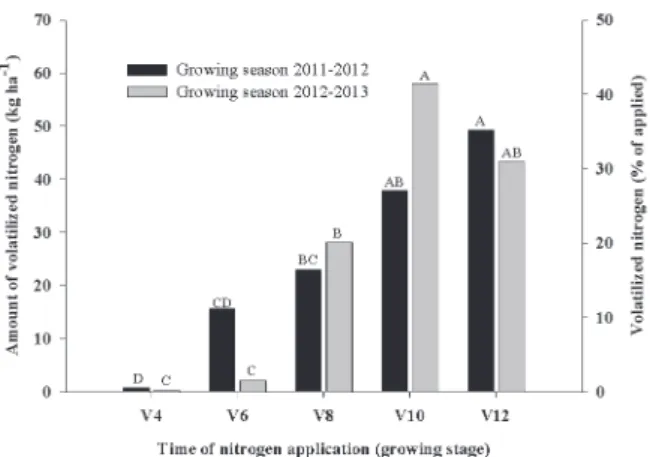
Climatic conditions were not a limiting factor for the normal development of corn plants during the experiments (Figure 1).
V6 during the first season, approximately 11% of the applied N was lost, while during 2012–2013, ammonia losses did not surpass 1.5%. For N application during V4, volatilization losses were negligible, with less than 0.5% of the total N applied.
In locations under the same soil cover management and nutrients application methods, ammonia volatilization variation occurs mainly due to the different climate conditions during the days after fertilizer application (Da Ros et al. 2005, Fenilli et al. 2007). Even when rainfall occurred few days after urea application for almost every treatment and for both growing seasons (Figure 1), except during V12 in 2011–2012, ammonia volatilization was higher as later the N application was performed (Figure 2). Therefore, if the amount of rainfall after N fertilizer application is not enough to incorporate the fertilizer (or its hydrolysis products) into the soil, to a depth that minimizes ammonia volatilization, that rainfall may contribute even more to N loss by volatilization. This occurs because rainfall increases soil water evaporation (SWE) potential (if all other climate conditions are maintained), which according to Wahhab et al.
(1957) and Al-Kanani et al. (1991), is essential for ammonia diffusion to the atmosphere.
Considerable amount of rain (> 20 mm) immediately after urea application on the soil surface was one of the factors that likely reduced ammonia losses by volatilization, explaining the minimal losses observed during V4 in the first growing season and during V6 in the second. In 2012–2013, ammonia losses during V4 were also minimal, even with rainfall (15 mm) occurring only the second day after the N-fertilizer application, followed by three days with no rainfall, which could have increased ammonia losses. However, as urea was applied on the dry soil surface, probably the N-fertilizer hydrolysis was limited, remaining as urea, and after the 15-mm rainfall, it was incorporated deep enough to reduce ammonia losses. Black et al. (1987) related that 73% of the total N applied on a dry soil remained as non-hydrolyzed form 30 days after the application.
As a non-ionic molecule, urea is more mobile in the soil compared to NH4+ (Black et al. 1987,
soil. Evaluating urease enzyme inhibitor (UEI) effectiveness, Dawar et al. (2011) observed that urea without UEI applied on the soil surface hydrolyzed rapidly (in adequate humidity and temperature conditions), forming a great amount of NH4+ in the upper soil layers, which may promote ammonia volatilization. On the other hand, when using UEI, the authors observed delayed urea hydrolysis, that occurred mostly in the subsurface, due to the higher movement of N in the form of urea trough the soil profile. Thus, the higher mobility of urea alongside with the possibility of its hydrolysis in deeper soil layers, could explain the low ammonia lost when N was applied during V4 during the second growing season, even with the occurrence of a single 15-mm rainfall in the five subsequent days after the fertilizer application.
Although during other growth stages (i.e., V8 in the first season and V12 in the second) rainfall events of 9 mm occurred on the first day after fertilizer application, significant N volatilization was observed. In these situations, the amount of rainfall was likely not sufficient to avoid volatilization, probably because of fertilizer application on wet soil, which may have promoted
urea hydrolysis with subsequent NH4+ formation, which, as previously mentioned, is less mobile in soil.
It is also important to consider the possibility of interference of water interception by leaves and the preferential rainwater flow in older plants on ammonia volatilization. Some studies have demonstrated that part of the rainfall intercepted by the plant canopy can be retained in the leaves or reach the ground via water stemflow or as splash water (Parkin and Codling 1990, Alves et al. 2001). According to Alves et al. (2001), rainfall interception rates by leaves and afterwards water stemflow are increased as crop leaf area increases. In a study performed by Parkin and Codling (1990), for rainfalls of 3 to 7.5 mm, water stemflow of corn plants varied from 19 to 48% of the total rainfall. Therefore, the rainfalls probably occurred during later corn growth stages were less effective in incorporating the N fertilizer into the soil after the application on the inter-rows.
As ammonia volatilization depends on SWE, it is important to understand the process, which can be separated into three phases (Idso et al. 1974). During phase 1, the SWE rate is limited by the quantity of energy available to vaporize water from the upper soil layer (Lemon 1956, Idso et al. 1974, Ventura et al. 2006), and begins immediately after the end of the rainfall or irrigation. The extent of this phase is variable and usually longer when soil cover is present (Lemon 1956, Dalmago et al. 2010). During phase 2, a reduction in soil moisture in the most superficial layers and soil hydraulic characteristics are the factors determining the liquid and vapor transference to the surface (Lemon 1956, Idso et al. 1974, Ventura et al. 2006). During this phase, evaporation occurs below the soil surface and the water vapor reaches the soil surface by molecular diffusion and by mass flow (Jensen et al. 1990). Phase 3 is mainly determined by the physical and adsorptive characteristics of the soil, Figure 2 - Amount and percentage of volatilized nitrogen
from urea sidedressed during different corn growing stages. For each growing season, columns with different letters differ between each other by Tukey’s test (p≤0.05). Coefficients of
with the SWE rate of little importance (Ventura et al. 2006).
Based on this distinction of SWE phases, it is possible that higher crop leaf area during more advanced growth stages may have contributed to the differences in losses by volatilization. On a first analysis, higher soil cover preventing direct sunlight incidence may have reduced the amount of incident energy and consequently the SWE during phase 1 (Dalmago et al. 2010), reducing ammonia losses. However, higher soil cover also increases the duration of the SWE phase 1 (Dalmago et al. 2010), maintaining higher soil moisture in the surface and favoring the occurrence of various reactions that contribute to volatilization losses (e.g., hydrolysis and conversion of NH4+ to NH3). On the other hand, when soil cover is inexistent or negligible (e.g., during the V4 and V6 growing stages), the extent of phase 1 will decrease, and the beginning of phase 2 is earlier than that of the other corn grow stages (e.g., V8, V10, V12). During this second SWE phase, as liquid water turns to vapor some centimeters below the soil surface (Jensen et al. 1990), it interferes little with the chemical reactions involved in the process of ammonia volatilization (hydrolysis, conversion of NH4+ to NH3, and NH3 movement in solution by evaporation).
If there is sufficient soil humidity for urea hydrolysis and SWE, the ammonia volatilization process generally presents a maximum rate from two to four days after urea application (Black et al. 1987, Da Ros et al. 2005, Fenilli et al. 2007). Therefore, late rainfall event occurrence, even of considerable amounts, will not be sufficient to incorporate urea into the soil and reduce N loss, because ammonia losses have already occurred, according to the observed N application during the V6, V8 and V10 stages during the 2011–2012 growing season and V10 during the 2012–2013 growing season.
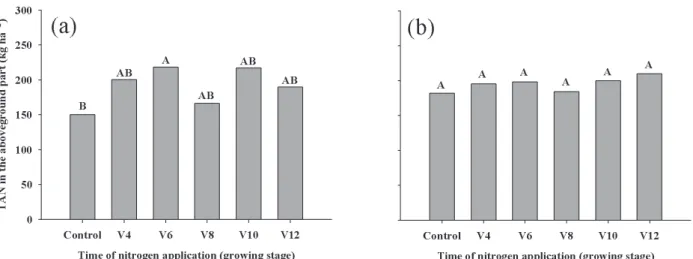
During the 2011–2012 growing season, the total accumulated nitrogen in the aboveground
part of the plant (TAN) differed only between the N sidedress application during the V6 stage and the control treatment (Figure 3a). During 2012– 2013, there were no differences between treatments for this variable (Figure 3b). Although 30 kg ha-1 of N were applied under the control treatment at planting, it may not have been sufficient to ensure normal development of the crop in soils with low N availability, as 30 kg ha-1 of N represented just 20 and 16% of TAN at the end of the corn cycle during the 2011–2012 and 2012–2013 seasons, respectively. Up to approximately V12, during the two growing seasons, visual differences were observed between plants in the control treatments (slightly yellowish) and plants in the treatments with sidedress N application, but there were no differences in TAN (except between V6 and the control in 2011–2012) (Figure 3a). It is likely that the N supply to plants of the control treatment was slow, but steady enough to match up the other treatments at the end of the crop cycle. This ability of the soil to supply N may be related to the soil organic matter (SOM) content at the 0.0–0.2 m (29.5 g kg-1) and 0.2–0.4 m (23 g kg-1) soil layers, and especially to the high SOM mineralization rate, responsible for inorganic N supply, that are possibly taken up and used by plants.
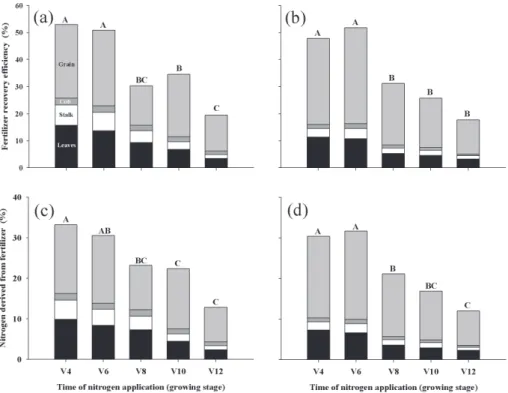
V10 and V12 stages. Therefore, even correcting for the effective rate of N-fertilizer supplied to the crop, FRE maintained the same behavior, showing higher values when the fertilizer was applied during the V4 or V6 stages. This demonstrates that volatilization losses were not the only factor influencing the difference between the treatments’ FRE and that the N application time is crucial for fertilizer recovery by corn plants.
Several FRE values have been reported for corn, varying from 19 (Gava et al. 2010) to 89% (Lara Cabezas and Couto 2007). In addition to different soil-climatic conditions (Hauck 1973, Torbert et al. 1992), FRE variations are usually related to N source (Lara Cabezas and Couto 2007, Lange et al. 2010), soil management system (Gava et al. 2006), timing and method of N application (Lara Cabezas and Couto 2007, Duete et al. 2008, Lange et al. 2010), and N rate (Scivittaro et al. 2003, Duete et al. 2008, Gava et al. 2010).
A decrease in FRE under the treatments with N application during later stages may be related to the fact that until N sidedress application, plants were supplied only by soil N and/or N applied at planting, while under the treatments with earlier sidedress N applications (V4 and V6), N-fertilizer
may have been absorbed earlier, resulting in a higher FRE. Evaluating the rates and methods of split N application, Duete et al. (2008) also observed that applications during later stages (after V8) did not increase fertilizer recovery.
N-fertilizer application during the V4 and V6 stages coincided with the beginning of the increasing N uptake rate, as stated by Bender et al. (2013). Amado et al. (2002) verified higher N recovery as a result of the synchrony between N supply and the high demand period. Additionally, during later growth stages, the root system is more developed, making the plants less dependent on N-fertilizer because of larger soil volume exploration.
As TAN did not differ between treatments (Figure 3), nitrogen derived from fertilizer (NDFF) followed the same behavior of FRE (Figures 4c, 4d), showing higher values with N application during stages V4 and V6. The highest NDFF values were 33.1 and 31.7% of TAN, and the lowest were 12.9 and 12.0 during the 2011–2012 and 2012– 2013 growing seasons, respectively.
The observed low NDFF values show that N-fertilizer was not the main N source for the corn plants, and the plant N derived from other sources in the soil was responsible for up to 88% of TAN, Figure 3 -Total accumulated nitrogen (TAN) in the aboveground part of corn plants as a function of urea sidedress timing during 2011–2012 (a) and 2012–2013 (b). Control indicates absence of sidedress N application. Columns with different letters differ
between each other by Tukey’s test (p≤0.05). Coefficients of variation for the 2011–2012 and 2012–2013 growing seasons were 15
similar to that reported by Gava et al. (2006) and Duete et al. (2008).
As N from fertilizer presents considerable interaction with soil organic nitrogen (SON) pools (Scivittaro et al. 2003), fertilizer efficiency could be higher than its recovery by plants at the end of the cycle. In this interaction, known as “pool substitution,” part of the N derived from fertilizer is immobilized by soil microbial biomass (SMB), and in contrast, part of the SON is mineralized, and can be taken up by plants (Rao et al. 1992). Another factor that can lead to plant fertilizer recovery underestimation is the possibility of gas exchange (uptake and emission) of N via foliar occurrence, especially after flowering. In this case, N from fertilizer is taken up by the roots, assimilated, incorporated into various reactions in the plant,
and then lost to the atmosphere through the leaves. Therefore, due to foliar N losses (which in certain situations can be significant), a hypothesis is that plants may require greater amounts of N than just that estimated by final N accumulation.
Grain yield did not differ between treatments during the 2011–2012 and 2012–2013 growing seasons (Figures 5a, b), although the variation was greater between treatments during 2011–2012. The average grain yield of all treatments was 8334 and 10848 kg ha-1, respectively, for 2011–2012 and 2012–2013. The lowest grain yield during the first season was probably a result of the high incidence of disease in the corn, especially Diplodia ear rot (Stenocarpella maydis and Stenocarpella
macrospora). Disease incidence also promoted a
high uncontrolled variation (experimental error), Figure 4 -Fertilizer recovery efficiency during the 2011–2012 (a) and 2012–2013 (b) growing
constraining significant difference detection, even between the lowest (7120 kg ha-1) and the highest (9862 kg ha-1) grain yield. During the second growing season, pest control was effective, avoiding the occurrence of severe disease symptoms.
Absence of corn grain yield gain with N application was also observed by González Villalba (2014), at the same experimental site, evaluating blends of polymer-sulfur-coated urea and conventional urea applied only at corn planting, without further sidedress application. The author found that the control treatment (no N application) grain yield (10100 kg ha-1) was similar to the grain yield obtained using 180 kg ha-1 of N application as polymer-sulfur-coated urea (10750 kg ha-1) or conventional urea (9840 kg ha
-1
), raising the hypothesis that the soil presents high N mineralization potential. Considering this, it is plausible that in the present study, the soil provided sufficient N supply for the crop, and although less N accumulated in the plants early in the season under the control treatment, N availability did not limit grain yield. As soil N mineralization is related to SOM oxidation, and according to Muzilli (1983), it is higher in soils under conventional tillage, the soil preparation operation during the two years probably contributed to increased N availability for the corn plants.
It is common to find in the literature corn grain yield increases with N application (Araújo et al. 2004, Ohland et al. 2005, Santos et al. 2010, Amado et al. 2013). However, there are also studies that, under Brazilian conditions, found little response to N fertilization by corn (Ohland et al. 2005, Soratto et al. 2010), or no response at all (Casagrande and Fornasieri Filho 2002, Lange et al. 2009, Goes et al. 2012).
No corn grain yield response to N application occurs when the limiting factor is not N availability but any other important factor. Evaluating N rates of corn plantings during two seasons with different climatic conditions, Amado et al. (2013) observed
that when rainfall was sufficient, responses to N rates were higher (increase of 4241 kg ha-1 compared to the control without N application, that yielded 8657 kg ha-1). However, during the season with a hydric deficit, a gain of only 1885 kg ha-1
was observed with N application (control treatment yielded 3226 kg ha-1). Thus, according to the authors, high corn yields and higher response to N rates are associated with soil water availability and rainfall indexes (intensity and distribution). Water restriction is also cited as a possible limiting factor for corn response to N fertilization by Casagrande and Fornasieri Filho (2002), Soratto et al. (2010) and Goes et al. (2012), who obtained maximum yields of 5292, 4904 and 7683 kg ha-1, respectively, demonstrating grain yield limitation even with N supply via fertilizers. However, considering the high soil water-holding capacity of the experimental site (530 g kg-1 of clay) and the rainfall distribution
during the crop cycle during both seasons (Figure 1), we can verify that no water restriction was observed in the present study. The sufficient water availability is verifiable looking at the high yields observed during 2011–2012 and 2012–2013 (8334 and 10848 kg ha-1, respectively), which are higher
than the corn grain yield average of São Paulo State (6100 and 6500 kg ha-1, respectively), according to
Conab (2013).
Studies by Araújo et al. (2004), Ohland et al. (2005), Lange et al. (2009) and Amado et al. (2013) also obtained high corn grain yields (> 8000 kg ha-1) under treatments without N application, or when N was applied at low rates at planting, without further sidedress application. We may highlight that these studies were developed under different edapho-climatic conditions and that soil and climate variations complicate prediction of corn grain yield response to N application when no cropping history of the experimental area is available.
season (Figures 5c, d). During the first growing season, GHI and NHI were, on average, 42 and 56%, while during the second season they were 53 and 68%, respectively. This may be due to disease incidence, as previously discussed, especially after flowering, causing a grain yield reduction; however, without altering significantly leaves, stem and cob dry mass (DM).
During the 2011–2012 season no difference between treatments was observed for GHI and NHI, although variations between them were higher than during the 2012–2013 season, in which significant effects were detected (Figure 5d). No difference between treatments occurred likely as a result of the high uncontrolled variation (coefficient of variation of 12% for GHI and 11% for NHI), as observed for grain yield.
During 2012–2013, the coefficient of variation for GHI and NHI were, respectively, 2 and 3%, thus making it possible to detect significant differences between treatments. Therefore, when GHI significant differences were detected, GHI values were very close for all treatments, with a maximum difference of 3.6% between the highest and lowest value. Similar GHIs were found by Lara Cabezas et al. (2000), 54%, and Gava et al. (2010), 48%.
During the second season the highest NHI was observed under the control treatment (71%), and the lowest when N was applied during the V4 (65%), V6 (66%) or V8 (66%) stages, evidence of grains as the main sink of N in corn plants. Ciampitti and Vyn (2013), revising N sources for corn grains (remobilization or N uptake after flowering), observed NHI variation from 9.6 to 83.9% (63.4% Figure 5 -Grain yield during the 2011–2012 (a) and 2012–2013 (b) growing seasons, grain and nitrogen
on average), close to the values found in this study, when N was applied. In general, low harvest indexes, either GHIs or NHIs, are related to biotic or abiotic factors reducing grain number and weight (Ciampitti and Vyn 2013), as occurred in this study when a high disease incidence was reported. On the other hand, elevated harvest indexes are associated with high grain yields (Ciampitti and Vyn 2012).
Nitrogen sidedress application time is a key factor in corn production. However, there are situations, as the observed in this study, where no grain yield response to N application is observed. We must consider these results carefully and reflect with the whole cropping system over the long term in mind. Nitrogen extraction by corn is high, and we should not deplete soil N, adding N to at least maintain soil N levels. Nitrogen is a potential contaminant, so we must look for a sustainable environmentally friendly production system. Finding strategies to improve nitrogen use efficiency in corn production systems is a major issue. Current yield goal and organic matter content-based fertilizer recommendation systems may not be meeting current challenges to preserve the environment while achieving higher yields. Research on soil N-supplying potential must be encouraged to help us detect soils with higher/lower likelihood of response to fertilizer N application to adapt N application rates and timing for diverse farming regions.
CONCLUSIONS
Later sidedress N application (during the V10 and V12 growth stages) resulted in higher N losses by ammonia volatilization, while N application during early growth stages (V4 or V6) provided greater N-fertilizer recovery, up to 53%.
N-fertilizer recovery decreased as N was applied during later growing stages and no increase in grain yield with sidedress N application was observed. Therefore, it was not possible to set the
best time of sidedress N application for corn yield due to edapho-climatic conditions of the study site, but early N applications were more efficient to avoid N losses by volatilization than later ones.
ACKNOWLEDGMENTS
The authors thank the Conselho Nacional de Desenvolvimento Científico e Tecnológico (CNPq - Project: 480225/2011-7) for financial support and the Fundação de Amparo à Pesquisa do Estado de São Paulo (FAPESP - Project: 2011/07176-1) for scholarship to the first author.
REFERENCES
ABBASI MK, TAHIR MM AND RAHIM N. 2013. Effect of N fertilizer source and timing on yield and N use efficiency of rainfed maize (Zea mays L.) in Kashmir-Pakistan. Geoderma 195: 87-93.
AL-KANANI T, MACKENZIE AF AND BARTHAKUR NN. 1991. Soil water and ammonia volatilization relationships with surface-applied nitrogen fertilizer solutions. Soil Sci Soc Am J 55: 1761-1766.
ALVES DRB, FRIZZONE JA AND DOURADO NETO D. 2001. Repartição da lâmina de irrigação, aplicada via pivô central, na cultura do milho. R Bras Eng Agric Amb 5: 67-70.
AMADO TJC, MIELNICZUK J AND AITA C. 2002. Recomendação de adubação nitrogenada para o milho no RS e SC adaptada ao uso de culturas de cobertura do solo, sob sistema plantio direto. R Bras Ci Solo 26: 241-248. AMADO TJC, VILLALBA EOH, BORTOLOTTO RP, SANTI
AL, LEÓN EAB, MENEFEE D AND KUNZ J. 2013. Efficiency of nitrogen fertilizer applied at corn sowing in contrasting growing seasons in Paraguay. R Bras Ci Solo 37: 1641-1650.
ARAÚJO LAN, FERREIRA ME AND CRUZ MCP. 2004. Adubação nitrogenada na cultura do milho. Pesq Agropec Bras 39: 771-777.
BARRIE A AND PROSSER SJ. 1996. Automated analysis of light-element stable isotopes by isotope ratio mass spectrometry. In: Boutton TW and Yamasaki S (Eds), Mass spectrometry of soils. New York: Marcel Dekker, p. 1-46. BENDER RR, HAEGELE JW, RUFFO ML AND BELOW
FE. 2013. Nutrient uptake, partitioning, and remobilization in modern, transgenic insect-protected maize hybrids. Agron J 105: 161-170.
from urea, applied to soil of varying moisture content. J Soil Sci 38: 679-687.
CANTARELLA H AND DUARTE AP. 2004. Manejo da fertilidade do solo para a cultura do milho. In: Galvão JCC and Miranda GV (Eds), Tecnologia de produção de milho. Viçosa, MG: UFV, p. 109-182.
CANTARELLA H, MATTOS JÚNIOR D, QUAGGIO JA AND RIGOLIN AT. 2003. Fruit yield of Valencia sweet orange fertilized with different N sources and the loss of applied N. Nutr Cycl Agroecosyst 67: 215-223.
CANTARELLA H, RAIJ B VAN AND CAMARGO CEO. 1997. Cereais. In: Raij B Van, Cantarella H, Quaggio JA and Furlani AMC (Eds), Recomendações de adubação e calagem para o Estado de São Paulo. 2ª ed., rev. Campinas: IAC, p. 45-71. (Boletim Técnico, 100).
CASAGRANDE JRR AND FORNASIERI FILHO D. 2002. Adubação nitrogenada na cultura do milho safrinha. Pesq Agropec Bras 37: 33-40.
CIAMPITTI IA AND VYN TJ. 2012. Physiological perspectives of changes over time in maize yield dependency on nitrogen uptake and associated nitrogen efficiencies: A review. Field Crops Res 133: 48-67. CIAMPITTI IA AND VYN TJ. 2013. Grain nitrogen source
changes over time in maize: a review. Crop Sci 53: 366-377.
C O N A B - C O M PA N H I A N A C I O N A L D E ABASTECIMENTO. 2013. Acompanhamento da safra brasileira: grãos. 9o
Levantamento. Brasília, DF.
C O N A B - C O M PA N H I A N A C I O N A L D E ABASTECIMENTO. 2014. Acompanhamento da safra brasileira: grãos. 4o
Levantamento. Brasília, DF.
DA ROS CO, AITA C AND GIACOMINI SJ. 2005. Volatilização de amônia com aplicação de uréia na superfície do solo, no sistema plantio direto. Ci Rural 35: 799-805.
DALMAGO GA, BERGAMASCHI H, KRÜGER CAMB, BERGONCI JI, COMIRAN F AND HECKLER BMM. 2010. Evaporação da água na superfície do solo em sistemas de plantio direto e preparo convencional. Pesq Agropec Bras 45: 780-790.
D AWA R K , Z A M A N M , R O WA R T H J S , BLENNERRHSSETT J AND TUMBULL MH. 2011. Urea hydrolysis and lateral and vertical movement in the soil: effects of urease inhibitor and irrigation. Biol Fertil Soils 47: 139-146.
DUETE RRC, MURAOKA T, SILVA EC, TRIVELIN PCO AND AMBROSANO EJ. 2008. Manejo da adubação nitrogenada e utilização do nitrogênio (15N) pelo milho em Latossolo Vermelho. R Bras Ci Solo 32: 161-171.
FENILLI TAB, REICHARDT K, TRIVELIN PCO AND FAVARIN JL. 2007. Volatilization of ammonia derived from fertilizer and its reabsorption by coffee plants. Commun Soil Sci Plant Anal 38: 1741-1751.
GAVA GJC, OLIVEIRA MW, SILVA MA, JERÔNIMO EM, CRUZ JCS AND TRIVELIN PCO. 2010. Produção de fitomassa e acúmulo de nitrogênio em milho cultivado com diferentes doses de 15
N-ureia. Semina: Ci Agrar 31: 851-862.
GAVA GJC, TRIVELIN PCO, OLIVEIRA MW, HEINRICHS R AND SILVA MA. 2006. Balanço do nitrogênio da ureia (15
N) no sistema solo-planta na implantação da semeadura direta na cultura do milho. Bragantia 65: 477-486. GOES RJ, RODRIGUES RAF, ARF O AND VILELA RG.
2012. Nitrogênio em cobertura para o milho (Zea mays L.) em sistema plantio direto na safrinha. R Bras Milho Sorgo 11: 169-177.
GONZÁLEZ VILLALBA HA. 2014. Misturas de ureia revestida com polímero e ureia convencional na adubação da cultura do milho [dissertação de mestrado]. Piracicaba: Escola Superior de Agricultura “Luiz de Queiroz”. (Não publicado).
HAUCK RD. 1973. Nitrogen tracers in nitrogen cycle studies-past use and future needs. J Environ Qual 2: 317-327. HUBER DM, TSAI CY AND STROMBERGER JA. 1994.
Interaction of K with N and their influence on growth and yield potential of maize. In: Proceedings of 48ª. Annual Corn And Sorghum Research Conference; 1994; Chicago. Chicago: American Seed Trade Association, p. 165-176. IDSO SB, REGINATO RJ, JACKSON RD, KIMBALL KB
AND NAKAYAMA FS. 1974. The three stages of drying in a field soil. Soil Sci Soc Am J 38: 831-837.
JENSEN M, BURMAN RD AND ALLEN RG. 1990. Evapotranspiration and irrigation water requirements. New York: ASCE. (Manuals and reports on engineering practice, 70).
JHONSON JW AND KURTZ LT. 1974. A technique for reducing 15
N required for field experiments with labeled nitrogen fertilizer. Soil Sci 117: 315-317.
LANGE A, LARA CABEZAS WA AND TRIVELIN PCO. 2009. Produtividade de palha e de milho no sistema semeadura direta, em função da época da aplicação do nitrogênio no milho. R Bras Milho Sorgo 8: 57-68. LANGE A, LARA CABEZAS WAR AND TRIVELIN PCO.
2010. Sulfato de amônio e uréia em cobertura no milho em semeadura direta no Cerrado. R Ceres 57: 817-824. LARA CABEZAS WAR AND COUTO PA. 2007. Imobilização
de nitrogênio da uréia e do sulfato de amônio aplicado em pré-semeadura ou cobertura na cultura de milho, no sistema plantio direto. R Bras Ci Solo 31: 739-752. LARA CABEZAS WAR, TRIVELIN PCO, BENDASSOLLI
JA, SANTANA DG AND GASHO GJ. 1999. Calibration of a semi-open static collector for determination of ammonia volatilization from nitrogen fertilizers. Commun Soil Sci Plant Anal 30: 389-406.
nitrogenada sólida e fluida de cobertura na cultura do milho, em sistema plantio direto no triângulo mineiro (MG). R Bras Ci Solo 24: 363-376.
LEMON ER. 1956. The potentialities for decreasing soil moisture evaporation loss. Soil Sci Soc Am J 20: 120-125. LÜ P, ZHANG JW, JIN LB, LIU W, DONG ST AND LIU P.
2012. Effects of nitrogen application stage on grain yield and nitrogen use efficiency of high-yield summer maize. Plant Soil Environ 58: 211-216.
MUZILLI O. 1983. Influência do sistema de plantio direto, comparado ao convencional, sobre a fertilidade da camada arável do solo. R Bras Ci Solo 7: 95-102.
NÖMMIK H. 1973. The effect of pellet size on the ammonia loss from urea applied to forest soil. Plant Soil 39: 308-318.
OHLAND RAA, SOUZA LCF, HERNANI LC, MARCHETTI ME AND GONÇALVES MC. 2005. Culturas de cobertura do solo e adubação nitrogenada no milho em plantio direto. Ci Agrotec 29: 538-544.
PARKIN TB AND CODLING EE. 1990. Rainfall distribution under a corn canopy: Implications for managing agrochemicals. Agron J 82: 1166-1169.
RAIJ B VAN, ANDRADE JC, CANTARELLA H AND QUAGGIO JA (Eds). 2001. Análise química para avaliação da fertilidade de solos tropicais. Campinas: Instituto Agronômico.
RANDALL GW AND VETSCH JA. 2005. Corn production on a subsurface drained Mollisol as affected by fall versus spring application of nitrogen and nitrapyrin. Agron J 97: 472-478.
RAO ACS, SMITH JL, PARR JF AND PAPENDICK RI. 1992. Considerations in estimating nitrogen recovery efficiency by the difference and isotopic dilution methods. Fert Res 33: 209-217.
RITCHIE SW, HANWAY JJ AND BENSON GO. 1993. How a corn plant develops. Ames: Iowa State University of Science and Technology. (Special Report, 48).
SANGOI L, ERNANI PR, LECH VA AND RAMPAZZO C. 2003. Volatilização de N-NH3 em decorrência da forma de aplicação de ureia, manejo de resíduos e tipo de solo, em laboratório. Ci Rural 33: 687-692.
SANTOS MM, GALVÃO JCC, SILVA IR, MIRANDA GV AND FINGER FL. 2010. Épocas de aplicação de
nitrogênio em cobertura na cultura do milho em plantio direto, e alocação do nitrogênio (15N) na planta. R Bras Ci Solo 34: 1185-1194.
SAS - STATISTICS ANALYSES SYSTEM INSTITUTE INC. 2009. SAS software Version 9.2. Cary, NC.
SCIVITTARO WB, MURAOKA T, BOARETTO AE AND TRIVELIN PCO. 2000. Utilização de nitrogênio de adubos verdes e mineral pelo milho. R Bras Ci Solo 24: 917-926. SCIVITTARO WB, MURAOKA T, BOARETTO AE AND
TRIVELIN PCO. 2003. Transformações do nitrogênio proveniente de mucuna-preta e uréia utilizados como adubo na cultura do milho. Pesq Agropec Bras 38: 1427-1433.
SILVA EC, MURAOKA T, BUZETTI S AND TRIVELIN PCO. 2006. Manejo de nitrogênio no milho em Latossolo Vermelho sob plantio direto com diferentes plantas de cobertura. Pesq Agropec Bras 41: 477-486.
SOIL SURVEY STAFF. 2014. Keys to soil taxonomy. 12th ed., USDA-Natural Resources Conservation Service, Washington, DC.
SORATTO RP, PEREIRA M, COSTA TAM AND LAMPERT VN. 2010. Fontes alternativas e doses de nitrogênio no milho safrinha em sucessão à soja. R Ci Agron 41: 511-518.
TORBERT HA, MULVANEY RM, HEUVEL V AND HOEFT RG. 1992. Soil type and moisture regime effects on fertilizer efficiency calculation methods in a N-15 tracer study. Agron J 84: 66-70.
TRIVELIN PCO, OLIVEIRA MW, VITTI AC, GAVA GJC AND BENDASSOLLI JA. 2002. Perdas do nitrogênio da ureia no sistema solo-planta em dois ciclos de cana-de-açúcar. Pesq Agropec Bras 37: 193-201.
VARGAS VP, SANGOI L, ERNANI PR, PICOLI GJ AND CANTARELLA H. 2015. Maize leaf phytotoxicity and grain yield affected by nitrogen source and application method. Agron J 107: 671-679.
VENTURA F, SNYDER RL AND BALI KM. 2006. Estimating evaporation from bare soil using soil moisture data. J Irrig Drain E-Asce 132: 153-158.