Abstract
—
Climate change, growth in population and rising pressures on natural recourses triggered by mining and similar activities have led to enormous environmental challenges. Acid mine drainage (AMD) from mining operations in South Africa causes severe environmental issues in need of drastic and lasting solutions. Contamination from AMD requires prevention and mitigation measures to address the various significant impacts on human and environmental health. This pressing challenge permitted the study to investigate and analyze the breakthrough curves and permeation parameters of a subtropical kaolinite clay mineral soil interacted with AMD towards determining its buffering efficacy as a natural contaminant barrier for use in sites prone to AMD contamination. Series of AMD permeation through the soil medium was conducted. The results of the study revealed that when the soil was percolated with 0.01N CaSO4, a baseline hydraulic conductivity of 8.2 × 10⁻¹² m/s was reached which increased to about 9.1 × 10⁻¹² m/s after percolation with 2 pore volumes of AMD. Nevertheless, after passing 23 pore volumes of AMD, the hydraulic conductivity was seen to increase by nearly half an order of magnitude (8.2 × 10⁻¹² m/s to 1.5 × 10⁻¹¹ m/s).The value was found to be below the accepted criterion of 1×
10-9 m/s specified for clay liner construction in South Africa as such may not be used solely in the construction of containment barriers for acid-forming waste.Keywords—Contaminants, Seepage, Acid Mine Drainage (AMD), Clayey Soils, Buffers
I.INTRODUCTION
CID mine drainage (AMD) forms in mining environments when ore and waste materials, containing sulphide minerals such as pyrite, are exposed to water and oxygen. In other words, when some mine tailings from
Manuscript received August 9, 2016.
Emmanuel Emem-Obong Agbenyeku is a research student at the University of Johannesburg, South Africa (phone: +27 11 559 6396; e-mail: [email protected]; [email protected]).
Edison Muzenda is a Professor of Chemical and Petroleum Engineering and Head of Department of Chemical, Materials and Metallurgical Engineering, College of Engineering and Technology, Botswana International University of Science and Technology, Private Mail Bag 16, Palapye, Botswana, as well as visiting Professor at the University of Johannesburg, Department of Chemical Engineering, Faculty of Engineering and the Built Environment, Johannesburg, P.O.Box 17011, 2028, South Africa (phone: +27 11 559 6817; e-mail: [email protected]; [email protected]).
Innocent Mandla Msibi is Group Executive of Innovation and Impact, Water Research Commission, Pretoria; Research and Innovation Division, University of Johannesburg, South Africa (phone: +27 12 330 0344; e-mail: [email protected]).
processed sulphide-rich ores are oxidized, AMD may be generated. In South Africa, studies on AMD formation, transport and impacts particularly in the Witwatersrand have been performed by the Council for Geoscience, on behalf of the Department of Mineral Resources [1]. The disturbance of ore bodies and the transport of large volumes of pyritic material to the surface create conditions highly conducive to the generation of AMD, both owing to the exposure of ore in the underground environment and due to the transport of blasted and/or crushed waste rock and tailings to the surface. In order for pyrite to oxidize, both oxygen and water must be present. Water serves not only as a reactant, but also as a reaction medium and a product transport solvent [2]. The rate of AMD generation in an environment where sulphidic material is exposed to oxygen and water, will be determined by a number of factors. The reactions will proceed rapidly in warm humid environments, while other environmental factors, such as the specific sulphide mineralogy and grain size, and the presence or absence of acid neutralizing minerals, such as carbonates will also influence the rate of AMD production and its eventual environmental impact.
The major source of groundwater contamination by mine tailings have been suggested to be AMD [3]. The environmental impact of AMD as reviewed by [4] include; metal toxicity, sedimentation processes and high acidity, which usually have the potential to cause interrelated negative impacts on terrestrial and aquatic life. Since AMD has potential negative impacts on the environment, efforts are made to either prevent or control its generation and migration. As such, several measures and technologies are available as recorded by [5-7] for mitigating the environmental effects of AMD. These include co-disposal of waste rock and mine tailings and the construction of wetlands, base liners or water covers. Soil covers and liners may also be used as hydraulic barriers for containing AMD leakage at mine sites. When used for this purpose, it is usually pertinent to determine whether the soil liner can buffer contaminants or is compatible with AMD.
Consequently, several studies have been conducted on the compatibility of some soils from temperate regions with AMD [8-10]. However, as earlier pointed out, there is need to investigate the interaction of AMD with tropical/subtropical soils as there is insufficient data and knowledge in this area of AMD-soil compatibility interest whose gap requires bridging.
South Africa’s mining history has created vast economic
Interpretation of Breakthrough Curves and
Percolation Factors from Sub-Tropical
Smectite, Fe-Chlorite and Kaolinite Clayey
Soil-AMD Interactions
Emmanuel Emem-Obong Agbenyeku, Edison Muzenda and Innocent Mandla Msibi, Member, IAENG
benefits and still plays an important role in safeguarding the
country’s stance in the global market. Despite such benefits,
mining sector operations as elsewhere in the world, have resulted in serious environmental consequences, notably in respect of poor environmental and water management and, in the case of the gold mines of the Witwatersrand, AMD. Pyrite (FeS2), sphalerite (ZnS), galena (PbS), arsenopyrite (FeAsS) and occasionally chalcopyrite (CuFeS2) are associated with gold mineralization in operating gold mines in South Africa [11-13]. As recorded by [7] mining activities and processing from these sulphidic ores have led to several tonnes of mine waste that oxidize and lead to the widespread generation of AMD in and around areas where such operations occur in South Africa.
AMD is known to occur in a number of areas in South
Africa, mostly in the Witwatersrand Gold Fields, the country’s various Coal Fields and the O’Kiep Copper District. Thus,
potable sources of water in mining areas, some of which are densely populated, are severely at risk due to AMD contamination. The key factors which differentiate the developing problem in South Africa from international scenarios is the degree of interconnection of large voids, the sheer scale of the Witwatersrand operations and the fact that many of the problem areas are located in or close to major urban centres. Most mining centres are also covered by the natural habitats of some rare and endangered species. Bioaccumulation of metals from AMD adversely affects flora and fauna in South Africa and this has led to the loss of food sources and elimination of some sensitive species [14], [15]. The surface flow or decant of mine water is also of concern to the environment as the water, in accordance with well-known and researched chemical and geochemical reactions between the mine rock strata, wastes and oxygen, readily becomes acidic, characterized by elevated concentrations of salts, heavy metals and radionuclides. The immediate concern is the threat posed by decanting mine water in the Witwatersrand area, which poses potentially severe environmental and safety impacts on the receiving water environment and associated surface areas [6], [16]. In this light, mitigating the effects of AMD contamination of the South African mine environment is vital.
Presently, with the sulphidic ore exploitation in South Africa, mine tailings dams and acid water containment ponds are being constructed for the storage of mine waste being generated from mining operations, and assessment of the suitability of local construction materials is therefore essential. In an earlier stage of this study, the chemical and mechanical properties, and the mineralogical composition of the sampled soil, prior and subsequent to AMD percolation were determined and the results were presented. However, the study herein investigates the diffusive and advective permeation of AMD through subtropical smectite, Fe-chlorite and kaolinite compacted clayey soil, sampled around the City of Johannesburg (CoJ) where waste is disposed. To assess the impact of contaminant percolation processes on the buffering efficacy and performance of the soil as a lining material, a bespoke device was used to permeate the soil with AMD at low flow rates typical of field conditions. The pH, electrical conductivity and solute breakthrough curves from AMD permeation were examined as well as batch sorption and
diffusion tests. The experimental data here from, forms part of a larger study to characterize a number of solute transfer processes as AMD interacted with the sampled subtropical smectite, Fe-chlorite and kaolinite clayey sample designated as Soil K being examined for its buffering efficacy towards potential use as natural earthen lining material (locally available clayey mineral liner) for the containment of mine waste and associated contaminants.
II. EXPERIMENTAL APPROACH
The contaminant mass transport mechanisms in natural and compacted clayey soils have been extensively studied by several authors from past to recent times [17-24]. Sorption, diffusion and hydraulic conductivity tests were performed to determine retardation factors, effective diffusion coefficients and hydraulic conductivities respectively. Diffusion may be the dominant contaminant transport mechanism in clayey soils and as such, laboratory diffusion testing was carried out as a routine approach in the assessment of the tested clayey samples. The advection-dispersion expression by [25] was used to calculate the one-dimensional solute transport through the homogeneous, isotropic compacted clayey Soil K sample as discussed in a previous study.
III. RESULTSANDDISCUSSION A. Interpretation of Effluent Breakthrough Curves
The initial AMD composition, soil porewater composition and the cation exchange reactions largely influence the effluent composition. This is resultant of the interactions between cations in AMD and the cations at the soil exchange sites, and the impact of AMD on the crystal lattice of soil minerals. Hence, the effluent pH, electrical conductivity and solute breakthrough curves obtained as a result of AMD seepage through the Soil K medium is generally used to assess the properties and composition of the effluents.
B. pH
approached unity. This outcome was similar to the behaviour displayed by the kaolinite, halloysite and illite/vermiculite mixed layer and kaolinite subtropical clayey soils tested in previous studies. The effluent pH value of Soil K approached equilibrium pH (pHeff/pHinf ~ 1) after 20 pore volumes of AMD permeation.
Fig. 1. Effluent breakthrough curve for pH of the tested Soil K
This suggested that Soil H (subtropical kaolinite clayey soil) had a lower soil pH buffering efficacy than kaolinite, halloysite and illite/vermiculite mixed layer and smectite, Fe-chlorite and kaolinite mixed layer tested in previous studies. C. Electrical Conductivity
Generally, an increase in the relative electrical conductivity of effluent with increasing pore volumes of AMD permeation through the soil was observed. The increase in relative electrical conductivity of the effluents was consequently attributed to the increasing concentrations of ions, particularly aluminium, iron, magnesium, calcium, sodium and potassium in the effluents as a result of AMD permeation through the soil. Fig. 2 shows the relative effluent electrical conductivity (ECe/ECi) breakthrough curve obtained from the permeation
of Soil K with AMD. The relative effluent electrical conductivity breakthrough curve is a weighted contribution from the influent ionic composition and the ions originally present at the soil exchange sites. Thus, the electrical conductivity of a fluid depends on the number and type of ions contained in the fluid.
Fig. 2. Effluent breakthrough curve for electrical conductivity of the tested Soil K
Correspondingly, it has been shown that electrical conductivity is an indicator of the ease with which fluid
carries an electrical current [27]. Typically, it is expected that close to 1 pore volume of permeant seepage, relative electrical conductivity of 0.5 would be reached as recorded by [28]. This was the case as the relative effluent electrical conductivity value of 0.5 was reached after passing close to 1 pore volume of AMD through Soil K. Considering the low seepage rates ensured throughout the study, reaching the relative electrical conductivity of 0.5 close to 1 pore volume of AMD percolation through Soil K may be indicative of the occurrence of molecular diffusion in Soil K as also recorded by a few authors [29], [30]. A decrease in the relative electrical conductivity of Soil K was observed after 20 pore volumes of AMD percolation. This could not reasonably be accounted for from the composition of effluents as well as from related literature, however, an exception was found in a study by [30] who recorded a similar observation on passage of 15 and 16 pore volumes of AMD through a media of tropical like soils.
D. Soil K Solute-Solvent Interaction
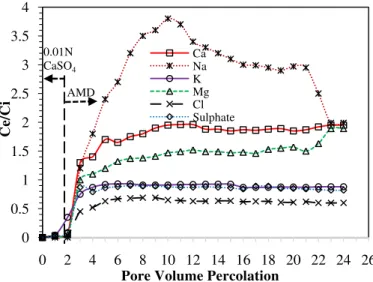
In Soil K, calcium and sodium were observed to experience high increases in their effluent concentrations with sodium showing a high desorption peak which was an indication that it was likely a key specie partaking in the cation exchange reactions as shown in Fig. 3a. Chloride and sulphate were observed to arrive early with their final effluent concentrations remaining below the influent values. Chloride is known to be a conservative contaminant specie because it is a mobile and non-interacting anion whose ions are generally considered to be non-specific ions (i.e., existing only in the outer coating of the double layer) as recorded by [31].
Fig. 3a. Effluent breakthrough curves from Soil K solute-solvent interaction
However, Fig. 3a revealed that chloride which is a conservative species did not behave in that manner. The findings herein coincide with the recorded dissolution of gibbsite, diaspore, magnesioferrite and dolomite (CaMg(CO3)2) as well as the alterations of chlorite and smectite as a result of AMD percolation through Soil K. Initially, potassium was found to be retarded but eventually gained steady concentration as shown in Fig. 3a. The 0
0.5 1 1.5 2 2.5 3
0 2 4 6 8 10 12 14 16 18 20 22 24 26
pHe/pHi
Pore Volumes of AMD Percolation
Soil K
0 0.2 0.4 0.6 0.8 1
0 2 4 6 8 10 12 14 16 18 20 22 24 26
ECe/
ECi
Pore Volumes of AMD Percolation
Soil K
0 0.5 1 1.5 2 2.5 3 3.5 4
0 2 4 6 8 10 12 14 16 18 20 22 24 26
Ce/Ci
Pore Volume Percolation
Ca Na K Mg Cl Sulphate 0.01N
CaSO4
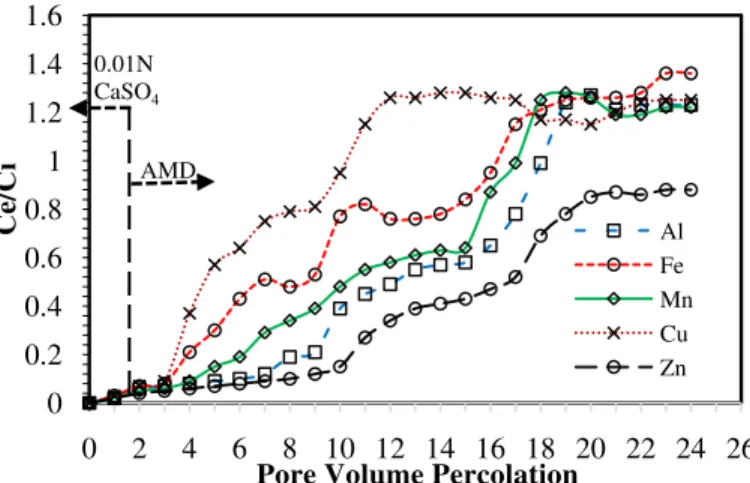
concentrations of iron and aluminium were initially retarded but their effluent concentrations were observed to surpass the influent concentrations after the percolation of 18 pore volumes of AMD as shown in Fig. 3b.
Fig. 3b. Effluent breakthrough curves from Soil K solute-solvent interaction
The zinc and nickel species were noticed to be the heavy metals from AMD that were retarded by Soil K right to the termination of AMD percolation as shown in Figs. 3b and c respectively.
Fig. 3c. Effluent breakthrough curves from Soil K solute-solvent interaction
The relatively high surface area of Soil K and the ability of secondary mineral jarosites to incorporate a wide variety of metals into its crystal structure as indicated by [32] may plausibly account for the contribution towards the relatively high buffering efficacy displayed by Soil K to heavy metals.
E. Contaminant Species Relative Attenuation and Elusion
The procedures outlined by [33] was initiated in determining the relative attenuation number (ATN) for each effluent species representing the relative mobility of the species through the compacted soil. The approach entailed calculating the area under the breakthrough curve of each monitored species and expressing the difference between this area and the total area (rectangular area bounded by the initial and final pore volumes of AMD permeated and the relative
solute concentrations of zero and one) as a percentage of the calculated area under the breakthrough curve of the species. The higher the ATN obtained for a given species present in the effluent the less relatively mobile the species is through the compacted soil while a negative ATN value indicated elution (desorption) of species from the soil. A qualitative description of the attenuation of species was done using the following classification: 0 < ATN < 30% ≡ low attenuation; 30% < ATN
< 75% ≡ moderate attenuation; while ATN > 75% ≡ high
attenuation. From the tests conducted in previous studies using kaolinite, halloysite and illite/vermiculite mixed layer and kaolinite subtropical clayey soils, they were observed to moderately buffer/attenuate chloride and sulphate from AMD whereas in Soil K (smectite, Fe-chlorite and kaolinite), they were found to be eluted into AMD. The ATNs revealed that the exchangeable cations; sodium, calcium and magnesium eluted the soil in various levels into AMD. The general buffering/attenuation of AMD species in the soils followed the trend: smectite, Fe-chlorite and kaolinite > kaolinite, halloysite and illite/vermiculite mixed layer > kaolinite. This observation was not surprising as it coincided with the surface area of the soils. Table I shows the calculated ATN of each effluent species monitored during soil-AMD percolation tests using the constant-head rigid column hybrid permeameter.
TABLE I
Relative buffer/attenuation (ATN) of effluent species from soil-AMD interaction tests
Soil Designation Contaminant
Species
ATN* QAC**
Soil K
Zn 48.9 M
Ni 34.5 M
Co 27.6 L
Cu 28.5 L
K 24.9 L
Mn 21.3 L
Fe 16.7 L
Al 11.5 L
Mg -53.6 N
Ca -74.3 N
Cl -107.6 N
SO4 -132.4 N
Na -167.2 N
*ATN: Relative Attenuation Number; **QAC: Qualitative Attenuation
Classification- H = High attenuation; M = Moderate attenuation; L = Negative attenuation or Elution
F. Interpretation of Effluent Breakthrough Curves
The results from the dissolution tests indicated that for the soil-AMD interaction time, sodium, nickel, cobalt and sulphate were dissolved from Soil K by AMD as shown in Table II. This observation was however, found to have similar trends with studies by several authors [34], [30] who conducted batch sorption tests using soils from tropical regions under similar conditions with the amounts of cobalt dissolved from the soils by AMD being in ranges of 2.7 to 4.1 mg/L. From Table II it is seen that zinc and chloride were adsorbed on Soil K although, 1.5 mL/g was recorded as the highest dissolution degree. Consequently, the most substantially extracted metals by AMD from the Soil K were cobalt and nickel. Furthermore, Soil K was observed to absorb zinc, nickel, potassium and chloride present in AMD.
0 0.2 0.4 0.6 0.8 1 1.2 1.4 1.6
0 2 4 6 8 10 12 14 16 18 20 22 24 26
Ce/Ci
Pore Volume Percolation
Al Fe Mn Cu Zn 0.01N
CaSO4
AMD
0 0.2 0.4 0.6 0.8 1 1.2 1.4 1.6
0 2 4 6 8 10 12 14 16 18 20 22 24 26
Ce/Ci
Pore Volume Percolation
Co
Ni 0.01N
CaSO4
TABLE II
Concentration of contaminant species over the dissolution/batch sorption tests
Sample Test Period (days)
Concentration of Contaminant Species (mg/L)a, b
K Co Na Zn Ni Cl SO4
AMD 4.7 7.5 27.9 161.7 181.3 200.6 5075.4
Soil K 5 2.9 7.1 99.3 145.2 182.1 150.8 7235.2
10 3.1 8.2 104.3 144.6 183.2 152.3 7257.5
15 3.1 8.4 109.5 143.1 181.9 152.9 7294.7
Distribution Coefficient/Dissolution Degree (mL/g)a, b
K Co Na Zn Ni Cl SO4
Soil K 5 2.5 1.4 10.7 0.4 1.3 1.3 1.8
10 2.3 1.4 10.9 0.5 1.4 1.5 1.9
15 2.4 1.6 11.1 0.5 1.4 1.5 1.9
a
Temperature: 22 ± 2oC; b Soil: Solution Ratio (1:4)
During the batch tests, equilibrium conditions were attained which was evident from the data in Table II showing the effect of various interaction times on the insignificant amount of contaminant species dissolved from the soils by AMD. G. Diffusion Tests
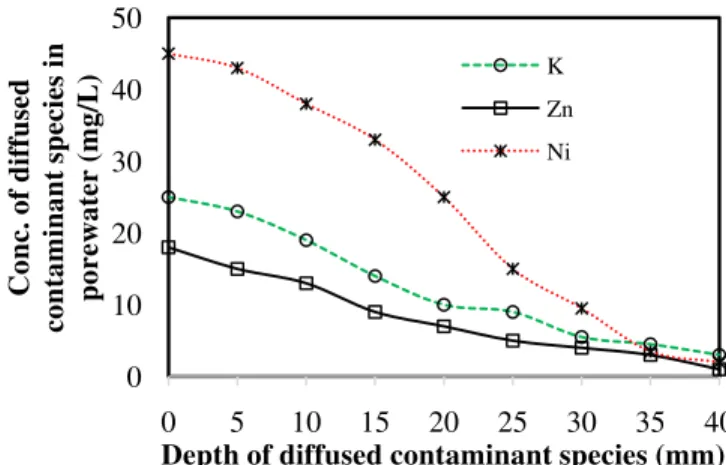
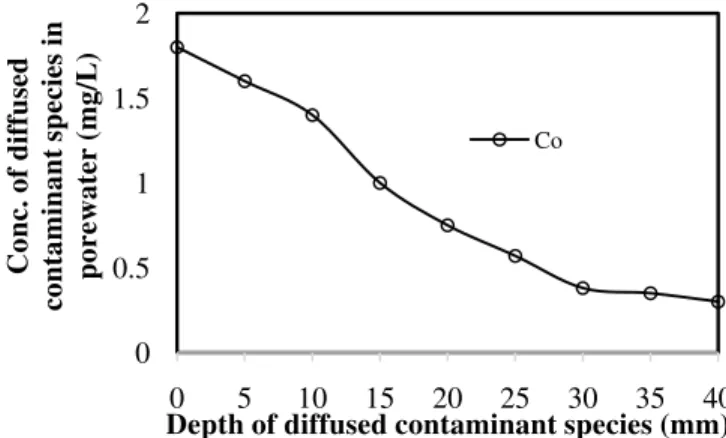
Figs. 4a-e presents the time-dependent concentrations of chemical species in the chamber of the AMD solution during the diffusion tests and the depth-dependent species soil porewater concentrations at the end of the tests. From literature, it was found that [34], [30] obtained similar results. The observed increase in the concentrations of contaminant species in the permeant chamber suggested the release of species from the soil and their reverse diffusion into AMD. However, no change in the concentration of zinc in AMD was observed in the Soil K diffusion test.
Fig. 4a. Time-dependent chemical species conc. in AMD chamber of Soil K diffusion test
The results from the diffusion tests also showed that for Soil K, there was a reduction in potassium concentration in the AMD chamber on termination of the test as presented in Fig 8c; which could plausibly be accounted for by adsorption of potassium from AMD on Soil K. It was generally observed that at the end of the diffusion tests, the soil porewater species concentrations decreased from the reservoir side of compacted soil to the bottom. It was however clear that much of these reductions in porewater species concentrations occurred within the top half section of the compacted soil.
Fig. 4b. Time-dependent chemical species conc. in AMD chamber of Soil K diffusion test
Fig. 4c. Depth-dependent chemical species conc. in porewater of Soil K during diffusion test
Fig. 4d. Depth-dependent chemical species conc. in porewater of Soil K during diffusion test
Nevertheless, at the end of the diffusion test, chloride concentrations in the porewaters of the soils and the sodium concentrations in porewaters of Soil K were found to have increased with depth plausibly caused by the release of these species from the mineral alterations that occurred during the soils-AMD interactions.
0 2 4 6 8 10
0 1 2 3 4 5 6 7 8 9 10 11 12 13 14 15 16
Co
nc.
of
cont
amina
nt
speci
es
(mg
/L
)
Test duration (days)
K
Co
0 50 100 150 200 250 300
0 1 2 3 4 5 6 7 8 9 10 11 12 13 14 15 16
Co
nc.
of
cont
amina
nt
speci
es
(mg
/L
)
Test durations (days)
Zn Ni Cl Na
0 10 20 30 40 50
0 5 10 15 20 25 30 35 40
Co
nc.
of
diffu
sed
cont
amina
nt
speci
es
in
po
rew
at
er
(mg
/L
)
Depth of diffused contaminant species (mm)
K
Zn
Ni
0 50 100 150 200
0 5 10 15 20 25 30 35 40
Co
nc.
of
diffu
sed
cont
amina
nt
speci
es in
po
rew
at
er
(mg
/L
)
Depth of diffused contaminant species (mm)
Na
Fig. 4e. Depth-dependent chemical species conc. in porewater of Soil K during diffusion test
The experimental results were not modelled due to the dissolution of most of the monitored species by AMD during the batch tests. The slight differences in experimental conditions may have led to expected variances between species concentrations in the AMD chamber solution during the diffusion tests and those obtained from the batch tests at roughly similar contact times.
IV CONCLUSIONS
The study presented herein, examined the buffering efficacy of Soil K- subtropical smectite, Fe-chlorite and kaolinite clayey soil sampled from around the City of Johannesburg (CoJ) towards its efficient and effective use as a natural mineral liner for acid mine drainage (AMD) containment and mitigation in areas impacted by mining activities. After 23 pore volumes of AMD permeation through the soil, the measured soil hydraulic conductivity value was to 1.5 × 10⁻¹¹ m/s. This final hydraulic conductivity value fall short of the maximum soil hydraulic conductivity acceptance criterion of 1 × 10⁻⁹ m/s specified for clay liner construction in South Africa. The pH breakthrough curve revealed that the soil has low buffering efficacy to acids so failed to sufficiently buffer/attenuate potential contaminant species present in AMD. Moreover, the solute breakthrough curves clearly indicated that the soil was not effective in buffering the heavy metals and the other pollutant species present in AMD. The species concentrations obtained from either the effluents from the hydraulic conductivity tests or the solution and sections of soil samples obtained from dissolution and diffusion tests suggested that the soil-AMD interaction is a complex process. The results of the study suggest that interactions between AMD and the soil plausibly resulted in dissolution of metals from soil grains, desorption of adsorbed contaminant species at the exchangeable sites of the soil and, alteration and dissolution of soil minerals. Therefore, considering the general outcomes of the study, the Soil K- smectite, Fe-chlorite and kaolinite natural subtropical soil was found to be incompatible with AMD and as such, may not be used solely as natural clayey mineral lining materials towards AMD containment disposal.
ACKNOWLEDGMENT
The Authors appreciate the University of Johannesburg where the study was done.
REFERENCES
[1] Coetzee H. Van Tonder D. Wade P. Esterhuyse S. Van Wyk N. Ndengu
S. Venter J. Kotoane M. 2007. Acid mine drainage in the Witwatersrand: Department of Minerals and Energy, Pretoria, Council for Geoscience Report No 2007-0260, pp. 81.
[2] Van Tonder D.M. Coetzee H. Esterhuyse S. Strachan L. Wade P.W.
Mudau S. 2009. South Africa’s challenges pertaining to mine closure -development and implementation of regional mining and closure strategies. Mine Closure 2009. Proceedings of the forth international seminar on mine closure. Fourier, A., Tibbett, M., Weiersbye I., and Dye, P., Johannesburg, Australian Centre for Geomechanics.
[3] Wade P.W. Woodbourne S. Morris W. Vos P. Jarvis N. 2002. Tier 1 risk
assessment of radionuclides in selected sediments of the Mooi River, Water Research Commission, WRC Report 1095/1/02, Pretoria: 93 p.
[4] Coetzee H. Wade P. Winde F. 2006. An assessment of sources,
pathways, mechanisms and risks of current and future pollution of water and sediments in the Wonderfontein Spruit Catchment, Water Research Commission, WRC Report No. 1214/1/06, Pretoria: 202 p.
[5] Vermaak J.J.G. Wates J.A. Bezuidenhout N. Kgwale D. 2004. The
evaluation of soil covers used in the rehabilitation of coal mines. Research Report 1002/1/04, Water Research Commission, Pretoria.
[6] Tutu H. McCarthy T.S. Cukrowska E. 2008. The chemical
characteristics of acid mine drainage with particular reference to sources, distribution and remediation: The Witwatersrand Basin, South Africa as a case study. Applied Geochemistry, 23, 3666- 3684.
[7] International Network for Acid Prevention (INAP) 2009. Global Acid
Rock Drainage Guide, http://www.gardguide.com.
[8] Seuntjens P. Mallants D. Simunek J. Patyn J. Jacques D. 2002.
Sensitivity analysis of physical and chemical properties affecting field-scale cadmium transport in a heterogeneous soil profile. J. of Hydrol., 264: 185-200.
[9] Amezaga J.M. Younger P.L. 2006. Mine water management in
European Environmental Policy: An Assessment of recent legislative developments. In Barnhisel (ed.) Proceedings of the 7th International
Conference on Acid Rock Drainage ICARD, March, 26-30, St. Louis, Missouri.
[10] Vincenzo C. Antonio C. Alessandro C. 2011. Laboratory-Scale Study on
Reactive Contaminant Transport in Soil By Means of One-Dimensional Advective Dispersive Models. Journal of Ag. Eng-Riv. di Ing. Agr. 3: 1-6.
[11] Hobbs P. Cobbing J. 2007. A hydrogeological assessment of acid mine
drainage impacts in the West Rand Basin, Gauteng Province. Report no. CSIR/NRE/WR/ER/2007/0097/C. Council for Scientific and Industrial Research. Pretoria.
[12] Department of Water Affairs and Forestry, DWAF 2008. Integrated
Mine Water Management, Best Practice Guideline H1, Directorate: Resource Protection and Waste, Pretoria, 67 pp.
[13] Department of Water Affairs DWA 2010. Projects/Programmes,
http://www.dwa.gov.za/projects.aspx (accessed 29 November 2010).
[14] Netili K.F. Van Tonder D. Coetzee H. Rust U. Yibas B. 2010. Strategic
Water Management Project: Proposed way forward prepared by CGS. Council for Geoscience, Pretoria, 21 pp.
[15] Lin L. Hansen R.N. 2010. Mine Flooding, Identification of Decant Site
and determination of Environmental Critical Level on the Central Rand Gold Field, Council for Geoscience Report Number 2010-0199, Council for Geoscience, Pretoria, 75 pp.
[16] Yibas B. Pulles W. Nengovhela C. 2010. Kinetic Development of
Oxidation Zones in Tailings Dams with specific reference to the Witwatersrand Gold Mine Tailings Dams. Report to the Water Research Commission, WRC Report No. 1554/1/10, 105 pp.
[17] Celik B. Rowe R.K. Unlu K. 2009. Effect of vadose zone on the
steady-state leakage rates from landfill barrier Systems. Journal of Waste Management 29:103-109.
[18] Nguyen T.B. 2011. Comparison of four composite landfill liner systems
considering leakage rate and mass flux. Proceedings of 14th Asian
Regional Conference on Soil Mechanics and Geotechnical Engineering, Hong Kong, May 23-27, 2011, 6 p.
0 0.5 1 1.5 2
0 5 10 15 20 25 30 35 40
Co
nc.
of
diffu
sed
cont
amina
nt
speci
es
in
po
rew
at
er
(mg
/L
)
Depth of diffused contaminant species (mm)
[19] Rowe R.K. 2012. Short- and long-term leakage through composite
liners. The 7th Arthur Casagrande Lecture. Proceedings of the 14th
Pan-American Conference on Soil Mechanics and Geotechnical Engineering, Toronto, Ont., Oct. 2011. 49:141-169.
[20] Agbenyeku E.E. Okonta F.N. Ojuri O.O. 2013a. Leachate Flow through
Composite Barrier from Defected Geomembrane. 2nd African Regional Conference on Geosynthetics, Accra, Ghana, 18-20 November (CD ROM).
[21] Agbenyeku E.E. Okonta F.N. Ojuri O.O. 2013b. Evaluation of Empirical
Equations for Leachate Migration through Composite Barrier with Defected Geomembrane. 2nd African Regional Conference on Geosynthetics, Accra, Ghana, 18-20 November (CD ROM).
[22] Agbenyeku E.E. Muzenda E. Msibi I.M. 2014a. “Zeolitic Mineral Liner
as Hydraulic and Buffering Material”, International Conference on
Earth, Environment and Life sciences (EELS-2014) Dec. 23-24, 2014 Dubai (UAE).
[23] Agbenyeku E.E. Muzenda E. Msibi I.M. 2014b. “Buffering of TOC
-Contaminant Using Natural Clay Mineral Liner”, International
Conference on Earth, Environment and Life sciences (EELS-2014) Dec. 23-24, 2014 Dubai (UAE).
[24] Agbenyeku E.E. Akinseye S.A. 2015. Leachate Percolation through
Failed Geomembrane of a Geo-Composite Soil BarrierWorld Journal of
Environmental Engineering, 2015, Vol. 3, No. 2, 52-57.
[25] Rowe R.K. Booker J.R. Fraser M.J. 1994. POLLUTEv6 and
POLLUTE-GUI. User’s guide. Distributed by GAEA Environmental Engineering Ltd., London, ON, Canada.
[26] Yong R.N. Mohamed A.M.O. Warkentin B.P. 1998. Principles of
contaminant transport in soils. Developments in geotechnical engineering. 72. Elsevier Science, Amsterdam, The Netherlands.
[27] Shackelford C.D. Malusis M.A. Mitchell J.M. Stem R.T. 1999.
Electrical conductivity breakthrough curves. Journal of Geotechnical and Geoenvironmental Engineering, 125(4):260-270.
[28] Shackelford C.D. Lee J.M. 2003. The destructive role of diffusion on clay membrane behavior. Clays and Clay Minerals, 51(2), 187-197.
[29] Shackelford C.D. 1988. Diffusion of contaminants through waste
containment barriers. Transportation Research Record No. 1219.
Transportation Research Board, National Research Council,
Washington, DC. pp 169-182.
[30] Frempong E. Yanful E. 2007. Tropical Soils-Acid Mine Drainage
Interactions: Breakthrough Curves and Some Transport Parameters. Journal of Environ. Eng. 133:7, 733-741.
[31] Sposito S. 1979. “Derivation of the Langmuir Equation for Ion
Exchange Reactions in Soils”, Soil Sci. Soc. Amer. Proc., 43:197-198.
[32] Levy D.B. Custis K.H. Casey W.H. Rock P.A. 1997. A comparison of
metal attenuation in mine residue and overburden material from an abandoned copper mine. Applied Geochemistry, 12: 203-211.
[33] Griffin R.A. Shimp N.F. 1978. “Attenuation of Pollutants in Municipal
Landfill Leachate by Clay Minerals”, EPA Report No. EPA 600 -2/78-157.
[34] Tsugawa J.K., Boscov M.E.G., Velio K. L., de Olivera E., (2002),