OSD
7, 1439–1467, 2010Flow and mixing around a glacier
tongue
C. L. Stevens et al.
Title Page
Abstract Introduction
Conclusions References
Tables Figures
◭ ◮
◭ ◮
Back Close
Full Screen / Esc
Printer-friendly Version Interactive Discussion
Discussion
P
a
per
|
Dis
cussion
P
a
per
|
Discussion
P
a
per
|
Discussio
n
P
a
per
|
Ocean Sci. Discuss., 7, 1439–1467, 2010 www.ocean-sci-discuss.net/7/1439/2010/ doi:10.5194/osd-7-1439-2010
© Author(s) 2010. CC Attribution 3.0 License.
Ocean Science Discussions
This discussion paper is/has been under review for the journal Ocean Science (OS). Please refer to the corresponding final paper in OS if available.
Flow and mixing around a glacier tongue
C. L. Stevens1, C. L. Stewart1, N. J. Robinson1,2, M. J. M. Williams1, and T. G. Haskell3
1
National Institute for Water and Atmospheric Research (NIWA), Greta Point Wellington, New Zealand
2
Department of Marine Science, University of Otago, Dunedin, New Zealand
3
Industrial Research Ltd. (IRL), Gracefield Lower Hutt, New Zealand
Received: 2 August 2010 – Accepted: 3 August 2010 – Published: 11 August 2010
Correspondence to: C. L. Stevens ([email protected])
OSD
7, 1439–1467, 2010Flow and mixing around a glacier
tongue
C. L. Stevens et al.
Title Page
Abstract Introduction
Conclusions References
Tables Figures
◭ ◮
◭ ◮
Back Close
Full Screen / Esc
Printer-friendly Version Interactive Discussion
Discussion
P
a
per
|
Dis
cussion
P
a
per
|
Discussion
P
a
per
|
Discussio
n
P
a
per
|
Abstract
A glacier tongue floating in the coastal ocean presents a significant obstacle to the lo-cal flow and influences oceanic mixing and transport processes. Here ocean shear microstructure observations at a glacier tongue side-wall show tidally-induced flow pulses and vortices as well as concomitant mixing. Flow speeds within the pulses
5
reached around three times that of the ambient tidal flow amplitude and generated ver-tical velocity shear as large as 3×10⁻³s−1. During the maximum flow period turbulent
energy dissipation rates reached a maximum of 10−5m2s−3, around three decades
greater than local background levels. This is in keeping with estimates of the gradient Richardson Number which dropped to around unity. Associated vertical diffusivities
10
are higher that expected from parameterization, possibly reflecting the proximity of the cryotopography.
1 Introduction
Quantifying ice–ocean interaction, especially at the small-scale, is proving to be a major challenge in high-latitude earth system sciences (e.g., Sirevaag et al., 2010) where
15
relatively long timescales and complex thermohaline and pressure effects interact with cryogenic topography that is continually changing. Oceanic mixing in polar waters has some differences in drivers and manifestations that at lower latitudes. For example, rotational effects are large, there is little dynamic influence due to temperature, but the effect of being close to the freezing temperature has a controlling influence on
20
behaviour and there are the additional frictional boundary effects of the frozen upper surface (McPhee, 2008).
Glacier (or ice) tongues, formed by glacier outflows into the coastal ocean, can ex-tend many tens kilometers from shore (Frezzotti et al., 1997) and be many hundreds of meters thick in places. Such cryogenic structures significantly influence local
cir-25
OSD
7, 1439–1467, 2010Flow and mixing around a glacier
tongue
C. L. Stevens et al.
Title Page
Abstract Introduction
Conclusions References
Tables Figures
◭ ◮
◭ ◮
Back Close
Full Screen / Esc
Printer-friendly Version Interactive Discussion
Discussion
P
a
per
|
Dis
cussion
P
a
per
|
Discussion
P
a
per
|
Discussio
n
P
a
per
|
around a glacier tongue, the mixing processes are then combined with the effect of flow around a bluffbody. The resulting scales of flow are not normally associated with oceanographic flows with the closest relevant work being that concerning flow around headlands and islands (e.g., Edwards et al., 2004), except of course with a glacier tongue flow can pass under the obstacle.
5
These ice–ocean interaction processes are important in a situation like southern McMurdo Sound where Haskell Strait forms an oceanic connection between the west-ern Ross Sea and the cavity beneath the combined Ross and McMurdo Ice Shelves (Fig. 1). The Sound acts as a conduit for both ice shelf waters and warmer Ross Sea waters (Robinson et al., 2010). The fate of these waters is dependent on transport and
10
mixing processes in the region. This exchange influences sea ice growth in the region, which in turn affects climate processes over large space and time scales (Hellmer, 2004; Dinniman et al., 2007; Robinson et al., 2010).
The Erebus Glacier Tongue (EGT, Fig. 1) in southern McMurdo Sound has been observed to influence local vertical stratification (Jacobs et al., 1981) through
forma-15
tion of diffusive-convective layering. It has also been suggested that such glacier/ice tongues generate local sources of supercooled water (e.g., Debenham, 1965; Jeffries and Weeks, 1992) – water cooled at depth to the in situ freezing temperature but then advected to shallower depths where it is colder than the new insitu freezing point. In the absence of nucleation centers, this supercooled water remains liquid or forms
20
frazil/platelets (e.g., Dmitrenko et al., 2010). Such properties are readily observed in the region (Gough et al., 2010; Robinson, 2010) including during the very first of such observations in 1911 (Deacon, 1975).
The EGT thus provides an ideal site to examine the degree of variability of, and in-teraction between, small-scale mixing and advective processes. Much work has been
25
OSD
7, 1439–1467, 2010Flow and mixing around a glacier
tongue
C. L. Stevens et al.
Title Page
Abstract Introduction
Conclusions References
Tables Figures
◭ ◮
◭ ◮
Back Close
Full Screen / Esc
Printer-friendly Version Interactive Discussion
Discussion
P
a
per
|
Dis
cussion
P
a
per
|
Discussion
P
a
per
|
Discussio
n
P
a
per
|
The objective here is to present new microstructure observations providing evidence of mixing rates at the tip of a glacier tongue, paying special attention to (i) water col-umn structure and kinematics, (ii) mixing, (iii) mechanisms for enhancement of local supercooling and (iv) generalization of the results beyond the EGT.
2 Methods
5
2.1 Location
In November 2009 we conducted oceanographic measurements within 30 m of the sidewall of the EGT which divides the surface waters of the majority of Erebus Bay from the Dellbridge Islands and Cape Evans (Fig. 1c). At the time of sampling the glacier tongue was 12 km long, 2.5 km wide and 300 m thick at the grounding line, and
10
with a basal slope of around 0.02 along its main axis, and the tip is around 50 m thick (Debenham, 1965; Holdsworth, 1982; DeLisle et al., 1989). Water depths near its tip are around 400 m (Jacobs et al., 1981) but highly variable due to the geology of the region including likely moraine deposits (Fig. 1d). At the time of writing the most recent calving of the EGT was in March of 1990 when a 3.5 km section broke away. Similar
15
events were known to have occurred in 1911 and at some point during the 1940s (Robinson and Haskell, 1990).
Available data on near-surface residual circulation are sparse but suggest a predom-inant northward current near the south of Erebus Bay (Fig. 1c), at least during winter (Leonard et al., 2006; Robinson, 2010; Mahoney et al., 2010). Tidal flows some 5 km
20
to the SW of the EGT reached amplitudes of around 0.15 m s−1(Stevens et al., 2006).
2.2 Instrumentation
OSD
7, 1439–1467, 2010Flow and mixing around a glacier
tongue
C. L. Stevens et al.
Title Page
Abstract Introduction
Conclusions References
Tables Figures
◭ ◮
◭ ◮
Back Close
Full Screen / Esc
Printer-friendly Version Interactive Discussion
Discussion
P
a
per
|
Dis
cussion
P
a
per
|
Discussion
P
a
per
|
Discussio
n
P
a
per
|
1 km shoreward from the tip on the north side of the EGT (Fig. 1d). The ADCP was held just beneath the sea ice (i.e. 2.5 m) with the first measurements starting 4 m below this. The sampling recorded 2 m thick velocity bins every 5 min. Good quality data was typ-ically resolved down to depths of 120 m. This is quite good penetration for this type of instrument in these waters where we have had far shallower penetration due to lack of
5
suitable scatterers (Leonard et al., 2006; Stevens et al., 2006). A magnetic declination offset of 146 degrees was included. Compass testing did not indicate any inconsisten-cies due to the near-vertical magnetic field. Tidal elevation data were recorded at Scott Base near Cape Armitage, 17 km to the south.
Turbulence properties were resolved with a Rockland VMP500 microstructure
loose-10
tethered free-fall profiler with dual shear sensors (Macoun and Lueck, 2004) with the key property being the turbulent energy dissipation rateε (units of m2s−3 equivalent
to W kg−1). Thirty eight profiles were recorded with a total profiled distance of over
11 km. The profiles penetrated to around 300 m depth, although only the upper 120 m are considered here as the focus is on the EGT effect and the comparison with the
15
ADCP. Energy dissipation rates (ε) were resolved from the dual shear probe profiler (Prandke, 2005; Roget et al., 2006) and the data revealed a noise floor in terms ofε of around 3×10⁻¹⁰m2s−3. In addition, a SBE (Seabird Electronics, USA) temperature
and conductivity sensor pair were mounted on the VMP500. These sensors are un-pumped so as to not affect the shear data through the creation of spurious vibrations,
20
so the spatial resolution is around 1 m. The profiler was kept in the water continuously so that it was at the ambient temperature removing thermal inertia start-up effects. The turbulence data do not have a continuous temporal coverage due to operational constraints and so there were a number of gaps in the profiling, most notably a 2.5 h gap, fortunately during a period of slower flow.
25
OSD
7, 1439–1467, 2010Flow and mixing around a glacier
tongue
C. L. Stevens et al.
Title Page
Abstract Introduction
Conclusions References
Tables Figures
◭ ◮
◭ ◮
Back Close
Full Screen / Esc
Printer-friendly Version Interactive Discussion
Discussion
P
a
per
|
Dis
cussion
P
a
per
|
Discussion
P
a
per
|
Discussio
n
P
a
per
|
these displacements resolves overturning scales described by the Thorpe overturn lengthscaleLT (Roget et al., 2006).
3 Observations
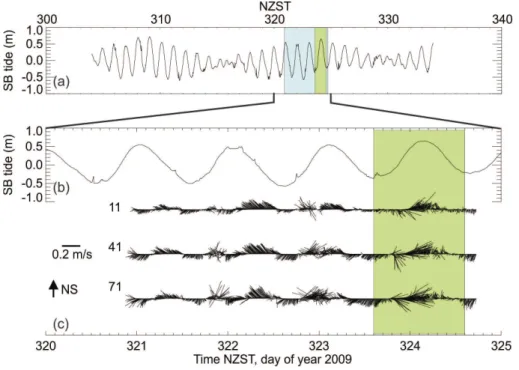
The largely diurnal tides in the region are around 1 m in peak-peak elevation (Goring and Pyne, 2003) with a 14 day “spring-neap” cycle (Fig. 2a). While these tides
typi-5
cally generate maximum flows of 15 cm s−1in the Sound-proper (Leonard et al., 2006;
Stevens et al., 2006; Robinson, 2010), here we saw flow magnitudes reach 40 cm s−1
(Fig. 2c). The currents appear cyclical (Fig. 2c) but careful examination reveals the faster flows in each cycle were not phase-locked to the tide. The short duration of the dataset precluded any co-spectral analysis. The weak South-east flow at the low tide
10
was the most consistent feature. The faster flow on the rising/high tide was more vari-able especially in its direction. The strongest flow was quite short in duration in each tidal period and so we refer to it here as a pulse, in an otherwise moderately quiescent water column.
A diurnal cycle of concurrent turbulence and ADCP data (day of year 323.6–324.6;
15
i.e. 20–21 November 2009) is the focus here (Fig. 3) – coincidentally this was the di-urnal period during which the strongest measured pulse-like flow occurred (Fig. 2). The pulse was located on the rising phase of the tide and, at the observation point at least, this was seen as flow acceleration initially at depths >40 m at which time shallower flows were towards the EGT suggesting a wake recirculation in the
verti-20
cal. The pulse then deepened to fill the entire measured depth before decaying. The main body of the pulse lasted around 4 h. It was followed by some wave-like “ringing” (using an acoustic analogy) whereby there were moderate flow accelerations for short periods spaced a little over an hour apart. Directionally the pulse, including its trailing ringing, moved mainly eastward. The flow preceding the pulse was directed around
25
OSD
7, 1439–1467, 2010Flow and mixing around a glacier
tongue
C. L. Stevens et al.
Title Page
Abstract Introduction
Conclusions References
Tables Figures
◭ ◮
◭ ◮
Back Close
Full Screen / Esc
Printer-friendly Version Interactive Discussion
Discussion
P
a
per
|
Dis
cussion
P
a
per
|
Discussion
P
a
per
|
Discussio
n
P
a
per
|
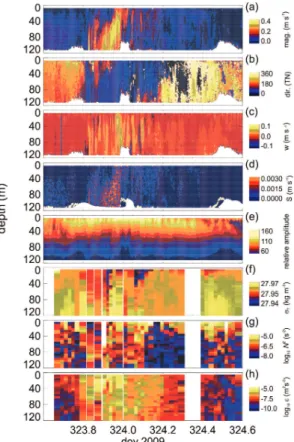
proportion of the tidal amplitude observed at locations away from the coast (Leonard et al., 2006; Stevens et al., 2006; Robinson, 2010). These horizontal pulse flows were accompanied by relatively strong vertical flows that reached up to 10 cm s−1(Fig. 3b).
The main body of the pulse generated upwards flow at the sampling position. However, the post-pulse ringing contained both up and down flows.
5
Backscatter amplitude variations as seen here (Fig. 3e) often provide a qualitative picture of a tracer field (Leonard et al., 2006; Stevens et al., 2006). It is a difficult property to interpret as it is an integral whereby the value at a given depth is a func-tion of the water column through which the acoustic beams must pass twice. Hence, a low acoustic backscatter at say 80 m might indicate few reflectors at that depth or
10
a high degree of flow attenuation above the sample volume. There were three periods in the 24 h when the backscatter was reduced sufficiently enough to affect the velocity signal to noise ratio adversely so that the deepest depth of good quality data would shoal. These reductions were pre- and post-pulse, as well as a sustained period oc-curring 12 h after the pulse. This might be a diurnal cycle in scattering due to biological
15
modulation as, despite the 24 h daylight, a variation in signal can persist in the region (A. Mahoney, personal communication; Leonard et al., 2010). Our sampling coincided with a period when the pulse was essentially around midnight local time so it was co-located temporally with what should be biologically-induced maximum penetration. Furthermore, this diurnal variation was not nearly as strongly apparent on other days.
20
Thus, the drop in backscatter may have been a response entirely to the stronger flow. Curiously, at the very end of the data shown in Fig. 3e there was a period when there was a local minimum in backscatter between 20 and 40 m depth. This effect was not seen in earlier measured tidal periods when the flow was weaker.
Velocity shearS was resolved from the vertical derivative of horizontal velocity
com-25
ponentsuandv (east-west and north-south, respectively) so that
S=
" ∂u
∂z 2
+
∂v
∂z
OSD
7, 1439–1467, 2010Flow and mixing around a glacier
tongue
C. L. Stevens et al.
Title Page
Abstract Introduction
Conclusions References
Tables Figures
◭ ◮
◭ ◮
Back Close
Full Screen / Esc
Printer-friendly Version Interactive Discussion
Discussion
P
a
per
|
Dis
cussion
P
a
per
|
Discussion
P
a
per
|
Discussio
n
P
a
per
|
This was typically in the order of 5×10⁻⁴s−1, although during the main pulse flow it
reached six times this value i.e. 3×10⁻³s−1 (Fig. 3d). At the same time, the
stratifi-cation (Fig. 3f) persisted during the strongest section of the pulse flow. The buoyancy frequency squared is calculated from the vertical derivative of density∂ρ/∂zso that
N2= g
ρ0
∂ρ ∂z
5
whereρ0 is a reference (background) density andg is gravitational acceleration.This was greatest during and just after the pulse flow (Fig. 3f) when lighter fluid appeared in the upper 40 m of the water column and N2 reached 10−5(rad s−1)2. During the
period after the pulse and ringingN2was at detectable limits of around 10−8(rad s−1)2.
These values bracket other observations in the Sound (Stevens et al., 2009) where
10
3×10⁻⁶(rad s−1)2 was observed around the topography of the ridge running offCape
Armitage.
The turbulent energy dissipation rateεreached a maximum of 10−5m2s−3(Fig. 3h).
Such high dissipation rates were mostly confined to the upper 40 m of the measured water column for a period of around four hours. The ringing was aliased in the profiling
15
so that any elevated εassociated with these brief accelerations was not necessarily captured. After the ringing had finished theεdropped to levels around 10−7m2s−3and
then, after the final backscatter minimum (time 324.5; midday 21 November 2009), it fell to the noise floor of the instrument at a little above 10−10m2s−3.
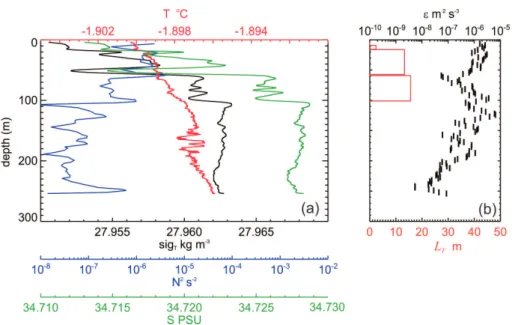
A single example microstructure profile (Fig. 4) from around the time of maximum
20
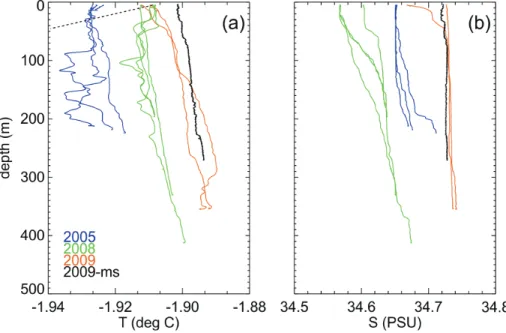
dissipation rate (time=323.95) showed that the temperature was around 0.1◦C above
freezing and so supercooling was not apparent or indeed likely. However, evidence from other years suggests this is not the case every year (Fig. 6) and certainly at other times of the year there is much more substantial variation in temperature in the ambient fluid (Mahoney et al., 2010). The microstructure example of Fig. 4 was chosen
25
OSD
7, 1439–1467, 2010Flow and mixing around a glacier
tongue
C. L. Stevens et al.
Title Page
Abstract Introduction
Conclusions References
Tables Figures
◭ ◮
◭ ◮
Back Close
Full Screen / Esc
Printer-friendly Version Interactive Discussion
Discussion
P
a
per
|
Dis
cussion
P
a
per
|
Discussion
P
a
per
|
Discussio
n
P
a
per
|
50 and 100 m. The salinity (and hence density, as it follows salinity very closely at such temperatures) exhibited an unusual local minimum at 50 m. Potentially this was surface or near-wall fluid swept to the base of the EGT by vortices. This generates some large scale structure in the Thorpe overturning scaleLT in the upper part of the water column. However, as the profile do not go all the way to the bed, deeper values
5
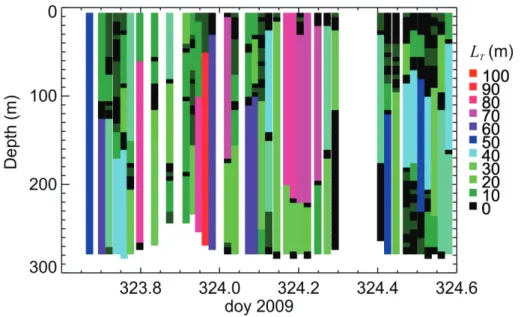
of this measure are possible so that this is a lower bound as there is a large-scale overturn that results in the heaviest water in the partial profile being located at a depth of 108 m. Considering theLTdistribution over the entire experiment (Fig. 5), the deeper large overturn is seen to be the largest recorded. The pulse was preceded by a strong overturn of around 70 m (at time 323.8). During the pulse and ringing period the upper
10
water column consisted mainly of overturns in the 0–20 m range as seen in the Fig. 4 example. After the ringing had ceased (324.2), there was a relatively large period of 70 m overturns which then fell away to 40 m or less.
4 Discussion
4.1 Kinematics and water column structure
15
One na¨ıve expectation that was dispelled by the observations was that the local max-imum depth of the EGT would be consistently clear in the data, either through a step in stratification or a strongly consistent velocity shear feature. That these were not apparent is probably indicative of the fact that the underside of the glacier tongue is not level either along, or across, its main longitudinal axis (Holdsworth, 1982). Even
20
the relatively weak local stratification will retard vertical flows, so that the influence of the glacier tongue closer to the grounding line might still have a strong influence at the observation position thus spreading the depth of the effect on properties.
In the case of the EGT flow, the so-called ringing was comprised of accelerations around 70 min apart. Presumably, this marks either a wave or vortex process as the
25
OSD
7, 1439–1467, 2010Flow and mixing around a glacier
tongue
C. L. Stevens et al.
Title Page
Abstract Introduction
Conclusions References
Tables Figures
◭ ◮
◭ ◮
Back Close
Full Screen / Esc
Printer-friendly Version Interactive Discussion
Discussion
P
a
per
|
Dis
cussion
P
a
per
|
Discussion
P
a
per
|
Discussio
n
P
a
per
|
of local seiche across to Tent Island, being too slow and too fast for barotropic and baroclinic waves, respectively (see Albrecht et al., 2006 for a description of baroclinic timescale in the region). Of course, the waves could be associated with a different boundary.
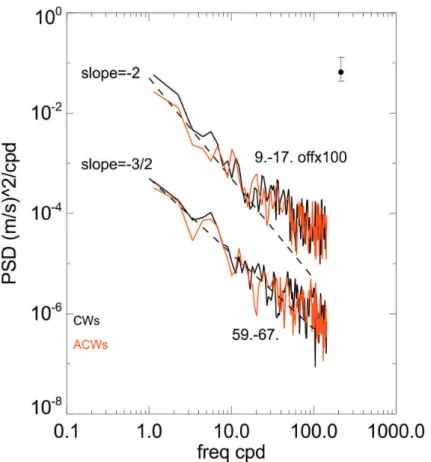
There is some evidence for the ringing response being associated with shed
vor-5
ticies. Certainly the LT at this time was comparable to the local depth of the EGT (Fig. 5). Consideration of rotational velocity spectra both near the surface and deeper (Fig. 7) do not yield any strong differences associated with direction of rotation except for (i) a weak emphasis on clockwise motion at lower frequencies and (ii) a signifi-cant difference at around 20 cpd. This latter difference might be associated with the
10
“ringing” timescale seen in the ADCP data (Fig. 3). When comparing spectra from the two depths, the only obvious difference is the different slopes in the 1–24 cpd bands, with the deeper data exhibiting a shallower slope. This suggests there is greater en-ergy finding a pathway through the internal wave spectrum beneath the tongue. This is entirely feasible as (i) the fast ice boundary potentially generates a more
homoge-15
nous surface layer less able to support internal waves and (ii) internal waves persist at depths other than that at which the obstacle exists (e.g. mountain lees waves).
The Strouhal number St=f L/u (f is shedding frequency, L is lengthscale and u is velocity) is in the range 0.03–0.3 (assuming f=2×10⁻⁴s−1, L=50–500 m and
u=0.3 m s−1). This intermediate flow regime suggests variable flow with buildup and
20
release of vorticies (Sobey, 1982). Thus, on the inward flood tide into the Dellbridge Islands embayment, vorticies are likely shed offthe tip of the EGT as supported by the clockwise spectral energy. Headland studies (Edwards et al., 2004) have demonstrated the effectiveness of spatial mapping of currents. However, such mapping is difficult in the presence of fast ice requiring autonomous vehicle technology (e.g., Hayes and
25
Morison, 2002).
OSD
7, 1439–1467, 2010Flow and mixing around a glacier
tongue
C. L. Stevens et al.
Title Page
Abstract Introduction
Conclusions References
Tables Figures
◭ ◮
◭ ◮
Back Close
Full Screen / Esc
Printer-friendly Version Interactive Discussion
Discussion
P
a
per
|
Dis
cussion
P
a
per
|
Discussion
P
a
per
|
Discussio
n
P
a
per
|
1981). Whilst the present study was initially motivated by the search for diffusive con-vection as observed in the Jacobs study, it is beyond the scope of the present work to compare the magnitudes of shear-induced and diffusion-induced mixing as we have no complementary observations of the latter situation. It seems highly likely that the pulse feature would sweep away layering structure generated by double diffusion.
How-5
ever, the pulse is transient and so for the majority of the time conditions were relatively quiescent and thus conducive to the accumulation of meltwater. Hence, further explo-ration of the melting processes needs to incorporate temporal variation in the ambient conditions at timescales far less than a tidal period.
4.2 Mixing rates
10
The energy dissipation rate (ε) rose – albeit for localized moments in time and pre-sumably space – as much as three orders of magnitude above what might be regarded as normal background levels. Edwards et al. (2004) noted how local turbulent buoy-ancy flux scaled withεand that it is likely maximum very close to a headland. Present modeling (Dinniman et al., 2007; Reddy et al., 2010) that encompasses the region
15
is at a scale that is unlikely to be instantaneously influenced even by this degree of variability. However, as seen in benthic observations to the north of McMurdo Sound (Muench et al., 2009), over long timescales the continual focus of high energy dissi-pation rates and concomitant enhance diffusivities suggest that such processes and scales are important. Intermediate scales of regional modeling would elucidate this
20
influence.
In order to parameterize the likelihood of instability and mixing, the gradient Richard-son Number,
Rigr=N
2
S2,
a measure of shear-induced instability whereby values substantially less than unity are
25
OSD
7, 1439–1467, 2010Flow and mixing around a glacier
tongue
C. L. Stevens et al.
Title Page
Abstract Introduction
Conclusions References
Tables Figures
◭ ◮
◭ ◮
Back Close
Full Screen / Esc
Printer-friendly Version Interactive Discussion
Discussion
P
a
per
|
Dis
cussion
P
a
per
|
Discussion
P
a
per
|
Discussio
n
P
a
per
|
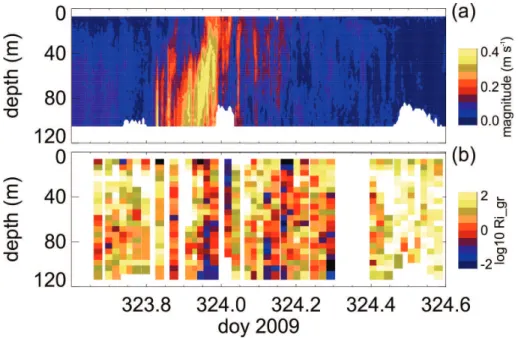
intermittent as it is the ratio of two derivative properties so that noise and uncertainty is amplified. However, the depth-time distribution ofRigr does have some consistent structure (Fig. 8) so that in the core of the pulseRigr<1, implying mixing due to shear is likely and this was borne out by the dissipation rate observations. At times away from the pulse feature, stratification persisted more strongly so thatN2=10−5(rad s−1)2and
5
background shear was more like S2=3×10⁻⁸s−2. Under these conditions Rigr=100,
implying mixing was unlikely.
Efforts continue to determine the functionality of vertical mixing in response to the balance captured in Eq. (1) (e.g., Zaron and Moum, 2009). Fer (2006) suggests modi-fication of the Pacanowski and Philander (1981) formulations for vertical diffusivities of
10
momentum and buoyancy (Km andKρ). These modifications, based on observations in an Arctic Fiord and so likely relevant here, are given as
Km= 5.5×10
−3
(1+5Rigr)2+Km0
Kρ=
Km
(1+5Rigr)+Kρ0
where background levels are given by Km0=1.3×10⁻³m2s−1 and
15
Kρ0=1.3×10− 4
m2s−1. There are trends between the estimate of the Ri
gr and
the measured dissipation and inferred vertical diffusivity Kρ (Fig. 9). The diffusivity is somewhat higher than the model determined by Fer (2006) – especially in theRigr=1– 10 band. There is an important point here though. TheKρ estimates presented here use the Shih et al., 2005 estimate for Kρ which are, like the comparison made in
20
Stevens et al. (2009), somewhat higher than the Osborne method for estimating Kρ. However, the Fer (2006) model uses the Osborn model which it notes is an upper bound (see Zaron and Moum, 2009). The discrepancy possibly lies in the likely small scales in forcing. The observed N2 may not be particularly representative of the conditions that spawned the mixing. It is useful to consider the relationship between
OSD
7, 1439–1467, 2010Flow and mixing around a glacier
tongue
C. L. Stevens et al.
Title Page
Abstract Introduction
Conclusions References
Tables Figures
◭ ◮
◭ ◮
Back Close
Full Screen / Esc
Printer-friendly Version Interactive Discussion
Discussion
P
a
per
|
Dis
cussion
P
a
per
|
Discussion
P
a
per
|
Discussio
n
P
a
per
|
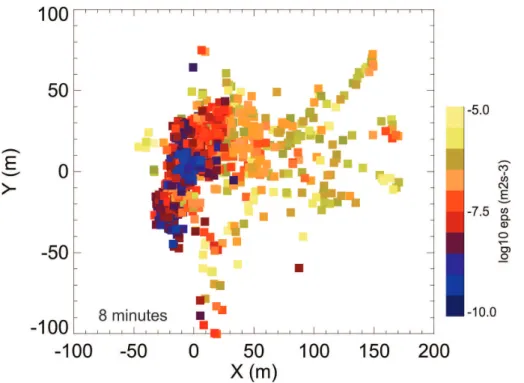
displacement and energy dissipation. Assuming a timescale of 8 min associated with anN2 of 2×10⁻⁴(rad s−1)2 then placing dissipation rate estimates on a displacement
diagram it is clear that the eastward flowing periods generated the strongest dissipation rates and the scales of the “action at a distance” were comparable with the distance to the tip of the glacier tongue. Thus, the observations downstream might be the result
5
of direct flow-obstacle interaction. 4.3 Local supercooling
A number of authors have inferred that glacier/ice tongues might be generators of su-percooled water (Debenham, 1965; Jeffries and Weeks, 1992). Such conditions arise when seawater in contact with ice at depth is cooled to the in situ freezing point. If, at
10
some later time it rises in the water column, the increase in local freezing temperature may result in the fluid actually being colder than this temperature. This substantially increases it’s propensity to freeze. While this is unlikely in the particular relatively warm period observed here, there have been previous times even at the same time of year when it has been possible as shown in CTD data of Fig. 6. Thus, the presently
ob-15
served kinematics are relevant to the supercooling problem. The ADCP data do show a weak upward flow for most of the time. Furthermore, as the post-pulse “ringing” has a half-period timescale of 35 min and a vertical speed of around 0.05 m s−1 then
the individual events might be expected to advect water around 100 m vertically in this time.
20
Platelet growth rates are very difficult to quantify as they inherently depend on their initial conditions and observations have difficulty in separating advection versus actual growth. However, Leonard et al. (2006) observed 30 cm cylinders of platelets growing on near-surface lines after periods as short as three days. Consequently if, as in the EGT situation, water advected up from beneath the tongue were immediately returned
25
OSD
7, 1439–1467, 2010Flow and mixing around a glacier
tongue
C. L. Stevens et al.
Title Page
Abstract Introduction
Conclusions References
Tables Figures
◭ ◮
◭ ◮
Back Close
Full Screen / Esc
Printer-friendly Version Interactive Discussion
Discussion
P
a
per
|
Dis
cussion
P
a
per
|
Discussion
P
a
per
|
Discussio
n
P
a
per
|
so highly influential if the local water is very cold. Similar temporally variable generation possibilities exist in the internal waves observed at Cape Armitage 17 km to the south of the EGT (Robinson, 2010).
4.4 Generalization
Sharp headlands strongly influence local flow through rectification of tides (e.g.,
Ed-5
wards et al., 2004). Although the EGT’s finger-like morphology is at the extreme end of the headland aspect ratio scale and glacier tongues are located at the surface rather than the bed we expect there is much in common in terms of oceanic response to tidal flow. The headland work of Edwards et al. (2004) identified the split between skin and form drag and that the majority of the diapycnal turbulent buoyancy flux occurred close
10
by the headland.
The EGT has quite a large aspect ratio (length/width) when compared to the Drygal-ski Ice Tongue (and the Mertz and Ninnis Glacier Tongues prior to their recent break ups). At the same time, the EGT is smaller in absolute scale by a factor of ten from these giant glacier tongues. Possibly the EGT is atypical in that it is protected from
15
currents and waves by the Dellbridge Islands and also the generally low tidal flows in the area.
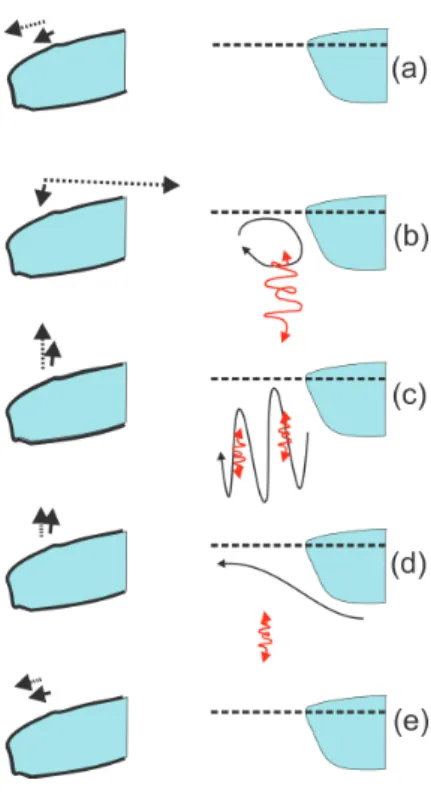
A subjective series of sketches (Fig. 11) shows the likely flow evolution around the EGT. The tidally-driven flow is highly rectified and also variable with depth and so gen-erates quite specific mixing events in time and presumably space. It would be useful to
20
translate this description to other systems.
Consequently, the relative scale of separated flow to that of the tongue is likely much larger with the EGT. However, vertical scales are greater for the big ice tongues so that vertical flows may be even stronger. Where the present data are of relevance to both the larger ice tongues and indeed ice shelf fronts is at the small scale. The
25
OSD
7, 1439–1467, 2010Flow and mixing around a glacier
tongue
C. L. Stevens et al.
Title Page
Abstract Introduction
Conclusions References
Tables Figures
◭ ◮
◭ ◮
Back Close
Full Screen / Esc
Printer-friendly Version Interactive Discussion
Discussion
P
a
per
|
Dis
cussion
P
a
per
|
Discussion
P
a
per
|
Discussio
n
P
a
per
|
Acknowledgements. The authors wish to thank Pat Langhorne, Andy Mahoney, Alex Gough, Robin Robertson and Melissa Bowen for useful discussions associated with this work. Brett Grant, St ´ephane Popinet, David Plew, Brian Stait and Peter Gerring assisted with field work. Funding and support were provided by The New Zealand Royal Society administered Marsden Fund, Antarctica New Zealand (Events K131/K132) and the New Zealand Foundation for
Re-5
search Science and Technology (Contract C01X0701). This paper is dedicated to the memory of Don Lewis.
References
Albrecht, N., Vennell, R., Williams, M., Stevens, C., Langhorne, P., Leonard, G., and Haskell, T.: Observation of sub-inertial internal tides in McMurdo Sound, Antarctica, Geophys. Res. Lett.,
10
33, L24606 doi:10.1029/2006GL027377, 2006.
Deacon, G. E. R.: The oceanographic observations of Scott’s last expedition, Polar Rec., 17, 391–419, 1975.
Debenham, F.: The glacier tongues of McMurdo Sound, Geogr. J., 131, 369–71, 1965.
DeLisle, G., Chinn, T., Karlen, W., and Winters, P.: Radio echosounding of Erebus Glacier
15
Tongue, New Zealand Antarctic Record, 9, 15–30, 1989.
Dinniman, M. S., Klinck, J. M., and Smith, Jr., W. O.: Influence of sea ice cover and icebergs on circulation and water mass formation in a numerical circulation model of the Ross Sea, Antarctica, J. Geophys. Res., 112, C11013, doi:10.1029/2006JC004036, 2007.
Dmitrenko, I. A., Wegner, C., Kassens, H., Kirillov, S. A., Krumpen, T., Heinemann, G.,
Hel-20
big, A., Schr ¨oder, D., H ¨olemann, J. A., Klagge, T., Tyshko, K. P., and Busche, T.: Observa-tions of supercooling and frazil ice formation in the Laptev Sea coastal polynya, J. Geophys. Res., 115, C05015, doi:10.1029/2009JC005798, 2010.
Edwards, K., MacCready, P., Moum, J., Pawlak, G., Klymak, J., and Perlin, A.: Form drag and mixing due to tidal flow past a sharp point, J. Phys. Oceanogr., 34, 1297–1312, 2004.
25
Emery, W. J. and Thomson, R. E.: Data Analysis Methods in Physical Oceanography, Perga-mon, 634 pp., 1997.
Fer, I.: Scaling turbulent dissipation in an Arctic fjord, Deep-Sea Res. Pt. II, 53, 77–95, 2006. Frezzotti, M.: Ice front fluctuation, iceberg calving flux and mass balance of Victoria Land
Glaciers, Antarct. Sci., 9, 61–73, 1997.
OSD
7, 1439–1467, 2010Flow and mixing around a glacier
tongue
C. L. Stevens et al.
Title Page
Abstract Introduction
Conclusions References
Tables Figures
◭ ◮
◭ ◮
Back Close
Full Screen / Esc
Printer-friendly Version Interactive Discussion
Discussion
P
a
per
|
Dis
cussion
P
a
per
|
Discussion
P
a
per
|
Discussio
n
P
a
per
|
Gough, A. J., Mahoney, A., Langhorne, P. J., Williams, M. J. M., Stevens, C. L., and Haskell, T. G.: Supercooling and seeding: oceanographic disruption of preferred crystal orientation in sea ice growing near ice shelves, IAHR Proceedings 20th IAHR International Symposium on Ice, Helsinki, 2010.
Goring, D. G. and Pyne, A.: Observations of sea-level variability in Ross Sea, Antarctica, New
5
Zeal. J. Mar. Fresh., 37, 241–249, 2003.
Hayes, D. R. and Morison, J. H.: Determining turbulent, vertical velocity, and fluxes of heat and salt with an autonomous underwater vehicle, J. Atmos. Ocean. Tech., 19, 759–779, 2002. Hellmer, H. H.: Impact of Antarctic ice shelf basal melting on sea ice and deep ocean properties,
Geophys. Res. Lett. 31, L10307, doi:10.1029/2004GL019506, 2004.
10
Holdsworth, G.: Dynamics of Erebus Glacier tongue. Ann. Glaciol., 3, 131–137, 1982.
Jacobs, S. S., Huppert, H. E., Holdsworth, G., and Drewry, D. J.: Thermohaline steps induced by melting of the Erebus Glacier Tongue, J. Geophys. Res., 86, C7, 6547–6555, 1981. Jeffries, M. O. and Weeks, W. F.: Structural characteristics and development of sea ice in the
Western Ross Sea, Antarct. Sci., 5(1), 63–75, 1992.
15
Legresy, B., Wendt, A., Tabacco, I., Remy, F., and Dietrich, R.: Influence of tides and tidal current on Mertz Glacier, Antarctica, J. Glaciol., 50, 427–435, 2004.
Leonard, G. H., Purdie, C. R. Langhorne, P. J., Haskell, T. G., Williams, M. J. M., and Frew, R. D.: Observations of platelet ice growth and oceanographic conditions during the winter of 2003 in McMurdo Sound, Antarctica, J. Geophys. Res., 111, C04012,
20
doi:10.1029/2005JC002952, 2006.
Leonard, G. H., Purdie, C. R., Langhorne, P. J., Williams, M. J. M., and Haskell, T. G.: Ice crystals in the water column: the view from an Acoustic Doppler Current Profiler (ADCP), IAHR Proceedings 20th IAHR International Symposium on Ice, Helsinki, 2010.
Macoun, P. and Lueck, R. G.: Modelling the spatial response of the air-foil shear probe using
25
different sized probes, J. Atmos. Ocean. Tech., 21, 284–297, 2004.
Mahoney, A., Gough, A., Langhorne, P., Robinson, N., Stevens, C., Williams, M., and Haskell, T.: The seasonal arrival of ice shelf water in McMurdo Sound and its effect on sea ice growth, in preparation, 2010.
McPhee, M. G.: Air-Ice-Ocean-Interaction: Turbulent Ocean Boundary Layer Exchange
Pro-30
cesses, Springer, 215 pp., 2008.
OSD
7, 1439–1467, 2010Flow and mixing around a glacier
tongue
C. L. Stevens et al.
Title Page
Abstract Introduction
Conclusions References
Tables Figures
◭ ◮
◭ ◮
Back Close
Full Screen / Esc
Printer-friendly Version Interactive Discussion
Discussion
P
a
per
|
Dis
cussion
P
a
per
|
Discussion
P
a
per
|
Discussio
n
P
a
per
|
doi:10.1029/2009GL041347, 2009.
Olbers, D. and Hellmer, H.: A box model of circulation and melting in ice shelf caverns, Ocean Dynam., 60, 141–153, doi:10.1007/s10236-009-0252-z, 2010.
Pacanowski, R. C. and Philander, S. G. H.: Parameterization of vertical mixing in numerical models of tropical oceans, J. Phys. Oceanogr., 11, 1443–1451, 1981.
5
Prandke, H.: Microstructure sensors, in: Marine Turbulence: Theories, Observations and Mod-els, edited by: Baumert, H. Z., Simpson, J. H., and Sundermann, J., Cambridge Univ. Press, 101–109, 2005.
Reddy, T. E., Holland, D. M., and Arrigo, K. R.: Ross ice shelf cavity circulation, residence time, and melting: results from a model of oceanic chlorofluorocarbons, Cont. Shelf Res.,
10
30, 733–742, doi:10.1016/j.csr.2010.01.007, 2010.
Rignot, E., Koppes, M., and Velicogna, I.: Rapid submarine melting of the calving faces of West Greenland Glaciers, Nat. Geosci., 3, 187–191, doi:10.1038/ngeo765, 2010.
Robinson, W. and Haskell, T. G.: Calving of Erebus Glacier tongue, Nature 346, 615–616. 1990.
15
Robinson, N. J., Williams, M. J. M., Barrett, P. J., and Pyne, A. R.: Observations of flow and ice–ocean interaction beneath the McMurdo Ice Shelf, Antarctica, J. Geophys. Res., 115, C03025, doi:10.1029/2008JC005255, 2010.
Robinson N. J.: The ocean boundary layer beneath Antarctic Sea ice in the vicinity of an ice shelf, Ph.D. Thesis, Univ. Otago, 2010.
20
Roget, E., Lozovatsky, I., Sanchez, X., and Figueroa, M.: Microstructure measurements in natural waters: methodology and applications, Progr. Oceanogr., 70, 126–148, 2006. Shih, L. H., Koseff, J. R., Ivey, G. N., and Ferziger, J. H.: Parameterization of turbulent fluxes and
scales using homogeneous sheared stably stratified turbulence simulations, J. Fluid Mech., 525, 193–214, 2005.
25
Sirevaag, A., McPhee, M. G., Morison, J. H., Shaw, W. J., and Stanton, T. P.: Wintertime mixed layer measurements at Maud Rise, Weddell Sea, J. Geophys. Res., 115, C02009, doi:10.1029/2008JC005141, 2010.
Squire, V. A., Robinson, W. H., Meylan, M., and Haskell, T. G.: Observations of flexural waves on the Erebus Ice Tongue, McMurdo Sound, Antarctica, and nearby sea ice, J. Glaciol., 40,
30
377–385, 1994.
OSD
7, 1439–1467, 2010Flow and mixing around a glacier
tongue
C. L. Stevens et al.
Title Page
Abstract Introduction
Conclusions References
Tables Figures
◭ ◮
◭ ◮
Back Close
Full Screen / Esc
Printer-friendly Version Interactive Discussion
Discussion
P
a
per
|
Dis
cussion
P
a
per
|
Discussion
P
a
per
|
Discussio
n
P
a
per
|
Stevens, C. L., Robinson, N. J., Williams, M. J. M., and Haskell, T. G.: Observations of tur-bulence beneath sea ice in southern McMurdo Sound, Antarctica, Ocean Sci., 5, 435–445, doi:10.5194/os-5-435-2009, 2009.
Stevens, C. L., Williams, M. J. M., Robinson, N. J., Albrecht, N., and Haskell, T. G.: Observa-tions of the stratified turbulent boundary-layer and platelet ice beneath McMurdo Sound Sea
5
Ice, Proc. Sixth International Symposium on Stratified Flows, edited by: Ivey, G. N., Perth, Australia, 2006.
OSD
7, 1439–1467, 2010Flow and mixing around a glacier
tongue
C. L. Stevens et al.
Title Page
Abstract Introduction
Conclusions References
Tables Figures
◭ ◮
◭ ◮
Back Close
Full Screen / Esc
Printer-friendly Version Interactive Discussion
Discussion
P
a
per
|
Dis
cussion
P
a
per
|
Discussion
P
a
per
|
Discussio
n
P
a
per
|
Fig. 3. ADCP and turbulence data products. The ADCP resolved(a)horizontal velocity mag-nitude,(b) horizontal direction in which the flow is going, (c) vertical velocityw, (d) vertical shear and(e) backscatter amplitude. The VMP turbulence profiler resolved(f)density as σt,
OSD
7, 1439–1467, 2010Flow and mixing around a glacier
tongue
C. L. Stevens et al.
Title Page
Abstract Introduction
Conclusions References
Tables Figures
◭ ◮
◭ ◮
Back Close
Full Screen / Esc
Printer-friendly Version Interactive Discussion
Discussion
P
a
per
|
Dis
cussion
P
a
per
|
Discussion
P
a
per
|
Discussio
n
P
a
per
|
Fig. 6. (a) Temperature and(b) salinity profile data collected with Seabird Electronics 19+
OSD
7, 1439–1467, 2010Flow and mixing around a glacier
tongue
C. L. Stevens et al.
Title Page
Abstract Introduction
Conclusions References
Tables Figures
◭ ◮
◭ ◮
Back Close
Full Screen / Esc
Printer-friendly Version Interactive Discussion
Discussion
P
a
per
|
Dis
cussion
P
a
per
|
Discussion
P
a
per
|
Discussio
n
P
a
per
|
Fig. 9. (a)Dissipation rate as a function ofRigrshowing individual estimates (hollow squares),
bin-log-space-averaged (solid squares) and bars showing standard deviation of estimates for 0.15log(Rigr) spaced bins.(b)The same plot format for the diffusivityKρestimate and including
OSD
7, 1439–1467, 2010Flow and mixing around a glacier
tongue
C. L. Stevens et al.
Title Page
Abstract Introduction
Conclusions References
Tables Figures
◭ ◮
◭ ◮
Back Close
Full Screen / Esc
Printer-friendly Version Interactive Discussion
Discussion
P
a
per
|
Dis
cussion
P
a
per
|
Discussion
P
a
per
|
Discussio
n
P
a
per
|