www.atmos-chem-phys.net/9/5057/2009/ © Author(s) 2009. This work is distributed under the Creative Commons Attribution 3.0 License.
Chemistry
and Physics
Modelling chemistry over the Dead Sea: bromine and
ozone chemistry
L. Smoydzin1,*and R. von Glasow1
1School of Environmental Sciences, University of East Anglia, Norwich, UK
*now at: Max-Planck-Institute for Chemistry, Department of Atmospheric Chemistry, P. O. Box 3060, 55020 Mainz, Germany Received: 22 December 2008 – Published in Atmos. Chem. Phys. Discuss.: 23 February 2009
Revised: 29 June 2009 – Accepted: 23 July 2009 – Published: 28 July 2009
Abstract.Measurements of O3and BrO concentrations over the Dead Sea indicate that Ozone Depletion Events (ODEs), widely known to happen in polar regions, are also occuring over the Dead Sea due to the very high bromine content of the Dead Sea water. However, we show that BrO and O3levels as they are detected cannot solely be explained by high Br−
levels in the Dead Sea water and the release of gas phase halogen species out of sea borne aerosol particles and their conversion to reactive halogen species. It is likely that other sources for reactive halogen compounds are needed to plain the observed concentrations for BrO and O3. To ex-plain the chemical mechanism taking place over the Dead Sea leading to BrO levels of several pmol/mol we used the one-dimensional model MISTRA which calculates micro-physics, meteorology, gas and aerosol phase chemistry. We performed pseudo Lagrangian studies by letting the model column first move over the desert which surrounds the Dead Sea region and then let it move over the Dead Sea itself. To include an additional source for gas phase halogen com-pounds, gas exchange between the Dead Sea water and the atmosphere is treated explicitly. Model calculations indicate that this process has to be included to explain the measure-ments.
1 Introduction
Tropospheric ozone depletion events related to highly active bromine chemistry are widely known to take place in polar
Correspondence to:L. Smoydzin ([email protected])
of up to 6 pmol/mol at the Great Salt Lake, USA. The au-thors find a decrease in O3mixing ratios simultaneously to the daily BrO peak period, however, the decrease is far lower than for the Dead Sea. Furthermore, H¨onninger et al. (2004) found up to 20 pmol/mol BrO correlated with O3 depletion events at the Salar de Uyuni in Bolivia.
2 Motivation
Our main scientific objective of this paper is to find an expla-nation for the measurements taken along the Dead Sea based on a reasonable chemistry mechanism and to reproduce the general features observed at the Dead Sea with a numerical model.
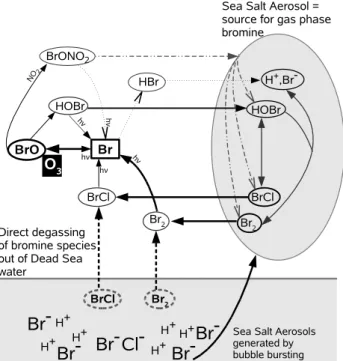
In general the most important source for gas phase halogen species in the marine troposphere are sea salt aerosols. As soon as H+ concentrations are large enough, BrCl and Br2 are formed in the aerosol and degas into the gas phase (Vogt et al., 1996; von Glasow and Crutzen, 2007). Gas phase BrCl and Br2are rapidly photolysed during the day and form Br which can react which O3and produce BrO. Bromine oxide can react further leading to the production of HOBr. Hypo-bromous acid is taken up by the aerosol where it takes part in the acid catalysed reactions forming BrCl and Br2. In ad-dition, BrO can react with NO2and produce BrONO2which participates in heterogeneous reactions on aerosol surfaces also starting the recycling of gas phase species in the aque-ous phase (see Fig. 1). It has been suggested several times that due to the very high bromide content and low pH of the Dead Sea water and thus of emitted sea salt aerosol particles the above explained process leads to extraordinary high BrO mixing ratios and the related ODEs (Tas et al., 2003, 2005, 2006). Two, very general points speak against this hypothesis (i) The wind speed over the Dead Sea is often low. Hebestreit et al. (1999) and Matveev et al. (2001) report windspeeds of 5 m/s and respectively 3 m/s which were prevailing dur-ing their measurement campaigns where high levels of BrO were observed. Consequently the number of sea salt aerosol particles that are released from the Dead Sea is low. (ii) As the relative humidity along the Dead Sea valley is often very low (e.g. Alpert et al., 1997, and references therein), aerosol phase chemistry is likely to be of minor importance. A low aerosol liquid water content which consequently has to be the case if ambient relative humidity is extremely low, leads to
H+ H+
H+
H+ H+ H+ Br2
Br
2
BrCl
Sea Salt Aerosols generated by bubble bursting
Direct degassing of bromine species out of Dead Sea water
BrCl
Br2
BrCl
Br-
Cl-
Br-Fig. 1.Simplified overview of the interacting chemistry in the
wa-ter, the gas phase and aerosol particles.
a slow mass transfer between the aerosol and the gas phase. Thus, only a very limited amount of BrCl or Br2can be re-leased out of particles as the total halogen cycling should be weak. Even though freshly emitted sea salt aerosols are deli-quescent, it is very likely that these particles dry out quickly. Furthermore, the analysis of filterable chlorine and bromine from aerosol samples presented by Matveev et al. (2001) suggests that a bromine source in addition to aerosols is needed in order to explain the observations made along the Dead Sea. As the production of BrCl and Br2 in the aerosol is pH dependant and the exchange process between the aerosol and the gas phase depends on the solubility of the species as well as their gas phase and aqueous phase concen-trations, BrCl and Br2can only degas directly out of acidified aerosols but not out of open ocean water with an average pH of about 8. However, the pH of Dead Sea water is much lower, leading to larger BrCl and Br2production rates in the water. This indicates that beside sea salt aerosols the Dead Sea water itself can be a direct source for gas phase bromine species. In order to investigate this aspect we included the air-sea exchange of bromine species explicitly in a numeri-cal model.
3 Background information about the Dead Sea
separated from the northern part by a peninsula. These very shallow basins are fed with water from the northern part of the lake by a channel. The water of the Dead Sea has a very high salinity and acidity compared to ocean water with pH values in the order of 5 (southern part) to 6 (northern part, Tas et al., 2005). Bromide as well as chloride concentrations increase significantly from the northern to the southern end of the lake (Cl−: 225–405 g/l, Br−: 6.1–11 g/l, Sirkes et al., 1997). Thus the salinity of the water is about 12 times larger than for ocean water which has an average chloride content of about 19 g/l and a bromide content of 0.065 g/l (Sverdrup et al., 1942).
The topography at the Dead Sea leads to a strongly canal-ysed wind flow through the valley. The local flow pattern, which is very complex and still insufficiently understood is also partly influenced by the lake breeze (Bitan, 1977; Tas et al., 2003). The wind direction at the North end of the lake is often southerly. The wind direction at the South end seems to be more variable and southerly as well as northerly winds are observed (Tas et al., 2003). As the Dead Sea is sur-rounded by a desert the temperature is very high with mean values of about 35◦C in summer and the relative humidity is very low with about 40–50% (Alpert et al., 1997, and refer-ences therein; J. Zingler and M. Piot, Inst. of Env. Physics, Univ. Heidelberg, Germany, personal communication, 2007).
4 Model description
For all presented model studies the one dimensional numer-ical model MISTRA is used. It contains a microphysics scheme and explicitly calculates chemistry in the gas phase, in aerosol particles and cloud droplets (von Glasow et al., 2002a,b). The chemical mechanism contains the most im-portant reactions of O, H, C, N, S, Cl and Br both in the gas phase and the aerosol phase and has been updated ac-cording to the IUPAC recommendation (April 2004, see http: //www.iupac-kinetic.ch.cam.ac.uk). In the model we distin-guish between sulphate and sea salt aerosol particles which differ by their size (r=0.005–0.5µm for sulphate, r=0.5– 15µm for sea salt) and initial chemical composition. The parameterisation of Monahan et al. (1986) for the emission of sea salt particles by bubble bursting is used. An aerosol size distribution for rural areas based on Jaenicke (1988) is used. All presented model runs are set up such that no clouds are formed.
To be able to calculate air-sea exchange between the Dead Sea and the overlying atmosphere, chemistry within the wa-ter of the lake is calculated explicitly in addition to the aerosol phase. We assume that the same reaction set which is used for aerosol phase chemistry is also valid for chem-istry taking place in the water of the Dead Sea apart from heterogeneous reactions. The only possible interactions that are allowed between the Dead Sea water and the atmosphere is via air-sea exchange of trace gases as is shown exemplarily
in Fig. 1. To describe the fluxes of gases across the air-sea in-terface a two-layer model as first presented by Liss and Slater (1974) is used. The implementation of the air-sea exchange mechanism into MISTRA follows the work done by Pozzer et al. (2006) (and references therein).
For studying the different formation mechanisms of BrO in detail it is crucial to have a high vertical model resolution. Thus a logarithmically spaced grid for the vertical has been chosen with a grid spacing of 0.5 m for the lowest grid box above the water surface.
4.1 Activation of aerosol-chemistry
Due to the extremely dry conditions along the Dead Sea it is crucial to discuss the way aerosol chemistry is trig-gered in MISTRA. Aerosol phase chemistry is always cal-culated if the ambient relative humidity is above the del-iquescence humidity of sea salt (75%) or sulphate (70%) aerosols. When humidity decreases to the crystallisation hu-midity (40% for sulphate, 42% for sea salt) calculation of aerosol phase chemistry is terminated. As it can be assumed that freshly emitted sea salt particles are always present as an aqueous solution, sea salt chemistry is always calculated in the lowest model level (over a water surface). As it is well documented that sea salt aerosol particles remain in a metastable state when the relative humidity drops below the deliquescence humidity (e.g. Tang, 1997; Pruppacher and Klett, 1997), aerosol chemistry is calculated in all model lay-ers where the relative humidity had previously exceeded the deliquescence humidity but is still higher than the crystalli-sation humidity. Calculation of aqueous phase chemistry is however, terminated if the total water mass in one aerosol size class drops below a threshold value of 10−13m3(aq)/m3(air) which is necessary in order to keep the chemistry mecha-nism numerical stable (Kerkweg et al., 2007). To re-activate aerosol phase chemistry, the ambient relative humidity has to exceed the deliquescence humidity of the particles.
5 Model setup
5.1 Lagrangian runs
To investigate bromine chemistry over the Dead Sea and related ODEs a Lagrangian-kind model setup was chosen which can be understood as follows: the model column first moves over the desert for two days and then crosses the Dead Sea from South to North. The temperature ranges from about 42◦C directly above the ground to about 22◦C at the top of
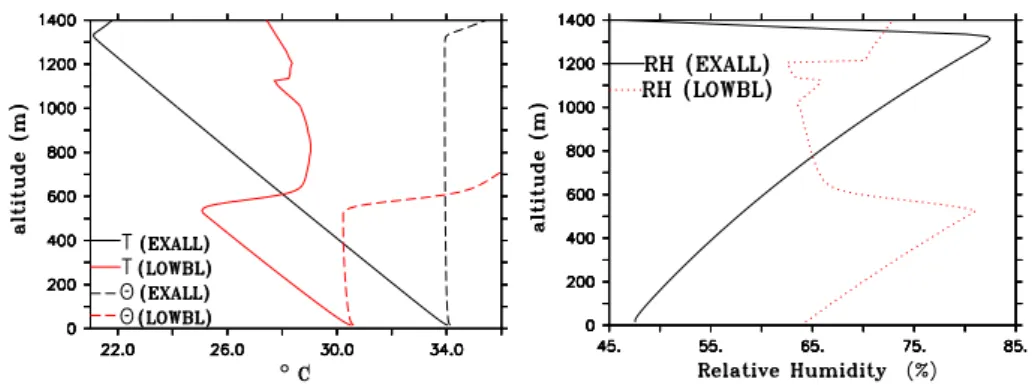
Fig. 2.The plot on the left shows the vertical gradient of the temperature (◦C, solid lines) and the potential temperature (◦C, dashed lines) at 11:30 for scenarios EXALL (black) and LOWBL (red). The plot on the right shows the vertical gradient of the relative humidity (in %) at 11:30 for scenarios EXALL (black solid line) as well as scenario LOWBL (red dashed line).
Table 1.Overview of all scenarios.
NOEX No air-sea exchange of gases is calculated
EX Air-Sea exchange of only BrCl, Br2, Cl2is calculated
EXALL The same setup as EX, but air-sea exchange of BrCl, Br2, Cl2, HOCl, HOBr, HCl, HBr is calculated
EXLIM The same setup as EXALL, but limited vertical transport for first 90 min, strong vertical mixing for rest of simulation time ENH The same setup as EXALL, but strong hot spot emissions within the first 2 h
LOWBL The same setup as EXALL, but boundary layer height only 500 m
STAT The same initial conditions as EX, but model runs for 38 h over the same site at the South end of the Dead Sea
are about 70 nmol/mol and 1 nmol/mol for NO2at the morn-ing of day two in the initialisation model run. Figure 2 shows typical vertical profiles of temperature, potential temperature and relative humidity over the Dead Sea for two scenarios which will be introduced below. The temperature inversion indicates the boundary layer height in the model.
To initialise chemistry in the Dead Sea water, a separate model run was calculated for two days prohibiting air-sea exchange in order to have a spin up. It is assumed that the model column crosses the lake from South to North. By us-ing this pseudo-Lagrangian approach, the influence of the gradient in chemical composition of the lake’s water on gas phase concentrations can be taken into account. Further-more, no unrealistic or speculative assumptions about ad-vection into the model domain have to be made. The po-tential implications of such an idealised model setup will be addressed in the discussion of the model results in Sect. 8. Based on the low wind speed reported by Hebestreit et al. (1999) and Matveev et al. (2001) we assume a horizontal wind speed of 3 m/s for our model simulations such that it would take six hours to transport an air parcel across the Dead Sea. During those six hours when the model is run over the water surface, the lower boundary conditions are changed representing the measured gradient in the acidity and salin-ity of the lake water which are factors that are assumed to be responsible for the stronger and more often occurring O3 de-pletion events over the southern part of the Dead Sea. Based on values reported by Tas et al. (2005) Br−mixing ratios in
the Dead Sea water are decreased from 0.15 mol/l (South) to 0.05 mol/l (North) and the pH of the lake is increased from 4.6 (South) to 6.4 (North). Obviously, this setup only changes the bromide content of the water and not the total salt content. Even the lowest reported Cl− concentrations for the Dead Sea water (6.34 mol/l, Tas et al., 2005) are very large compared to ocean water and sensitivity studies showed that they do not limit the extent of halogen chemistry.
An overview of the different scenarios and the abbrevia-tions of each model run is given in Table 1. In all scenarios the model column moves over the Dead Sea from 10:00 until 16:00 (all times refer to local time). The dry and hot mete-orological conditions lead to a boundary layer height that is constantly at≈1300 m if not mentioned otherwise.
We used the following Lagrangian model scenarios to sim-ulate the effect of differing ambient conditions on the trace gas concentrations over the Dead Sea:
– NOEX: air-sea exchange of gases is not explicitly cal-culated and only the “standard” gas phase and aerosol phase chemistry of the model MISTRA is taken into ac-count.
– EX: degassing of the halogen species BrCl, Br2and Cl2 out of the Dead Sea water into the atmosphere is calcu-lated explicitly.
Fig. 3. Plots(a, b)show gas phase mixing ratios at 2 m altitude for scenario NOEX. Aqueous phase concentrations in sea salt aerosols at again 2 m height for scenario NOEX are shown in(c).
explicitly. In scenarios EXLIM, ENH and LOWBL the same tracers are exchanged like in EXALL.
– EXLIM: for the first two hours of simulation time verti-cal transport is strongly limited. Such a situation might arise when hot and dry air masses that had been trans-ported over the desert start to cross the water surface which is slightly cooler than the land surface. An inver-sion which is not very intense but strong enough to limit vertical transport builds up in the lower most boundary layer. After about two hours it is broken up due to ver-tical mixing of air masses.
– ENH: fluxes of bromine species out of the Dead Sea wa-ter are increased in the first two hours of simulation time to simulate a potentially stronger bromine source. Salt pans which are mainly present in the southern part of the Dead Sea might be a strong additional bromine source. Furthermore, it is possible that the air-sea parameterisa-tion underestimates the flux of bromine species out of the very shallow and highly concentrated evaporation ponds in the South.
– LOWBL: initial meteorological conditions were cho-sen such, that the boundary layer height is constantly at about 500 m. To achieve this the temperature had to be decreased by about 3◦C compared to scenario EXALL
as can be seen in Fig. 2.
5.2 Stationary run
To investigate the daily variation of trace gas concentrations at one single point above the Dead Sea, one stationary model run (STAT) over the South end of the Dead Sea (Dead Sea water with a pH of 4.8 and[Br−]=0.15 mol/l) was performed. The model run was initialised with the same fields for meteo-rology and chemistry as the Lagrangian studies, but the com-position of the water as well as the comcom-position of freshly emitted sea salt particles is not changed during the 38 h of simulation time. The model run starts at the same time as the Lagrangian runs (10:00) and all presented plots show mixing ratios between 10:00 day 1 and 20:00 day 2.
It is rather unrealistic, that the air at one particular site at the Dead Sea stays uninfluenced by the environment. Thus advective fluxes are assumed however, only of O3 and NO2. As it is not possible to calculate advection into the model domain explicitly with a one-dimensional model, the strength of the fluxes is chosen somewhat arbi-trarily (10:00 day 1–15:00 day 2: NO2: 0.463 pmol/(mol s), O3: 0.078 pmol/(mol s); 15:00 day 2–24:00 day 2: NO2: 0.347 pmol/(mol s), O3: 6.829 pmol/(mol s). The inflow of both species into the model domain is assumed to be the same in all model levels. The assumption of an inflow in general is a strong constraint to the model. This scenario is not valid for representing accurately the conditions and daily varia-tions at one particular site at the Dead Sea. As it is our ob-jective to simulate the general (chemical) features observed at the Dead Sea this scenario is not meant to represent one specific measurement day. Anyhow, no meteorological data has been published for the measurement periods at the Dead Sea which could be used for comparison. However, scenario STAT should help to better understand the general chemical mechanism and its sensitivity to changing background con-ditions.
6 Results: Lagrangian runs
6.1 Lagrangian runs without air-sea-exchange
First we will discuss the scenario ignoring direct air-sea ex-change (NOEX). If not mentioned otherwise all line plots presented herein show mixing ratios at two metres altitude as most measurements were taken at approximately this height. Only the time period when the model column moves over the Dead Sea (from 10:00 to 16:00) is shown in all plots.
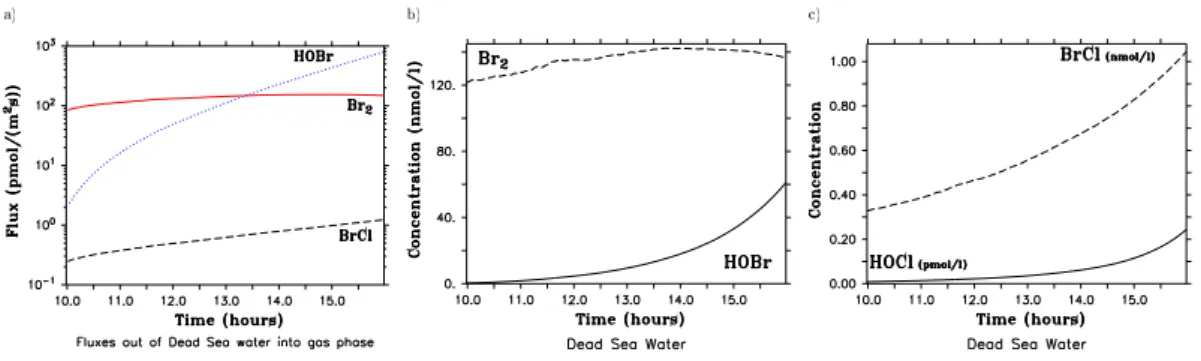
Fig. 4. The fluxes of Br2(red solid line), BrCl (black dashed line) and HOBr (blue dotted line) out of the Dead Sea water are shown(a). Plots(b)and(c)show concentrations of several bromine containing species in the Dead Sea Water. All plots refer to scenario EXALL.
Without considering degassing out of the Dead Sea water the only source for gas phase bromine species is the transfer of halogen precursor species out of sea salt aerosols. Even though sea salt aerosols over the Dead Sea contain high Br−
and Cl−concentrations (≈3 and 40 mmol/l Fig. 3c) and have
a high acidity (pH≈1, Fig. 3c), it is not possible to repro-duce the measurements with model setup NOEX. As the sea salt production is low and aerosol chemistry is only effec-tive in the lowest 2 m a.s.l. due to the low relaeffec-tive humidity (see Fig. 2), the Br2flux out of aerosol particles (6×10⁻⁷– 2.8×10⁻⁶pmol/(m3s)) is too weak to produce significant bromine levels in the gas phase. Beside the vertical limitation of bromine production, strong vertical transport is another limiting factor for the accumulation of BrO in the lowest me-tres above ground as it leads to a quick vertical mixing of the anyway low concentrated tracers all over the boundary layer. In general mixing ratios of gas phase halogen species in-crease with time (in terms of the Lagrangian model setup with travel distance), as at the south end of the Dead Sea (10:00) halogen concentrations are close to zero, and the longer halogen chemistry is active (the closer the model col-umn gets to the north end of the lake) the more the concen-trations increase. The relative increase (e.g. in BrO mixing ratios) is thus large, however, the absolute mixing ratios are very small.
Generally, the low relative humidity and thus the very low liquid water content of sea salt aerosols (11×1012m3aq/m3gas) is the reason for the slow recycling of bromine species on aerosol particles. The lower the liquid water content of an aerosol particle, the lower is the uptake rate of a gas phase species.
The production of Br2in the aerosol phase by the bromine explosion reaction is essential for the formation of signifi-cant gas phase BrO levels. However, in addition to the high acidity and salinity in the aerosol, significant HOBr levels are required. As the halogen cycling between the gas- and aerosol phase is weak, HOBr uptake into aerosols is weak leading to the relatively small HOBr concentrations within sea salt particles (≈5×10⁻⁴pmol/l). The recycling pathway via heterogeneous decomposition of BrONO2is inefficient in
our model simulations due to the limited uptake of gas phase species on aerosol particles due to the low relative humidity over the Dead Sea.
In a sensitivity test, the wind speed in scenario NOEX was increased such that it constantly exceeded 15 m/s. Even un-der these conditions BrO mixing ratios at 2 m altitude only increased up to 5 pmol/mol after six hours of simulation time. Clearly the model setup only including the interacting gas- and aerosol phase chemistry is not appropriate to sim-ulate ozone depletion events and BrO levels in the range of 100 pmol/mol. Therefore in the following air-sea exchange of halogen species is taken into account.
6.2 Lagrangian runs with air-sea-exchange
6.2.1 Air-sea exchange and water chemistry
First, the fluxes of bromine and chlorine species out of (into) the water of the Dead Sea and chemistry taking place in the Dead Sea water are discussed. Only fluxes for scenario EX-ALL are shown as the magnitude of fluxes as well as aqueous phase concentrations in the water do not differ significantly between the scenarios however, HOBr fluxes are not included in scenario EX. Figure 4a shows fluxes (in pmol/(m2s)) for Br2(red line), BrCl (black dashed line) and HOBr (blue dot-ted line) out of the Dead Sea water into the gas phase. Fluxes of all other halogen species are more than three orders of magnitude lower than the BrCl flux (which is the smallest flux shown) and are thus of minor importance and will not be discussed any further.
Concentrations of HOBr in the water rise from 0.29 nmol/l to 61 nmol/l which is an increase of two orders of magni-tude (Fig. 4b). Concentrations of Br2 in the water slightly increase in the first three hours of simulation time from about 121 nmol/l to 142 nmol/l and then decrease slightly to about 136 nmol/l (Fig. 4b). The most important reaction for activat-ing bromine chemistry is the bromine explosion mechanism (red reaction path in Fig. 5):
HOBr+Br−+H+⇋Br2 (R1)
Even though bromide concentrations and the acidity in the water are decreased with time in the model, they remain high enough such that the equilibrium reactions produce Br2 throughout the simulation time (indicated through the larger red arrow in Fig. 5 pointing at Br2). The forward reaction (of Reaction R1) is getting only slightly slower in the last two hours between 14:00 and 16:00 as Br−and H+get less
abundant with time, leading to the small decrease in Br2 con-centrations followed by a decrease in the Br2 flux. Even though Br−concentrations decrease to about a third of their
initial value after 6 h of simulation time (0.15−→0.05 mol/l), the absolute concentrations at 16:00 are still very large. Fur-thermore, HOBr concentrations increase strongly with time, which will be explained below. Thus the ratio of the forward to the backward reaction of the equilibrium Reaction (R1) even increases slightly with time, but the absolute reaction rate slightly decreases with time. This explains why the bromine explosion reaction does not get significantly slower with time and the decrease in Br2concentrations in the Dead Sea water with time is negligibly small. Additionally the increase of the pH to a value of 6.4 (thus the water is still slightly acidic) at 16:00 does not yet limit Br2formation sig-nificantly compared to a value of 5 (Fickert et al., 1999).
In contrast to Br2, HOBr concentrations increase nearly exponentially with time. Besides for the conversion of Br− into Br2, HOBr is needed to convert Cl− into BrCl (green reaction path in Fig. 5):
HOBr+Cl−+H+⇋BrCl (R2)
Due to the very high Cl− and H+ concentrations this reac-tion is very fast. Throughout the 6 h of simulareac-tion time the backward reaction of the equilibrium Reaction (R2) is faster (indicated by large green arrows in Fig. 5 pointing at HOBr and Cl−) than the forward reaction. Thus the backward
re-action is a net source for HOBr in the Dead Sea water. In contrast, within aerosol particles, the forward reaction is in general faster than the backward reaction and BrCl is net pro-duced. The explanation for the shift of the equilibria in the Dead Sea water can be found in the very high salt content and the very high and changing bromide content as well as the very low and changing pH of the Dead Sea water. Apart from Reaction R2, BrCl is produced by other pH dependent but non-equilibrium reactions within the water of which the
Fig. 5. Chemical aqueous phase equilibria. Large arrows indicate
whether the forward or backward reaction tends to dominate.
fastest two are shown in Fig. 5 (blue and grey reaction path in Fig. 5):
HOCl+Br−+H+−→BrCl (R3)
Br−+ClO−+H+−→BrCl+OH−. (R4) Thus the slow production of BrCl via Reaction (R2) is over-compensated by BrCl production via Reactions (R3 and R4). The increase of HOBr as well as of HOCl concentrations in the Dead Sea water from South to North can be seen as follows: As both H+and Br−concentrations decrease with time, less HOCl is consumed with time forming BrCl (via Reaction (R3), blue reaction path in Fig. 5). This leads to an increase of HOCl concentrations followed by a stronger net production of ClO−via the equilibrium reaction:
HOCl⇋ClO−+H+ (R5)
(black reaction path in Fig. 5) followed by a stronger pro-duction of BrCl (via Reaction (R4), grey reaction path in Fig. 5). This now leads to an increase in BrCl concentra-tions followed by a stronger conversion to HOBr (via Re-action (R2), green reRe-action path in Fig. 5). The strongly increasing HOBr concentrations in the water determine the strength of the HOBr flux into the atmosphere which exceeds the Br2flux (after 13:40) even though hypobromous acid is more soluble than Br2.
6.2.2 Gas phase chemistry
Fig. 6.Plotted are gas phase mixing ratios at 2 m altitude for scenarios EX (red dotted line), EXALL (black line) and EXLIM (blue dash-dotted line) for the six hours that the model crosses the Dead Sea. The vertical distribution of O3(shaded) and BrO (contour lines) is shown in addition for scenarios EXALL(d)and EXLIM(e). Note the logarithmic scaling of the y-axis.
as field measurements show. The difference of about 50 pmol/mol BrO between scenario EX and EXALL can be explained with the very high gas phase HOBr mixing ra-tios in scenario EXALL ([HOBr]max=0.91 nmol/mol, EX: [HOBr]max=0.14 nmol/mol) caused by the additional HOBr source due to direct degassing out of the Dead Sea water (Fig. 6b). HOBr is under the prevailing circumstances an important precursor species for gas phase bromine as it is rapidly photolysed to form Br atoms (and OH radicals) which react with O3 to produce BrO. Under less dry atmospheric conditions, HOBr is taken up into sea salt aerosols quickly due to its high solubility. However, as the liquid water con-tent of aerosol particles is very low, the uptake of gas phase species in aerosol particles is not efficient. As the source of HOBr due to degassing out of the Dead Sea water is large, a significant fraction of HOBr gets photolysed and provides an efficient source for Br atoms.
The steadily and strongly increasing BrO mixing ratios in scenario EXALL and EX are caused by the constantly strong fluxes of bromine species out of the water. The most impor-tant source reaction of bromine atoms is photolysis of molec-ular bromine. Even though gas phase Br2gets quickly pho-tolysed to Br (by Reaction R6):
Br2+hν−→2Br (R6)
Br+O3−→BrO+O2 (R7)
the reaction rate is in the range of 10–40 pmol/(m3s) at 2 m altitude (EXALL). Regarding all Br2 source and sink reac-tions, the large additional source of bromine compounds due
to the air-sea exchange (81–154 pmol/(m2s)) leads to an ac-cumulation of bromine in the air. Even though the largest source and sink reactions for Br2are on the same order of magnitude, the source of gas phase Br2 due to air-sea ex-change is slightly larger than the Br2photolysis throughout the simulation time.
BrO mixing ratios in scenario EXALL tend to increase with time throughout the boundary layer. From 13:00 on mixing ratios exceed 5 pmol/mol even at 1000 m altitude (Fig. 6d) and increase further at this height up to 20 pmol/mol at 16:00, when the model column reaches the North shore of the Dead Sea. There is a delay of about one hour between the start of the model run at 10:00 when BrO surface values ex-ceed 1 pmol/mol after a few minutes until BrO mixing ratios in 1000 m also exceed 1 pmol/mol at 11:00.
Even though BrO gets quickly distributed all over the boundary layer, the strong vertical gradient in mixing ratios is striking (note the logarithmic scaling of the contour lines in plots showing BrO mixing ratios in Fig. 6d, e). BrO mix-ing ratios at e.g. 15:30 are less than half the ground level values at 10 m altitude (240 pmol/mol−→90 pmol/mol) and at 100 m altitude they are almost a factor of four smaller than mixing ratios directly above the Dead Sea water surface.
In Scenario EXLIM vertical transport is limited in the first two hours of simulation time leading to the sharp increase in BrO mixing ratios between 10:00 and 11:40 from below 1 up to 395 pmol/mol and the likewise quick decrease to about 30 pmol/mol between 11:40 and 13:00 when the inversion is broken up (Fig. 6b, blue dash-dotted line). Simultaneous to the very fast increase of BrO mixing ratios in the first 1.5 h that the model crosses the Dead Sea, O3 mixing ra-tios decrease until they reach a minimum of 9.3 nmol/mol at 11:40 (Fig. 6c, blue dash-dotted line). However, as soon as the low - level inversion is compensated, O3quickly reaches background mixing ratios of about 69 nmol/mol due to verti-cal downmixing of O3.
The limited O3destruction in scenario EXALL might be surprising at a first glance regarding the extraordinarily high BrO levels. Even though the net O3destruction is larger than the net O3production close to the Dead Sea water surface, the contribution of the strong O3sink due to reaction with halogens to the total O3mass balance is still not large enough to lead to a distinctive ODE.
As mixing ratios of bromine species show a strong verti-cal gradient, bromine mixing ratios in the upper boundary layer are not large enough anymore to destroy significant O3 levels. Thus vertical downmixing of O3 rich air from the upper boundary layer compensates the net O3 destruc-tion in the lower most metres of the boundary layer. How-ever, bromine mixing ratios permanently increase with time all over the boundary layer such that O3destruction cannot be totally compensated anymore by vertical mixing leading to the slight decrease in O3mixing ratios between 13:00 and 16:00.
As was discussed above O3 is depleted strongly and quickly in scenario EXLIM between 10:30 and 11:30. As bromine mixing ratios are high only in the lowest metres above sea level due to the limited vertical transport (Fig. 6e), O3destruction is also restricted to the lowest 10–20 m of the boundary layer. Above this inversion layer O3mixing ratios are again hardly affected by bromine chemistry. As soon as the inversion is broken up, O3gets again rapidly well mixed throughout the whole boundary layer. After 13:30, when the boundary layer height quickly rises to 1300 m, BrO is also quickly distributed all over the boundary layer and mixing ratios are between 2 pmol/mol and 50 pmol/mol all over the boundary layer (Fig. 6e).
6.3 Enhanced fluxes
With all of the Lagrangian scenarios presented above neither an ozone depletion event affecting the whole boundary layer could be simulated nor any significant O3depletion in case of a deep and well mixed boundary layer. For scenario ENH the fluxes of halogen species out of the Dead Sea water were enhanced for the first two hours of simulation time which is the time the model is roughly assumed to cross the evapora-tion ponds.
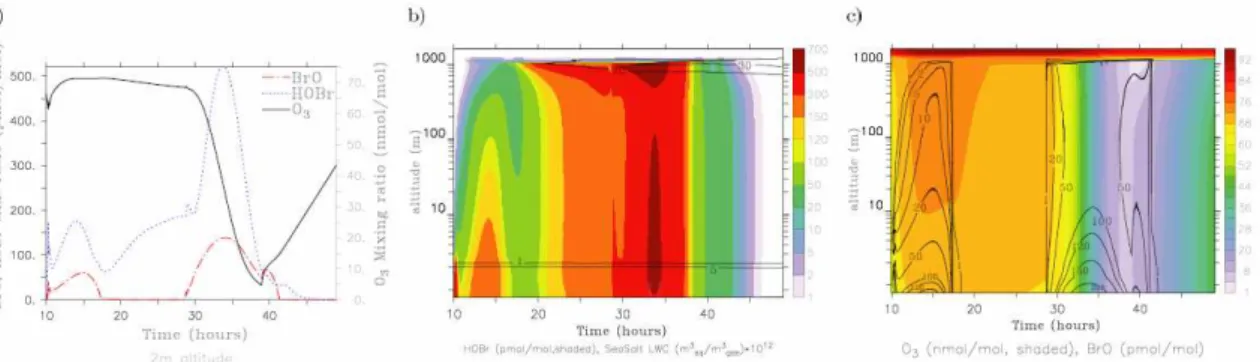
Fluxes were enhanced by a factor of 30 until 10:30, a fac-tor of 20 until 11:00 and a facfac-tor of 10 until 12:00. After-wards, the fluxes as calculated by the air-sea exchange pa-rameterisation are not modified anymore. BrO mixing ratios peak at 10:30, 11:00 and 12:00 as a response to the strong and instantaneous changes in the flux strength of BrO pre-cursor species. Between 10:00 and 11:00 BrO mixing ratios reach values between 600 and 750 pmol/mol (red dotted line, Fig. 7c). Simultaneously O3 mixing ratios decrease from 65 to 47 nmol/mol (black line, Fig. 7c). As the strength of degassing is again decreased after 11:00, BrO mixing ratios decrease quickly to about 300 pmol/mol and drop further to about 100 pmol/mol after 12:00 and stay more or less con-stant around this value until 16:00. During the same time span O3mixing ratios decrease constantly, but not very fast and reach a minimum value of 13 nmol/mol at 16:00.
Fig. 7.Figures in the top row show BrO (contour lines, in pmol/mol) and O3(shaded in nmol/mol) mixing ratios over the whole boundary
layer for scenarios ENH(a)and LOWBL(b)for the six hours that the model crosses the Dead Sea. Note the logarithmic scaling of the y-axis. Figures in the bottom row show BrO (red dashed lines, in pmol/mol) and O3(black solid lines, in nmol/mol) mixing ratios at 2 m
altitude for scenarios ENH(c)and LOWBL(d).
7 Stationary runs
To study the influence of changing meteorological back-ground conditions on tracer mixing ratios, scenario STAT was calculated. In comparison to scenario EX, maximum BrO mixing ratios on day 1 in scenario STAT are slightly lower: [BrO]EX: 100 pmol/mol, [BrO]STAT: 60 pmol/mol (Fig. 8a). NO2 mixing ratios are higher during the whole day in scenario STAT compared to scenario EX due to the prescribed advection of NO2into the model domain (day 1: [NO2]STAT≈0.8 nmol/mol, [NO2]EX≈0.3 nmol/mol). Thus comparatively more BrO is consumed via the reaction
BrO+NO2−→BrONO2 (R8)
leading mainly to the difference in BrO mixing ratios at day 1 between scenarios STAT and EX. On the second day of simulation time, BrO mixing ratios in scenario STAT in-crease stronger than on day 1 and reach a maximum value of 140 pmol/mol at 2 m altitude at about 10:00 in the morn-ing. Mixing ratios decrease again after 10:00 (34 h in Fig. 8=10:00 day 2) but are always larger than on day 1. BrO mixing ratios exceed 50 pmol/mol up to an altitude of about 1200 m almost all day long whereas on day 1 they were
al-ways lower than 12 pmol/mol in heights larger than 100 m (Fig. 8b, e).
Maximum HOBr mixing ratios at 2 m altitude on day 1 of the simulation time are of similar order of magnitude in scenarios STAT and EX. However, on the second day of simulation time, HOBr mixing ratios also increase to larger values than on day 1 ([HOBr]EX≈165 pmol/mol [HOBr]STAT,day 1≈174 pmol/mol,
[HOBr]STAT,day 2≈523 pmol/mol, Fig. 8a, b).
Fig. 8. All plots in this figure refer to scenario STAT. Plot (a)shows the time evolution at 2 m altitude of gas phase mixing ratios of HOBr (blue dotted line, pmol/mol), BrO (red dash-dotted line, pmol/mol) and O3(black solid line, nmol/mol). Plot(b)shows the vertical
distribution of HOBr mixing ratios (shaded, pmol/mol) and the liquid water content of sea salt aerosols (contour lines). Plot(c)shows the vertical distribution of O3(shaded, nmol/mol) and BrO mixing ratios (contour, pmol/mol).
though BrO mixing ratios are on the same order of magni-tude as e.g. in scenario EXALL where no influence on O3 chemistry could be found, the bromine oxide production in scenario STAT is sufficiently large to lead to a significant O3 depletion event.
Two factors contribute to the formation of the ODE: the (rather unrealistic) assumption that air masses are stagnant results in higher mixing ratio of halogens in the morning of the second day of the simulation compared to the first day. Br2mixing ratios before sunrise on day 2 are 470 pmol/mol whereas they increase from 0 at 10:00 on day 1 when the model simulations start ([Br2]STAT: 100 pmol/mol at 10:00 day 2).
Furthermore, the strong O3depletion is related to slightly changing meteorological background conditions from day 1 to day 2. The temperature is lower and the relative humid-ity is higher on day 2 compared to day 1. As explained in the model description the ambient relative humidity has to exceed the aerosol’s deliquescence humidity of 75% (70% for sulphate aerosols) to reactivate the calculation of sea salt (and respectively sulphate) aerosol chemistry in the model. On day 1 of the simulation time the relative humidity is be-low this threshold value all over the boundary layer but on day 2 it exceeds 75% at altitudes above 800 m (and 70% at altitudes above 650 m) and thus aerosol phase (sulphate and sea salt) chemistry is reactivated (Fig. 8b). As a result, aque-ous phase chemistry and the cycling of halogens on aerosol particles gains in importance. Within all levels having a LWC
>1012m3aq/m3gas in Fig. 8b, liquid phase chemistry is acti-vated in the model simulation (note again the logarithmic scaling of the y-axis in all plots showing vertical distribu-tions!). A generally efficient recycling process is the hetero-geneous decomposition of BrONO2on sulphate aerosols and the subsequent release of HOBr out of aerosol particles:
BrONO2−→HOBraq+HNO3aq (R9)
HOBraq−→HOBrg
Through strong vertical transport, also the lower part of the boundary layer is indirectly influenced by the enhanced halo-gen chemistry in the upper parts of the boundary layer. This can be seen in the vertical distribution of gas phase HOBr mixing ratios (Fig. 8b). As the total halogen recycling ca-pacity all over the boundary layer is enhanced, O3is depleted even though BrO mixing ratios do not exceed 200 pmol/mol. Even though the cycling of halogen species between the aerosol phase and the gas phase contributes to the increase in the gas phase halogen mixing ratios, the air-sea exchange of Br2and BrCl is still the dominant source for BrO especially in the lowest part of the boundary layer. BrO mixing ratios still show a strong vertical gradient. The inflow of O3into the model domain was increased in the afternoon hours of day 2 of simulation time, as otherwise O3mixing ratios would not increase anymore. Almost all measurements show a quick in-crease of O3mixing ratios in the late afternoon/early evening hours. However, a flux of 6.8 pmol/(mol s) of O3was neces-sary to reach mixing ratios of at least 40 nmol/mol at 20:00 day 2 in the model.
One of the main conclusions which can be drawn from this idealised scenario is that it is important not only to consider chemistry as an isolated system as apparently in addition to changes in tracer concentrations, small changes in the mete-orological background conditions (namely temperature and humidity) give a large feedback to chemistry.
8 Discussion
day 2: 139 day 2: 5 92% slightly differing meteorological background conditions
the Southern end of the Dead Sea than the Northern end (Tas et al., 2005; Zingler and Platt, 2005). With the Lagrangian scenario EXLIM it was possible to reproduce these measure-ments showing high BrO mixing ratios (>60 pmol/mol) all over the Dead Sea but an ODE only in the South. Results agree well regarding the strength of the ODE, the spatial dis-tribution of O3and BrO as well as the temporal evolution of the depletion event meaning a very quick O3decrease when air masses are assumed to reach the Dead Sea from the South (see Fig. 6).
Nevertheless, the presence of BrO mixing ratios of almost 400 pmol/mol at 2 m altitude are necessary to destroy a sig-nificant amount of O3in the model. However, it is possible that the effect of a low level inversion is overestimated in the model. It is likely that he inversion height in the model sim-ulation is slightly too low. Furthermore, the inversion could be compensated faster in reality. Consequently it is likely that BrO mixing ratios would not become as high as in sce-nario EXLIM. To asses the potential overestimation of the in-version, scenario EXLIM was recalculated only allowing the exchange of Br2and BrCl (not shown). In that case BrO mix-ing ratios reached a maximum mixmix-ing ratio of 290 pmol/mol (in contrast to 395 pmol/mol in EXLIM) and O3 still de-creased quickly to 13 nmol/mol (in contrast to 10 nmol/mol in EXLIM). It is not possible to evaluate those model re-sults, as the measurements were only taken at one level at approximately 2 m height and no information about the ver-tical extent of the real depletion events or BrO mixing ratios is available. For future studies it would be desirable to mea-sure the vertical extent of the layer affected by ozone loss and possibly vertical profiles of BrO. Information about the ver-tical structure of the boundary layer (temperature, humidity) would also be very helpful.
8.1 Idealised pseudo-lagrangian model setup
The assumption for the lagrangian scenarios that the wind direction is southerly all over the lake might be idealised. Regarding the wind direction data given by Matveev et al. (2001) the wind direction was at least at the measurement station southerly on numerous days. Even if we assume, that
air masses that crossed the evaporation ponds from the South towards the North do not reach the northern End of the lake but are redirected (e.g. due to the lake breeze) after reach-ing the centre of the lake (thus stoppreach-ing our simulations after about 3 h or continuing them without further increasing the pH of the water) we can still conclude that we need a bromine source in addition to aerosols and that an ODE is likely to oc-cur (fast) only under certain meteorological conditions.
The assumption that air masses reaching the South of the Dead Sea coming from the desert have a negligible halogen load might not be true under all circumstances. As was ob-served by Tas et al. (2005) air masses reaching the Dead Sea from the desert South of the lake can already contain a signif-icant load of BrO (up to 20 pmol/mol, Tas et al., 2005) which was attributed to recirculations of air masses. For such cases the Lagrangian setup underestimates initial halogen concen-trations. However, the different simulations presented herein indicate that an additional halogen load of this reported or-der of magnitude would not lead to a much faster and much stronger O3decrease than shown in the modelled cases.
8.2 Aqueous phase reactions including DOM
Halobromous oxide is likely to react efficiently with organic matter in the aqueous phase (e.g. Jaworske and Helz, 1985). One general uncertainty regarding our model results can be attributed to this reaction. A high uncertainty is related to the actual rate constant for the reaction between HOBr and DOM as well as to the DOM (or DOC) concentrations in the Dead Sea water. To the knowledge of the authors, the only values for DOM (and DOC) concentrations in the Dead Sea water are cited by Nissenbaum (1975) and are based on un-published measurements. Therefore, we performed a series of sensitivity studies with different DOM concentrations and different rate coefficients in order to be able to discuss the potential impact of this reaction on our results.
well as the salinity of the lake water (e.g. Anati and Shasha, 1989). Even though several microorganisms have been found in the Dead Sea water, their distribution does not seem to be homogeneous among the lake water and concentrations of bacteria seem to be comparatively low (Shimoni et al., 2002; Oren, 2008). Can we therefore also assume that DOM/DOC concentrations vary within the Dead Sea water, similar like the pH shows a gradient between the northern part of the lake and the southern part? Are there seasonal variations in DOM (or DOC) concentrations? We do not know where and when the samples were taken which were used for the creation of the dataset cited in Nissenbaum (1975). We further do not know if at that time e.g. algae were present in the lake water or had been present in the weeks before the sampling took place.
Implications for the model results: we varied DOM con-centrations in the Dead Sea water between 0.0001 g/m3and 0.1 g/m3 and the rate coefficient for the reaction between HOBr and DOM was varied between 104and 106M−1s−1 (based on Jaworske and Helz, 1985 and Pechtl et al., 2007, and references therein). If DOM concentrations exceed 0.01 g/m3 , HOBr concentrations in the Dead Sea water decrease almost immediately by about two orders of mag-nitude. This results in negligibly small mixing ratios of BrO in scenario EXALL whereas they still increase up to at least 15 pmol/mol (depending on the chosen rate coeffi-cient) at 2 m altitude in scenario EXLIM. DOM concentra-tions for which at least several pmol/mol BrO build up in sce-nario EXLIM, are still smaller than reported in Nissenbaum (1975). Consequently, bromine species in the Dead Sea wa-ter become too small to degase in significant concentrations out of the Dead Sea water. Thus the question of additional bromine sources has to be addressed again. Surface reac-tions on the Dead Sea water could contribute to the gas phase bromine load as was suggested by Matveev et al. (2001) but they are considered to be of minor importance. Crystallized surface salt deposits were discussed as a potential bromine source. However, no striking correlations regarding the exis-tence of such salt deposits and high BrO mixing ratios were observed and are reported in the literature. The sensitivity studies including reactions with DOM might further support the idea, that an inversion is necessary for the formation of high BrO levels (and an ODE).
We consider it as likely that DOM/DOC concentrations in the very shallow and highly concentrated evaporation ponds are lower than in the northern part of the Dead Sea which has a lower salinity. Thus concentrations of bromine species in the southern part of the lake would be high enough to de-gas into the atmosphere and supply a source for de-gas phase bromine species.
8.3 Bromine source strength
Apart from the uncertainties regarding the influence of me-teorological background conditions on trace gas
concentra-tions, one additional uncertainty is the actual source strength of bromine species degassing out of the Dead Sea water. As the evaporation ponds are very shallow, the water within the ponds have a highly concentrated bromide content and the depth of each pond is different and is varied regularly, the pa-rameterisation used to calculate air-sea exchange might un-derestimate the bromine source strength over the evaporation ponds. However, it is difficult to estimate quantitatively how large this potential error might be.
In addition it is possible that bromine compounds are di-rectly injected into the evaporation ponds by the Dead Sea Bromine Company during the process of industrial bromine production. These emissions into the water could contribute to the temporal as well as spacial variability of the bromine contend (depending on the emissions from the Dead Sea Works) in the different ponds at the southern end of the Dead Sea and thus to the varying bromine emission strength. This would also be an explanation for the highly variable BrO mixing ratios as observed over the evaporation ponds.
However, it is unlikely that the emissions by the Dead Sea Bromine Company are the only reason for the enhanced BrO mixing rations over the Dead Sea. Hebestreit et al. (1999) discuss the potential impact of gas phase emissions of the Dead Sea Works and point out that the diurnal variation of industrial emissions like NOxand SO2are different than the diurnal variations of BrO concentrations. They even ruled out that the factory emissions are a bromine source due to the time variation of the BrO signal.
In order to test the effect of an additional bromine source over the Southern part of the Dead Sea, scenario ENH was calculated. O3is depleted in this scenario even though more than 700 pmol/mol BrO are formed. It was observed by Matveev et al. (2001) that ODEs can occur only affecting the Northern part of the Dead Sea like it is simulated in scenario ENH. Again it is not possible to evaluate the model results of scenario ENH and scenario LOWBL as well, regarding the vertical extent of the depletion event due to the lack of vertically resolved measurements.
As mentioned in the introduction a few measurements took place on an elevated site 400 m above water level. Only at 3 out of 22 days BrO (≈20 pmol/mol) was detected and thus simulated values (EX, EXALL) are on the same order of magnitude at this altitude. Tas et al. (2003) assumed that on those three days where BrO mixing ratios were detected, the boundary layer height was very low. However, in scenario EXALL the boundary layer height is about 1300 m and BrO is transported very efficiently with high concentrations into altitudes around 400 m. This let the question arise, what kind of local wind and transport pattern is responsible for thelack of BrO on the other days.
8.4 Reactions on “dry” aerosol particles
NOEX does (i) not lead to a stronger O3 destruction and (ii) in comparison to scenario NOEX the formation of BrO (BrOmax: 0.02 pmol/mol) is still significantly lower than ob-servations show. The slow phase transfer reactions due to the low ambient relative humidity and the low LWC is the main limitation for an efficient aerosol recycling of halogens.
8.5 Literature comparison
In general results from model simulations presented herein agree very well with a first simple model study by Stutz et al. (1999) who concluded that the production of 500 pmol/mol BrO would be essential to simulate a significant loss in O3 within at least three hours. However, results from both stud-ies differ significantly from what is presented by Tas et al. (2006) and their follow up paper (Tas et al., 2008). Below we list the main differences in the model approaches used in this study and the study by Tas et al. (2006).
1. In their model calculations, Tas et al. (2006) consider aerosols as the only gas phase bromine source.
2. The model used by Tas et al. (2006) treats only gas phase chemistry explicitly, one aqueous phase and one heterogeneous reaction were parameterised.
3. The source strength of Br2was not chosen process re-lated by Tas et al. (2006) but was chosen until model simulations agreed best with observations.
4. The model simulations by Tas et al. (2006) were stronger constrained. O3 fluxes were prescribed into the model domain and consequently simulated and ob-served O3concentrations agreed very well.
5. Tas et al. (2006) explain the fast decrease (as well as increase) in O3 concentrations by: “the decrease inO3 concentrations beneath a threshold value of 1– 2 nmol/mol acts as a motive force for freshO3 fluxes to move into the evaporation ponds.” whereas we con-sider either changes in the bromine source strength (see Sect. 8.3) or meteorological processes as the more likely explanation for the observations.
cate that bromine release from salt aerosols is not sufficient as a source for BrO at the Dead Sea and that most likely air-sea exchange of halogens between the Dead Sea and the atmosphere has to be considered in order to simulate BrO mixing ratios in the same order of magnitude as observations show.
A fast and strong ODE could only be simulated if an in-version was assumed that limits vertical transport. In addi-tion an ODE develops if either the flux of halogens out of the Dead Sea was temporally enhanced or if the BL height did not exceed 700 m. In both cases however the time evolu-tion of the ODE was much slower than often observed at the Dead Sea. It is difficult to evaluate the model results properly due to missing information regarding meteorological back-ground conditions at the measurement days. In order to im-prove our understanding of O3and halogen chemistry at the Dead Sea, the knowledge of temperature, relative humidity and the boundary layer height for every single measurement day is absolutely crucial.
It would be of interest to have a data set showing the ver-tical distribution of BrO and O3. Model simulations indicate that the vertical gradient in BrO mixing ratios is very strong in the lowest 10 to 20 m above the water surface. All pub-lished measurements were done with the DOAS technique at an altitude of approximately 2 m. According to the model results it is even of significance whether measurements are taken at 1.50 m or 2.30 m or 10 m. We have no reliable in-formation regarding the vertical extent of an ODE and the strength of an ODE in the upper boundary layer. Overall it can be concluded that meteorological processes seem to play a key role in understanding the observed fast O3 depletion events. Chemical processes lead to the formation of BrO and the destruction of O3however, the strength and spacial extent of the ODEs as well as the distribution of halogen species within the boundary layer strongly depend on the local me-teorology.
Acknowledgements. This project was funded by the Deutsche Forschungsgemeinschaft DFG (Emmy Noether Junior Re-search Group MarHal GL 353/1-2) and is a contribution to the IGAC/SOLAS task “Halogens in the Troposphere”.
The service charges for this open access publication have been covered by the Max Planck Society.
References
Alpert, P., Shafir, H., and Issahary, D.: Recent changes in the cli-mate at the Dead Sea - A Preliminary Study, Clicli-mate Change, 37, 513–537, 1997.
Anati, D. and Shasha, S.: Dead Sea surface-level changes, Isr. J. Earth Sci., 38, 29–32, 1989.
Barrie, L. A., Bottenheim, J. W., Schnell, R. C., Crutzen, P. J., and Rasmussen, R. A.: Ozone destruction and photochemical reac-tions at polar sunrise in the lower Arctic atmosphere, Nature, 334, 138–141, 1988.
Bitan, A.: The Influence of the Special Shape of the Dead-Sea and Its Environment on the Local Wind System, Arch. Meteor. Geo-phy. B, 24, 283–301, 1977.
Fickert, S., Adams, J. W., and Crowley, J. N.: Activation of Br2and
BrCl via uptake of HOBr onto aqueous salt solutions, J. Geophys. Res., 104, 23719–23727, 1999.
Hebestreit, K., Stutz, J., Rosen, D., Matveev, V., Peleg, M., Luria, M., and Platt, U.: DOAS Measurements of Tropospheric Bromine Oxide in Mid-Latitudes, Science, 283, 55–57, 1999. H¨onninger, G., Bobrowski, N., Palenque, E. R., Torrez, R.,
and Platt, U.: Reactive bromine and sulfur emissions at Salar de Uyuni, Bolivia, Geophys. Res. Lett., 31, L04101, doi:10.1029/2003GL018818, 2004.
Jaenicke, R.: Aerosol Physics and Chemistry, in: Landolt-B¨ornstein “Zahlenwerte und Funktionen aus Naturwissenschaften und Technik”, V 4b, 391–457, Springer, 1988.
Jaworske, D. and Helz, G.: Rapid Consumption of Bromine Oxide in River and Estuarine Waters, Environ. Sci. Technol., 19, 1188– 1191, 1985.
Kerkweg, A., Sander, R., Tost, H., J¨ockel, P., and Lelieveld, J.: Technical Note: Simulation of detailed aerosol chemistry on the global scale using MECCA-AERO, Atmos. Chem. Phys., 7, 2973–2985, 2007,
http://www.atmos-chem-phys.net/7/2973/2007/.
Liss, P. S. and Slater, P. G.: Flux of Gases across the Air-Sea Inter-face, Nature, 147, 181–184, 1974.
Matveev, V., Peleg, M., Rosen, D., Tov-Alper, D. S., Hebestreit, K., Stutz, J., Platt, U., Blake, D., and Luria, M.: Bromine oxide – ozone interaction over the Dead Sea, J. Geophys. Res., 106, 10375–10387, 2001.
Monahan, E. C., Spiel, D. E., and Davidson, K. L.: A model of marine aerosol generation via whitecaps and wave disruption, in: Oceanic Whitecaps, edited by: Monahan, E. C. and Niocaill, G. M., D. Reidel, Norwell, Mass, 167–174, 1986.
Nissenbaum, A.: The Microbiology and Biogeochemistry of the Dead Sea, Microb. Ecol., 2, 139–161, 1975.
Oren, A.: Microbial life at high salt concentrations: phy-logenetic and metabolic diversity, Saline Systems, 4(2), doi:10.11861/1746-1448-4-2, 2008.
Oren, A. and Ventosa, A.: Benjamin Elazari Volcani (1915-1999: Sixty-three years of studies of the microbiology of the Dead Sea), Int. Microbiol., 2, 195–198, 1999.
Pechtl, S., Schmitz, G., and von Glasow, R.: Modelling iodide – iodate speciation in atmospheric aerosol: Contributions of in-organic and in-organic iodine chemistry, Atmos. Chem. Phys., 7, 1381–1393, 2007,
http://www.atmos-chem-phys.net/7/1381/2007/.
Pozzer, A., J¨ockel, P., Sander, R., Williams, J., Ganzeveld, L., and Lelieveld, J.: Technical Note: The MESSy-submodel AIRSEA
calculating the air-sea exchange of chemical species, Atmos. Chem. Phys., 6, 5435–5444, 2006,
http://www.atmos-chem-phys.net/6/5435/2006/.
Pruppacher, H. R. and Klett, J. D.: Microphysics of Clouds and Pre-cipitation, Kluwer Academic Pub., Dordrecht/Boston/London, 1997.
Sander, S. P., Finlayson-Pitts, B. J., Friedl, R. R., Golden, D. M., Huie, R. E., Keller-Rudek, H., Kolb, C. E., Kurylo, M. J., Molina, M. J., Moortgat, G. K., Orkin, V. L., Ravishankara, A. R., and Wine, P. H.: Chemical Kinetics and Photochemical Data for Use in Atmoshperic Studies, JPL Publication 06-2, Jet Propulsion Laboratory, Pasadena, Evaluation Number 15, 2006.
Shimoni, M., Ben-Dor, E., Karnieli, A., Eichler, J., van der Meer, F., and Kaufmann, H.: Searching for Life in the Dead Sea: Microbi-ological Study Using Imaging Spectroscopy, Vol. 4545, in: Re-mote Sensing for Environmental Monitoring, GIS Applications, and Geology, edited by: Ehlers, M., Proceedings of SPIE, 155– 164, 2002.
Sirkes, Z., Schirmer, F., Essen, H.-H., and Gurgel, K.-W.: Surface currents and seiches in the Dead Sea, in: The Dead Sea: The Lake and Its Setting, edited by: Niemi, T., Ben-Avrahem, Z., and Gat, J., Oxford Monogr. Geol. Geophys., vol. 36, Oxford Univ. Press, New York, 104–113, 1997.
Stutz, J., Hebestreit, K., Alicke, B., and Platt, U.: Chemistry of Halogen Oxides in the Troposphere: Comparison of Model Cal-culations with Recent Field Data, J. Atmos. Chem., 34, 65–85, 1999.
Stutz, J., Ackermann, R., Fast, J. D., and Barrie, L.: Atmospheric Reactive Chlorine and Bromine at the Great Salt Lake, Utah, Geophys. Res. Lett., 29(10), 1380, doi:10.1029/2002GL014812, 2002.
Sverdrup, H., Johnson, M., and Fleming, R.: The Oceans, Their Physics, Chemistry and General Biology, Prentice-Hall, Engle-wood Cliffs, NJ, USA, 1942.
Tang, I.: Thermodynamic and optical properties of mixed-salt aerosols of atmospheric interest, J. Geophys. Res., 102, 1883– 1893, 1997.
Tas, E., Matveeva, V., Zingler, J., Luria, M., and Peleg, M.: Fre-quency and extent of ozone destruction episodes over the Dead Sea, Israel, Atmos. Environ., 37, 4769–4780, 2003.
Tas, E., Peleg, M., Matveev, V., Zingler, J., and Luria, M.: Fre-quency and extent of bromine oxide formation over the Dead Sea, J. Geophys. Res., 110, D11304, doi:10.1029/2004JD005665, 2005.
Tas, E., Peleg, M., Pedersen, D. U., Matveev, V., Pour Biazar, A., and Luria, M.: Measurement-based modeling of bromine chem-istry in the boundary layer: 1. Bromine chemchem-istry at the Dead Sea, Atmos. Chem. Phys., 6, 5589–5604, 2006,
http://www.atmos-chem-phys.net/6/5589/2006/.
Tas, E., Peleg, M., Pedersen, D. U., Matveev, V., Biazar, A. P., and Luria, M.: Measurement-based modeling of bromine chemistry in the Dead Sea boundary layer – Part 2: The influence of NO2
on bromine chemistry at mid-latitude areas, Atmos. Chem. Phys., 8, 4811–4821, 2008,
http://www.atmos-chem-phys.net/8/4811/2008/.
Vogt, R., Crutzen, P. J., and Sander, R.: A mechanism for halo-gen release from sea-salt aerosol in the remote marine boundary layer, Nature, 383, 327–330, 1996.