Impact of Dietary Tomato Juice on Changes
in Pulmonary Oxidative Stress, Inflammation
and Structure Induced by Neonatal
Hyperoxia in Mice (
Mus musculus
)
Sheena Bouch1¤a*, Richard Harding1, Megan O’Reilly1¤b, Lisa G. Wood2, Foula Sozo1
1Development and Stem Cells Program, Monash Biomedicine Discovery Institute and Department of Anatomy and Developmental Biology, Monash University, Melbourne, Victoria, Australia,2Centre for Asthma and Respiratory Diseases, Hunter Medical Research Institute, The University of Newcastle, Newcastle, New South Wales, Australia
¤a Current address: Peter Gilgan Centre for Research and Learning, The Hospital for Sick Children, Toronto, Ontario, Canada
¤b Current address: Department of Pediatrics, University of Alberta, Edmonton, Alberta, Canada
Abstract
Many preterm infants require hyperoxic gas for survival, although it can contribute to lung injury. Experimentally, neonatal hyperoxia leads to persistent alterations in lung structure and increases leukocytes in bronchoalveolar lavage fluid (BALF). These effects of hyper-oxia on the lungs are considered to be caused, at least in part, by increased oxidative stress. Our objective was to determine if dietary supplementation with a known source of antioxidants (tomato juice, TJ) could protect the developing lung from injury caused by breathing hyperoxic gas. Neonatal mice (C57BL6/J) breathed either 65% O2(hyperoxia) or room air from birth until postnatal day 7 (P7d); some underwent necropsy at P7d and others were raised in room air until adulthood (P56d). In subsets of both groups, drinking water was replaced with TJ (diluted 50:50 in water) from late gestation to necropsy. At P7d and P56d, we analyzed total antioxidant capacity (TAC), markers of oxidative stress (nitrotyro-sine andheme oxygenase-1expression), inflammation (interleukin-1β(IL-1β) andtumor
necrosis factor-α(TNF-α) expression), collagen (COL) and smooth muscle in the lungs; we
also assessed lung structure. We quantified macrophages in lung tissue (at P7d) and leuko-cytes in BALF (at P56d). At P7d, TJ increased pulmonary TAC andCOL1α1expression and attenuated the hyperoxia-induced increase in nitrotyrosine and macrophage influx; however, changes in lung structure were not affected. At P56d, TJ increased TAC, decreased oxidative stress and reversed the hyperoxia-induced increase in bronchiolar smooth muscle. Additionally, TJ alone decreasedIL-1βexpression, but following hyperoxia TJ increasedTNF-αexpression and did not alter the hyperoxia-induced increase in leuko-cyte number. We conclude that TJ supplementation during and after neonatal exposure to hyperoxia protects the lung from some but not all aspects of hyperoxia-induced injury, but
a11111
OPEN ACCESS
Citation:Bouch S, Harding R, O’Reilly M, Wood LG, Sozo F (2016) Impact of Dietary Tomato Juice on Changes in Pulmonary Oxidative Stress, Inflammation and Structure Induced by Neonatal Hyperoxia in Mice (Mus musculus). PLoS ONE 11(7): e0159633. doi:10.1371/journal.pone.0159633
Editor:Partha Mukhopadhyay, National Institutes of Health, UNITED STATES
Received:October 27, 2015
Accepted:July 6, 2016
Published:July 20, 2016
Copyright:© 2016 Bouch et al. This is an open access article distributed under the terms of the Creative Commons Attribution License, which permits unrestricted use, distribution, and reproduction in any medium, provided the original author and source are credited.
Data Availability Statement:All relevant data are within the paper and its Supporting Information files.
Funding:This study was supported by the National Health and Medical Research Council of Australia (https://www.nhmrc.gov.au) Program Grant #606789 and Monash University, Australia. The funders had no role in study design, data collection and analysis, decision to publish, or preparation of the manuscript.
may also have adverse side-effects. The effects of TJ are likely due to elevation of circulat-ing antioxidant concentrations.
Introduction
Due to improvements in neonatal clinical care, most preterm infants born after 25 weeks of gestation are now capable of survival. However, many preterm infants, especially those born before 32 weeks of gestation, are at high risk of developing bronchopulmonary dysplasia (BPD) [1,2]. BPD is a form of lung injury involving increased inflammation [3,4] and is characterized by alterations in the structure and function of both the gas-exchanging tissue of the lung and the conducting airways [5,6]. It is now recognized that the lung injury and altered lung devel-opment associated with BPD increases the risk of persistent respiratory morbidities such as impaired lung function [7,8] and asthma [9,10], as well as reduced exercise capacity [11,12].
In spite of advances in the respiratory management of very preterm infants, the incidence of BPD has not significantly decreased [2]. Approximately 90% of very- and extremely-preterm infants require some form of supplemental oxygen therapy [13] and it is now established that prolonged exposure to supplemental oxygen is a major contributor to BPD [14]. In support of the clinical findings, numerous experimental studies have demonstrated that prolonged inhala-tion of hyperoxic gas at a time when the lung is still developing can replicate hallmark features of BPD, namely alveolar simplification, increased airway smooth muscle, and inflammation within the lung [15–21].
An important factor contributing to lung injury and altered lung development induced by neonatal hyperoxia is thought to be an increase in oxidative stress
[22]. Preterm infants are likely to be particularly vulnerable to oxidative stress as they have an immature endogenous antioxidant system and are therefore unable to mount an adequate antioxidant response to a hyperoxic environment [23]. Thus, it has been proposed that antioxi-dant supplementation may protect preterm infants from the injurious effects of hyperoxia by restoring the redox balance [24,25]. Attempts have been made to improve antioxidant defense in preterm infants by dietary supplementation with known antioxidants [26]. However, clinical trials and laboratory experiments using single antioxidants have shown them to be largely inef-fective in ameliorating hyperoxia-induced lung injury [24,27–29]. Furthermore, an imbalance between different antioxidants can result in tissue damage [30], suggesting that supplementa-tion with single antioxidants could be harmful. As antioxidant defense involves multiple path-ways [30], supplementation with any single antioxidant is unlikely to provide adequate protection against injury caused by oxidative stress. Therefore, it has been proposed that a mix-ture of antioxidants may be more effective in preventing hyperoxia-induced tissue injury [30]. In this regard, tomato juice (TJ) may be a suitable candidate for dietary antioxidant supple-mentation as it contains a complex array of antioxidants including anthocyanin,β-carotene, vitamins A, C and E and lycopene [31]. These antioxidants have the ability to scavenge reactive oxygen species (ROS) [32]; lycopene in particular is a potent scavenger due to the large number of double bonds within its structure [33]. Dietary supplementation with TJ has been shown to improve lung function and reduce neutrophil influx in asthmatic adults [34]; it has also been shown, in neonatal rats, to prevent nicotine-induced lung injury [35], which is predominantly mediated by an increase in ROS.
and inflammation are intimately linked, and neonatal inhalation of hyperoxic gas has been shown to adversely affect pulmonary immune status [15], we proposed that the effect of hyper-oxia on immune status would also be ameliorated. Our objective was to determine whether alterations in oxidative stress, inflammation and lung structure induced by prolonged inhala-tion of hyperoxic gas during lung development could be prevented by dietary supplementainhala-tion with TJ, a known source of antioxidants that could safely be administered to preterm infants. Owing to differences in lung development between males and females [36], we also interro-gated our data for effects of sex.
Materials and Methods
Our study was approved by the Monash University Animal Ethics Committee (project number: MARP/2011/061) in accordance with the National Health and Medical Research Council of Australia’s Code of Practice for the Care and Use of Animals for Scientific Purposes.
Treatment groups
Time-mated pregnant C57BL6/J mice (Mus musculus) were randomly assigned to four treat-ment groups: 1. a group that breathed room air from birth (Air); 2. a group that breathed 65% O2for 7 days after birth (Hyperoxia, Hyp); 3. a group that breathed room air from birth and
whose diet was supplemented with TJ (Air+TJ); 4. a group that breathed 65% O2for 7 days
after birth and whose diet was supplemented with TJ (Hyp+TJ). In the hyperoxia groups, con-centrations of O2and CO2were continuously monitored (Servoflex MiniMP 5200, Servomex,
TX) within the housing chambers (floor area 501cm2; Tecniplast, Italy). Each litter was housed individually. The mice were provided with food and water (or TJ)ad libitum. Mice were health checked daily throughout the experimental period. If mice lost weight (~20% reduction in body weight), stopped eating and/or drinking, or displayed reduced physical activity, they were removed from experimental conditions and euthanized via cervical dislocation. No unexpected deaths were encountered. No invasive experimental procedures were performed in this experi-ment that required the administration of analgesics or anesthetics to ameliorate animal suffer-ing. Within each treatment group, dams and litters were allocated into short-term (7 days) and long-term (56 days) survival studies. Mice are considered to have reached adulthood by 56 days.
Short-term survival study. Mice in the Hyp and Hyp+TJ groups were exposed to 65% O2
from ~0.5 days prior to birth until postnatal day 7 (P7d; Hyp, n = 37: 18 males (M), 19 females (F); Hyp+TJ, n = 24: 11M, 13F). The Air and Air+TJ groups breathed room air from birth to P7d (Air, n = 32: 17M, 15F; Air+TJ, n = 27: 15M, 12F). Necropsy was performed at P7d follow-ing cervical dislocation and the lungs were collected for analysis.
Long-term survival study. Mice in the Hyp and Hyp+TJ long-term survival groups were exposed to 65% O2from birth until P7d, after which they were raised in room air until P56d
(Hyp, n = 34: 16M, 18F; Hyp+TJ, n = 23: 11M, 12F). The Air and Air+TJ groups breathed room air from birth to P56d (Air, n = 35: 14M, 21F; Air+TJ, n = 27: 15M, 12F). Mice were weaned at P21d. At P56d, necropsy was performed following cervical dislocation for collection of blood, bronchoalveolar lavage fluid (BALF) and the lungs.
daily; the daily volume of water consumed by the Air and Hyp groups was also recorded. For the short-term survival cohort, drinking water was replaced with the diluted TJ from E15d to necropsy at P7d. For the long-term survival cohort, the diluted TJ was provided from day 15 of pregnancy (E15d) to P56d. Before birth, offspring were presumed to have received antioxidants from the TJ via the placenta and after birth they received antioxidants via maternal milk or from drinking TJ.
Plasma and tomato juice carotenoid concentrations
At necropsy at P56d, blood was collected by cardiac puncture and plasma stored at -80°C. Plasma and TJ samples were analyzed to determine concentrations of the carotenoids lycopene, α-carotene,β-carotene,β-cryptoxanthin and lutein/zeaxanthin by high performance liquid chromatography (HPLC), which was conducted in a darkened laboratory under red light at The University of Newcastle, Australia. Plasma samples from offspring in each treatment group were pooled to obtain a sufficient volume for analysis; therefore, only one value per group was obtained. Ethanol:ethyl acetate (1:1) containing the internal standard canthaxanthin was added to each sample, and each sample was then vortexed and centrifuged at 3000xg for 10 minutes at 4°C. The supernatant was removed and collected, and the above process repeated three times, the first two with ethanol:ethyl acetate (1:1) and the third with hexane. The super-natants collected from each centrifugation were pooled and ultra-pure water was added to the mixture, which was then vortexed and centrifuged. The supernatant containing the organic sol-vents was decanted and any remaining solsol-vents evaporated with nitrogen. The sample pellets were reconstituted in dichloromethane:methanol (1:2 v/v) and chromatography was performed on a Hypersil ODS column (100mm x 2.1m x 5μm) with a flow rate of 0.3mL/min. Carotenoids
were analyzed using a mobile phase of acetonitrile:dichloromethane:methanol (containing 0.05% ammonium acetate) (85:10:5 v/v) and a diode array detector (450nm) [37].
Tissue collection and processing at P7d and P56d
At necropsy, lungs of offspring used for histological, immunohistochemical and immunofluo-rescent analyses were fixedin situvia the trachea (at 25cmH2O) with 4% paraformaldehyde
(PFA) in 0.1M phosphate buffered saline (PBS; pH 7.4). The lungs were then immersion-fixed with 4% PFA in 0.1M PBS (pH 7.4) for 24h, post-fixed in Zamboni’s fixative (10% v/v 37% formaldehyde, 0.1M phosphate buffer, 15% v/v saturated picric acid) for another 24h, pro-cessed in ethanol and xylene and then embedded in paraffin wax. At P7d, the numbers of ani-mals in each group were: Air, n = 24 (13M, 11F); Hyp, n = 29 (14M, 15F); Air+TJ, n = 19 (9M, 10F); Hyp+TJ, n = 16 (8M, 8F). At P56d, animal numbers in each group were: Air, n = 27 (10M, 17F); Hyp, n = 26 (12M, 14F); Air+TJ, n = 19 (9M, 10F); Hyp+TJ, n = 16 (9M, 7F).
Separate animals from each treatment group (n = 6–8 per group) provided samples of lung tissue that were snap-frozen in liquid nitrogen at necropsy and stored at -80°C for subsequent quantitative real-time polymerase chain reaction (qPCR) analyses and determination of total antioxidant capacity (TAC).
Microscopy analyses
Single sagittal sections (5μm) of both the entire left and right paraffin-embedded lungs were
used for histological and immunohistochemical analyses. Sagittal sections (5μm) through the
version 6.2, Media Cybernetics, MD). For immunofluorescent analysis, stained sections were examined by fluorescent microscopy (Zeiss Imager A1, Zeiss, Germany) and images captured with a digital camera (AxioCam MRc5, Zeiss, Germany) linked to image analysis software (AxioVision, version 4.8, Zeiss, Germany). Images were collected at a final magnification of x200. All analyses were conducted in a blinded manner by the same researcher (S.B).
Oxidative stress in the lung parenchyma
Nitrotyrosine staining within lung tissue was used as a marker for oxidative stress [38]. Nitro-tyrosine is produced in tissue by Nitro-tyrosine nitration following the formation of peroxynitrite by nitric oxide and the superoxide free radical [39]. Nitrotyrosine was detected using an estab-lished immunohistochemical stain [40]. In each of the left and right lungs, three and five fields of view of lung parenchyma (free of large conducting airways and major blood vessels) were analyzed at P7d and P56d, respectively. The area of lung tissue positively stained for nitrotyro-sine (identified by brown staining) was determined and expressed as a percentage of the total area of tissue for each field of view.
Pulmonary
heme oxygenase-1
gene expression
Heme oxygenase-1 (HO-1) is an inducible catabolic enzyme that is upregulated in response to a state of oxidative stress [41]. Using frozen lung tissue collected at P7d and P56d, we per-formed total RNA extraction followed by cDNA synthesis and qPCR to determine the gene expression ofHO-1(GenBank accession number NM_010442.2) [40]. At P7d,HO-1mRNA levels were normalized against the housekeeping geneβ-actin(GenBank accession number NM_007393.3) using the comparative delta CT(cycle threshold) method; at P56d,HO-1
mRNA levels were normalized against the housekeeping gene18S rRNA(GenBank accession number NC_000072.6) [40]. Values were expressed as a fold-change relative to the mean mRNA levels of the Air group at the same age (P7d or P56d).
Total antioxidant capacity of lung tissue
At P7d and P56d, the TAC of small antioxidant molecules including dietary antioxidants and uric acid was measured in samples of frozen lung tissue using a TAC assay kit, according to the manufacturer’s instructions (#ab65329, Abcam, UK). The assay measures the ability of a sam-ple to reduce Cu2+ions to Cu+. The Cu+ion is chelated with a colorimetric probe producing an absorbance peak at 560nm. Samples were assayed in conjunction with a series of standards, and TAC determined by interpolation of the standard curve.
Macrophages in lung tissue at P7d
We assessed macrophages in the lung as they play a key role in inflammation [42]. Macro-phages in the lung parenchyma were identified using an immunofluorescent stain for galectin-3 [40]. In the right lung, three fields of view that were free of major airways and blood vessels were analyzed. Fields of view were randomly selected using a blue filter, which does not distin-guish positively stained cells. The number of macrophages (identified by red staining) was expressed as a percentage of the total number of cells in the lung parenchyma for each field of view.
Leukocytes in bronchoalveolar lavage fluid at P56d
lavaging the airway lumen with 2 x 1mL of saline. Leukocytes within the BALF were isolated, prepared and stained with either 0.4% trypan blue solution or May-Grünwald-Geimsa for the determination of the total number of leukocytes per mL of BALF and differential counts of macrophages, neutrophils, lymphocytes and eosinophils, respectively [40].
Pulmonary
interleukin-1β
(IL-1β)
and
tumor necrosis factor-α
(TNF-α)
gene expression
We measuredIL-1βandTNF-αgene expression as an indicator of pulmonary inflammation. Using frozen lung tissue collected at P7d and P56d, we performed total RNA extraction fol-lowed by cDNA synthesis and qPCR [40] to determine the gene expression ofIL-1βand
TNF-α(GenBank accession numbers NM_008361.3 and NM_013693.2, respectively; Sigma). At P7d, mRNA levels for the genes of interest were normalized against the housekeeping geneβ -actin(GenBank accession number NM_007393.3) using the comparative delta CT(cycle
threshold) method; at P56d, the mRNA levels were normalized against the housekeeping gene
18S rRNA(GenBank accession number NC_000072.6) [40]. Values were expressed as a fold-change relative to the mean mRNA levels of the Air group at the same age (P7d or P56d).
Lung morphometry
Lung tissue fraction and mean linear intercept (MLI; an indicator of alveolar size) were mea-sured using sections of lung parenchyma stained with Masson’s Trichrome. We used 30 fields of view per offspring (15 each from the left and right lungs) that were free of large conducting airways and major blood vessels. The tissue fraction and MLI were determined by superimpos-ing test grids over each field of view [43].
We assessed bronchiolar wall structure as bronchioles are an important determinant of lung function [44] by influencing airflow to and from the alveoli. Bronchioles selected for analysis appeared in near-circular cross-section and had an intact wall that lacked cartilage; selected bronchioles had a basement membrane perimeter (PBM) ranging from 200–1000μm
(approxi-mate diameter: 64–318μm). Bronchiolar wall variables were expressed in relation to the PBMto
adjust for differences in bronchiolar size [45]. Wall structure was analyzed for six bronchioles (3 per lung) from each offspring at P7d and ten bronchioles (5 per lung) from each offspring at P56d; the number of bronchioles analyzed was the maximum number that could be consis-tently obtained at each time-point that met the selection criteria. We used Masson’s Trichrome stained sections to determine the area of the bronchiolar epithelium [46] and the number of bronchiolar-alveolar attachments (NBA); both were expressed in relation to the PBM[46].
Bron-chiolar-alveolar attachments were measured because they provide mechanical support to bron-chioles [47]. Gordon and Sweet’s Reticular Fiber stain was used to determine the area of types I and III collagen fibers (identified by black staining) in the bronchiolar wall, expressed in rela-tion to the PBM[46]. Immunohistochemistry was performed to determine the proportions of
proliferating and ciliated cells in the bronchiolar epithelium, expressed in relation to the total number of bronchiolar epithelial cells, using the markers Ki67 and Foxj1, respectively, as previ-ously described [20]. Airway smooth muscle (ASM) in bronchioles was identified immunohis-tochemically using a primary antibody againstα-smooth muscle actin (α-SMA) [40]. The area ofα-SMA in the bronchiolar wall (identified by brown staining) was expressed in relation to the PBM.
Pulmonary expression of
collagen
and
α-SMA
genes
COL1α1,COL1α2andCOL3α1, and the smooth muscle markerα-SMA(GenBank accession numbers NM_007742.4, NM_007743.3, NM_009930.2 and NM_007392.3, respectively; Gene-Works). At P7d and P56d, the mRNA levels for the genes of interest were normalized against the housekeeping genesβ-actin(GenBank accession number NM_007393.3) and18S rRNA
(GenBank accession number NC_000072.6), respectively, using the comparative delta CT
(cycle threshold) method [40]. Values were expressed as a fold-change relative to the mean mRNA levels of the Air group at the same age (P7d or P56d).
Statistical analysis of data
Numerical data are expressed as mean ± SEM. Statistical outliers were identified using Grubbs’
outlier test and removed if detected (alpha = 0.05) [48]. The Shapiro-Wilk test was used to determine if data were normally distributed; if they were not, the data were transformed to produce a normally distributed population. Comparisons between groups were made using a two-way ANOVA, with treatment (ptreatment) and sex (psex) as factors. If the ANOVA showed statistical significance, a least significant differencepost-hoctest was performed to identify differences between individual treatment groups. Comparison between treatment groups for the volume of TJ or water consumed over time was made using two-way repeated measures ANOVA. TAC and gene expression ofIL-1β,TNF-α,COL1α1,COL1α2,COL3α1andα-SMA
were analyzed using a one-way ANOVA using treatment as a factor. Statistical significance was accepted at p<0.05.
Results
Consumption of tomato juice and water
The volumes of either TJ or water consumed by the dams between birth (P0d) and weaning (P21d) were not significantly different between treatment groups. The mean volume of liquids consumed by all mice (dams and offspring) over this period was 436.7 ± 59.5mL/day/kg body weight. Between weaning and P56d, the volume of either TJ or water consumed by the off-spring was not significantly different between groups. The mean volume of liquids consumed in all groups over this period was 261.9 ± 24.0mL/day/kg body weight.
Plasma and tomato juice carotenoid concentrations
The lycopene concentration in the plasma of the TJ groups was higher than in the non-TJ groups (Air, 0.0μg/L; Hyp, 0.0μg/L; Air+TJ, 4.6μg/L; Hyp+TJ, 6.1μg/L). The concentration of
lycopene in undiluted TJ was 40mg/L; therefore the concentration that was consumed was 20mg/L. Based on the mean volume of liquids consumed by all mice, the dose of TJ was 8.7 ± 1.2mg/day/kg body weight prior to weaning and 5.2 ± 0.5mg/day/kg body weight after weaning. Plasma concentrations of other carotenoids assayed (i.e.α-carotene,β-carotene, β-cryptoxanthin and lutein/zeaxanthin) were 0.0μg/L (i.e. undetectable) in all groups.
Total antioxidant capacity of lung tissue
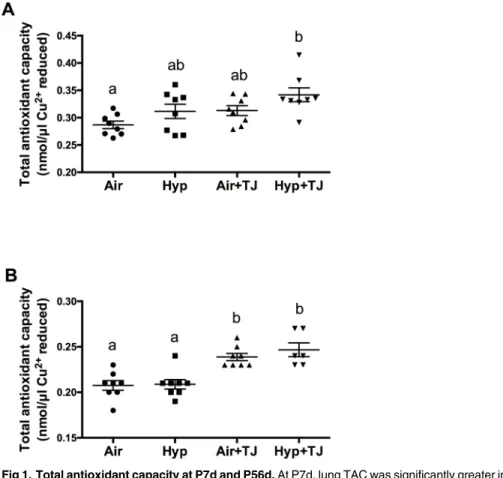
At P7d, the TAC of lung tissue was significantly greater in the Hyp+TJ group than in the Air group (p = 0.001), and there was a trend for it to be greater in the Air+TJ group than in the Air group (p = 0.096). Values (nmol/μl Cu2+reduced) were: Air, 0.29 ± 0.01; Hyp, 0.31 ± 0.01; Air
+TJ, 0.31 ± 0.01; Hyp+TJ, 0.34 ± 0.01 (Fig 1A). At P56d, the TAC of lung tissue was signifi-cantly greater in both TJ groups than in both non-TJ groups (p<0.001). Values (nmol/μl Cu2+
Oxidative stress in the lung
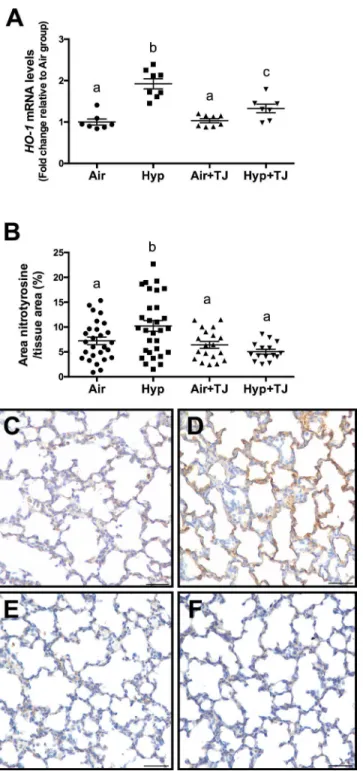
Heme oxygenase-1gene expression. At P7d, the relative gene expression ofHO-1was sig-nificantly greater in the hyperoxia groups than in the normoxia groups (p<0.001); however,
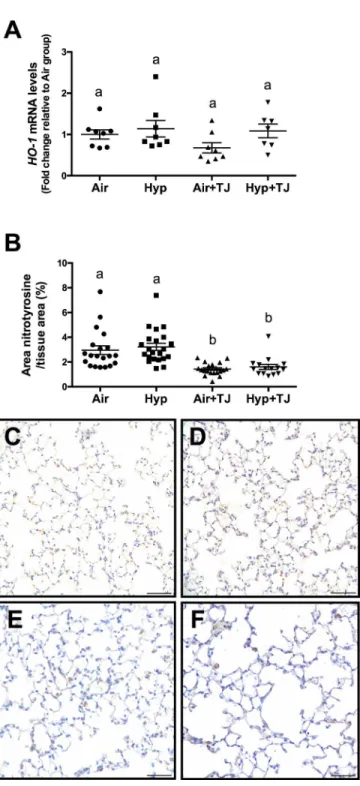
the relative gene expression ofHO-1was significantly lower in the Hyp+TJ group compared to the Hyp group (p = 0.000; Air, 1.0 ± 0.1; Hyp, 1.9 ± 0.1; Air+TJ, 1.0 ± 0.1; Hyp+TJ, 1.4 ± 0.1, Fig 2A). At P56d, there was no significant difference between groups in the relative gene expression ofHO-1(Air, 1.0 ± 0.2; Hyp, 1.1 ± 0.2; Air+TJ, 0.6 ± 0.2; Hyp+TJ, 1.2 ± 0.2,Fig 3A). No sex differences were observed at P7d or P56d.
Nitrotyrosine staining in lung tissue. At P7d, the area of nitrotyrosine staining, relative to the total area of lung parenchyma, was significantly greater in the Hyp group compared to the Air, Air+TJ and Hyp+TJ groups (p<0.001; Air, 7.2 ± 0.8%; Hyp, 10.0 ± 0.7%; Air+TJ,
6.7 ± 0.9%; Hyp+TJ, 5.0 ± 1.1%,Fig 2B–2F). At P56d, the relative area of nitrotyrosine staining was significantly greater in the non-TJ groups than in the groups consuming TJ (p<0.001; Air,
2.9 ± 0.3%; Hyp, 3.2 ± 0.3%; Air+TJ, 1.4 ± 0.3%; Hyp+TJ, 1.6 ± 0.3%,Fig 3B–3F). No sex differ-ences were observed at P7d or P56d.
Leukocytes and inflammatory markers in the lung
Galectin-3 staining in lung tissue at P7d. The proportion of cells in the lung parenchyma that were macrophages was significantly greater in the Hyp group than in the Air group Fig 1. Total antioxidant capacity at P7d and P56d.At P7d, lung TAC was significantly greater in the Hyp +TJ group than in the Air group (A). At P56d, lung TAC was significantly greater in both TJ groups than in both non-TJ groups (B). Data points represent values from individual animals. Values with different letters are significantly different from each other (p<0.05).
Fig 2. Oxidative stress markers at P7d.The relative gene expression ofheme oxygenase-1(HO-1) in lung tissue was significantly greater in the hyperoxia groups than in the normoxia groups (A). The relative gene expression ofHO-1was significantly lower in the Hyp+TJ group compared to the Hyp group (A). The area of nitrotyrosine staining in the lung parenchyma was significantly greater in the Hyp group than in other treatment groups (B). Data points represent values from individual animals. Values with different letters are significantly different from each other (p<0.05). Immunohistochemical images (C-F) of lung sections stained for nitrotyrosine (brown staining) are representative of lung parenchyma analyzed at P7d (C, Air;D, Hyp;E, Air+TJ;F, Hyp+TJ). Scale bar = 50μm.
(p = 0.004); it was significantly lower in the Air+TJ group than in the Air group (p = 0.032), and lower in the Hyp+TJ group compared to the Hyp group (p = 0.007). Values were: Air, Fig 3. Oxidative stress markers at P56d.The relative gene expression ofheme oxygenase-1(HO-1) was not significantly different between groups (A). The area of nitrotyrosine staining in the lung
parenchyma was significantly greater in non-TJ groups than in TJ groups (B). Data points represent values from individual animals. Values with different letters are significantly different from each other (p<0.05). Immunohistochemical images (C-F) of lung sections stained for nitrotyrosine (brown staining) are representative of lung parenchyma analyzed at P56d (C, Air;D, Hyp;E, Air+TJ;F, Hyp+TJ). Scale bar = 50μm.
1.7 ± 0.1%; Hyp, 2.2 ± 0.2%; Air+TJ, 1.2 ± 0.2%; Hyp+TJ, 1.6 ± 0.2% (Fig 4A–4E). No sex dif-ference was observed.
Leukocytes in bronchoalveolar lavage fluid at P56d. The total number of leukocytes per mL of BALF was significantly greater in the hyperoxia groups than in the normoxia groups (p<0.01). There were 150% more leukocytes in the Hyp group compared to the Air group
(p = 0.004) and 109% more in the Hyp+TJ group compared to the Air+TJ group (p = 0.006). Values were: Air, 9,238 ± 1,304 cells/mL; Hyp, 23,119 ± 3,453 cells/mL; Air+TJ, 12,371 ± 2,130 cells/mL; Hyp+TJ, 25,878 ± 4,054 cells/mL (Fig 5A). No sex difference was observed.
Enumeration of the different populations of leukocytes in BALF showed that there were no significant differences between treatment groups for the proportion of macrophages (overall mean, 98.93 ± 0.25%), lymphocytes (overall mean, 0.48 ± 0.09%) or neutrophils (overall mean, 0.59 ± 0.21%) (Fig 5B–5D, respectively). No eosinophils were observed in any of the treatment groups. No sex differences were observed.
Fig 4. Macrophages in lung tissue at P7d.The proportion of macrophages (galectin-3 positive cells) in the lung parenchyma was significantly greater in the Hyp group than in the Air group; the proportion of
macrophages was not significantly different between the two TJ groups (A). Data points represent values from individual animals. Values with different letters are significantly different from each other (p<0.05). Immunofluorescent images (B-E) of lung sections stained for galectin-3 (red staining) are representative of lung parenchyma analyzed at P7d (B, Air;C, Hyp;D, Air+TJ;E, Hyp+TJ). Scale bar = 30μm.
IL-1βandTNF-αgeneexpression in lung tissue at P7d and P56d. At P7d, there was a tendency for the mRNA expression ofIL-1βto be lower in the Air+TJ group than in the other three treatment groups; however, this did not reach statistical significance (p = 0.081; Air, Fig 5. Leukocytes and inflammatory markers in the lung at P56d.The number of leukocytes in bronchoalveolar lavage fluid (BALF) was significantly greater in the hyperoxia groups than in the normoxia groups (A). The proportions of macrophages (B), lymphocytes (C) and neutrophils (D) in BALF were not significantly different between the groups. The mRNA expression ofIL-1βwas significantly lower in the Hyp, Air+TJ and Hyp +TJ groups than in the Air group (E). The mRNA expression ofTNF-αwas significantly greater in the Hyp+TJ group than in the Air, Hyp and Air+TJ groups (F). Data points represent values from individual animals. Values with different letters are significantly different from each other (p<0.05).
1.0 ± 0.1; Hyp, 1.1 ± 0.2; Air+TJ, 0.6 ± 0.2; Hyp+TJ, 0.9 ± 0.2,S1A Fig). The mRNA expression ofTNF-αwas not significantly different between the treatment groups (S1B Fig). Values were: Air, 1.0 ± 0.2; Hyp, 1.2 ± 0.2; Air+TJ, 0.8 ± 0.1; Hyp+TJ, 0.8 ± 0.2.
At P56d, the mRNA expression ofIL-1βwas significantly lower in the Hyp, Air+TJ and Hyp+TJ groups compared to the Air group (p = 0.021; Air, 1.0 ± 0.2; Hyp, 0.4 ± 0.1; Air+TJ, 0.5 ± 0.1; Hyp+TJ, 0.5 ± 0.1,Fig 5E). The mRNA expression ofTNF-αwas significantly greater in the Hyp+TJ group compared to the Air, Hyp and Air+TJ groups (p<0.001; Air, 1.0 ± 0.2;
Hyp, 0.8 ± 0.1; Air+TJ, 0.8 ± 0.2; Hyp+TJ, 1.6 ± 0.4,Fig 5F).
Lung morphometry
Tissue fraction. At P7d, lung tissue fraction was significantly lower in the hyperoxia groups than in the normoxia groups (p<0.001;Table 1,S2A Fig). At P56d, the tissue fraction
was significantly greater in the TJ groups compared to the non-TJ groups (p<0.001;Table 2,
S4A Fig). No differences were observed between sexes at P7d or P56d.
Mean linear intercept. At P7d, the MLI was significantly greater in the hyperoxia groups compared to the normoxia groups (p<0.001;Table 1,S2B Fig). At P56d, differences in MLI
were no longer apparent (Table 2,S4B Fig). No sex differences were observed at P7d or P56d.
Bronchiolar-alveolar attachments. At P7d, the NBA, relative to PBM, was significantly
lower in the hyperoxia groups than in the normoxia groups (p<0.001;Table 1,S2C Fig). The
NBAin the Hyp+TJ group was further decreased compared to the Hyp group (p = 0.001;
Table 1,S2C Fig). At P56d, NBAwas significantly greater in the Air+TJ group compared to the
Air group, and lower in the Hyp+TJ group compared to the Air+TJ group (p<0.01;Table 2,
S4C Fig). No sex differences were observed at P7d or P56d.
Bronchiolar epithelium. At P7d and P56d, the bronchiolar epithelial area was not signifi-cantly different between groups (Tables1and2;S2DandS4DFigs, respectively) or sexes. At P7d, the proportion of epithelial cells undergoing proliferation was significantly greater in the Hyp, Air+TJ and Hyp+TJ groups than in the Air group (p<0.01;Table 1,S2E Fig). Sex (psex=
0.011; males, 19.9 ± 1.4%; females, 22.6 ± 0.9%) and sex-treatment interaction (psextreatment= Table 1. Lung morphometry at P7d.
Air Hyp Air+TJ Hyp+TJ
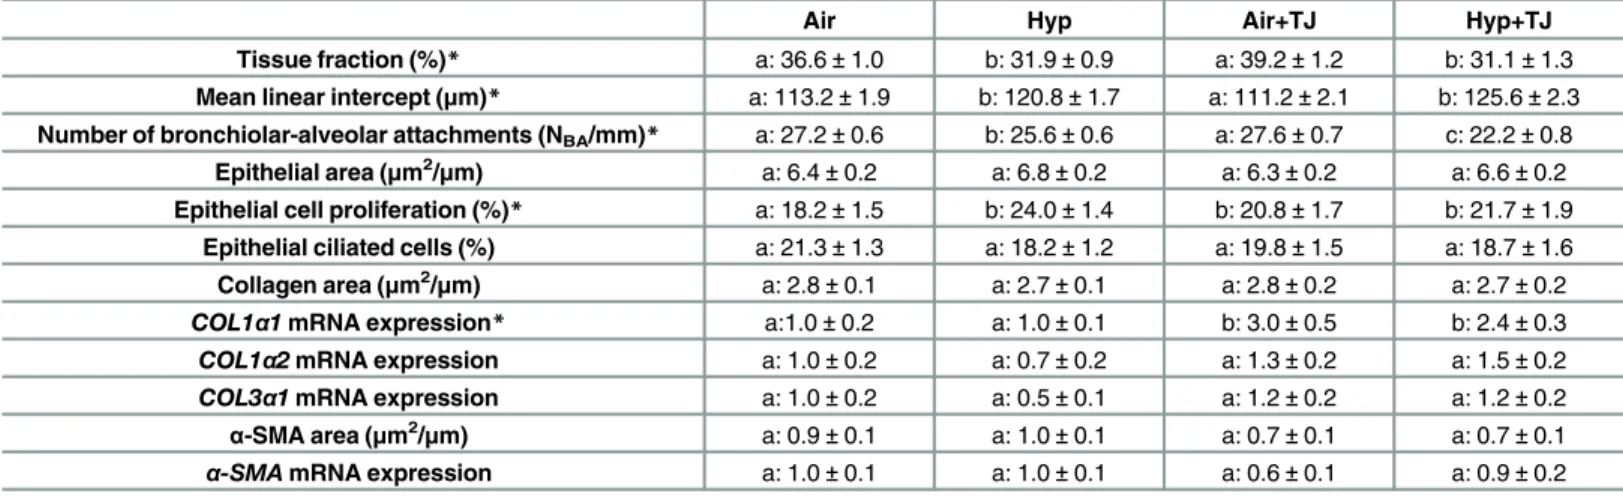
Tissue fraction (%)* a: 36.6±1.0 b: 31.9±0.9 a: 39.2±1.2 b: 31.1±1.3 Mean linear intercept (μm)* a: 113.2±1.9 b: 120.8±1.7 a: 111.2±2.1 b: 125.6±2.3 Number of bronchiolar-alveolar attachments (NBA/mm)* a: 27.2±0.6 b: 25.6±0.6 a: 27.6±0.7 c: 22.2±0.8
Epithelial area (μm2/μm) a: 6.4±0.2 a: 6.8±0.2 a: 6.3±0.2 a: 6.6±0.2
Epithelial cell proliferation (%)* a: 18.2±1.5 b: 24.0±1.4 b: 20.8±1.7 b: 21.7±1.9 Epithelial ciliated cells (%) a: 21.3±1.3 a: 18.2±1.2 a: 19.8±1.5 a: 18.7±1.6 Collagen area (μm2/μm) a: 2.8±0.1 a: 2.7±0.1 a: 2.8±0.2 a: 2.7±0.2 COL1α1mRNA expression* a:1.0±0.2 a: 1.0±0.1 b: 3.0±0.5 b: 2.4±0.3 COL1α2mRNA expression a: 1.0±0.2 a: 0.7±0.2 a: 1.3±0.2 a: 1.5±0.2
COL3α1mRNA expression a: 1.0±0.2 a: 0.5±0.1 a: 1.2±0.2 a: 1.2±0.2
α-SMA area (μm2/μm) a: 0.9±0.1 a: 1.0±0.1 a: 0.7±0.1 a: 0.7±0.1
α-SMAmRNA expression a: 1.0±0.1 a: 1.0±0.1 a: 0.6±0.1 a: 0.9±0.2
Morphometric data for lung tissue fraction, mean linear intercept, number of bronchiolar-alveolar attachments, bronchiolar epithelial area, percentage of proliferating and ciliated cells in the bronchiolar epithelium, area of collagen andα-smooth muscle actin (α-SMA) in the outer bronchiolar wall and mRNA expression ofCOL1α1,COL1α2,COL3α1andα-SMAin lung tissue at P7d. Values are mean±SEM. An asterisk (*) denotes a significant difference between the treatment groups (p<0.05). Values with different letters (before the value) are significantly different from each other.
0.040) effects were observed, with females in the Air (males, 15.4 ± 2.9%; females, 21.0 ± 2.2%) and Hyp+TJ (males, 18.4 ± 2.4%; females, 24.9 ± 1.8%) groups having greater epithelial cell proliferation than males. No significant differences were observed between the sexes in the Hyp and Air+TJ groups. At P56d, the proportion of proliferating epithelial cells did not differ between treatment groups (Table 2,S4E Fig) and no sex difference was observed. At P7d, there were no significant differences between groups in the proportion of ciliated epithelial cells (Table 1,S2F Fig). At P56d, the proportion of ciliated epithelial cells was significantly lower in the TJ groups than in the non-TJ groups (p<0.001;Table 2,S4F Fig). No sex differences were
observed at P7d and P56d.
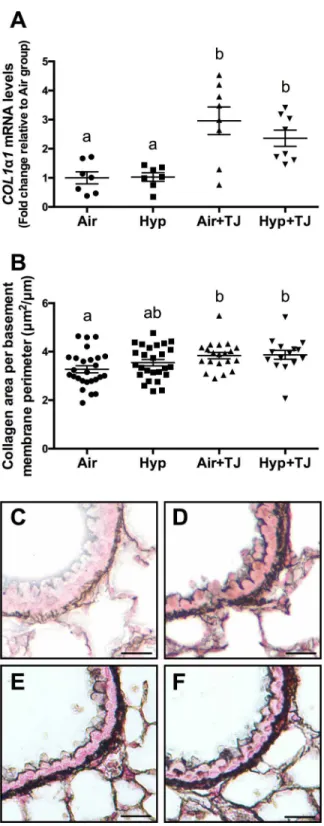
Bronchiolar and pulmonary collagen. At P7d, the area of collagen in the outer bronchio-lar wall did not significantly differ between groups (Table 1,S2G Fig) and no difference was observed between sexes. The gene expression ofCOL1α1in lung tissue at P7d was significantly greater in the TJ groups than in the non-TJ groups (p<0.001;Table 1,Fig 6A). There was a
ten-dency for the gene expression ofCOL1α2(p = 0.062) andCOL3α1(p = 0.052) to be greater in the TJ groups compared to the Hyp group, but this did not reach statistical significance (Table 1,S3A and S3B Fig). At P56d, the area of collagen in the outer bronchiolar wall in the TJ groups was significantly greater than in the Air group (p<0.05;Table 2,Fig 6B–6F). Collagen
area was significantly greater in females than in males (psex= 0.026; males, 3.5 ± 0.2μm2/μm;
females, 3.8 ± 0.1μm2/μm). The gene expression ofCOL1α1,COL1α2andCOL3α1in lung
tis-sue was not significantly different between groups at P56d (Table 2,S5A–S5C Fig).
Bronchiolar and pulmonaryα-SMA. At P7d, the area ofα-SMA in the outer bronchiolar wall and the gene expression ofα-SMAin lung tissue did not significantly differ between groups (Table 1,S2HandS3CFigs, respectively). At P56d, the Hyp group had significantly more smooth muscle in the outer bronchiolar wall than the other groups (p<0.001;Table 2,
Fig 7). No significant sex differences in the area ofα-SMA in the outer bronchiolar wall were observed at P7d or P56d. There was a tendency (p = 0.086) for the gene expression ofα-SMA
to be greater in the Hyp+TJ group than in the Hyp group, but this did not reach statistical sig-nificance (Table 2,S5D Fig).
Table 2. Lung morphometry at P56d.
Air Hyp Air+TJ Hyp+TJ
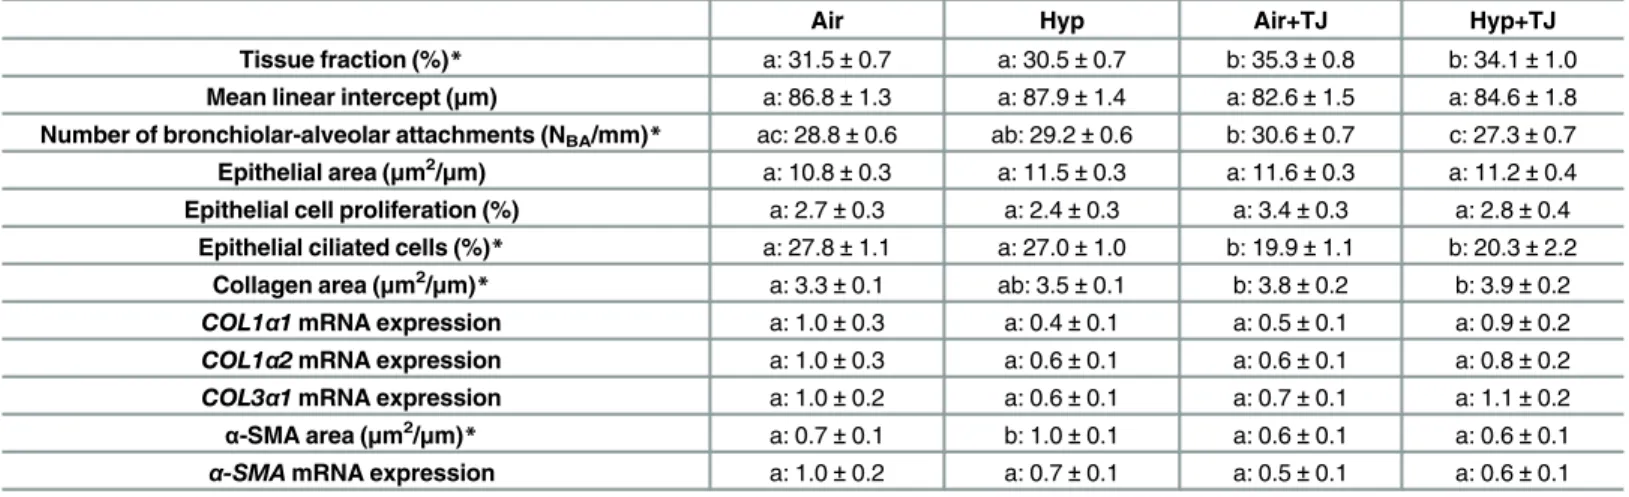
Tissue fraction (%)* a: 31.5±0.7 a: 30.5±0.7 b: 35.3±0.8 b: 34.1±1.0 Mean linear intercept (μm) a: 86.8±1.3 a: 87.9±1.4 a: 82.6±1.5 a: 84.6±1.8 Number of bronchiolar-alveolar attachments (NBA/mm)* ac: 28.8±0.6 ab: 29.2±0.6 b: 30.6±0.7 c: 27.3±0.7 Epithelial area (μm2/μm) a: 10.8±0.3 a: 11.5±0.3 a: 11.6±0.3 a: 11.2±0.4
Epithelial cell proliferation (%) a: 2.7±0.3 a: 2.4±0.3 a: 3.4±0.3 a: 2.8±0.4 Epithelial ciliated cells (%)* a: 27.8±1.1 a: 27.0±1.0 b: 19.9±1.1 b: 20.3±2.2
Collagen area (μm2/μm)* a: 3.3±0.1 ab: 3.5±0.1 b: 3.8±0.2 b: 3.9±0.2
COL1α1mRNA expression a: 1.0±0.3 a: 0.4±0.1 a: 0.5±0.1 a: 0.9±0.2 COL1α2mRNA expression a: 1.0±0.3 a: 0.6±0.1 a: 0.6±0.1 a: 0.8±0.2
COL3α1mRNA expression a: 1.0±0.2 a: 0.6±0.1 a: 0.7±0.1 a: 1.1±0.2
α-SMA area (μm2/μm)* a: 0.7±0.1 b: 1.0±0.1 a: 0.6±0.1 a: 0.6±0.1
α-SMAmRNA expression a: 1.0±0.2 a: 0.7±0.1 a: 0.5±0.1 a: 0.6±0.1
Morphometric data for lung tissue fraction, mean linear intercept, number of bronchiolar-alveolar attachments, bronchiolar epithelial area, percentage of proliferating and ciliated cells in the bronchiolar epithelium, area of collagen andα-smooth muscle actin (α-SMA) in the outer bronchiolar wall and mRNA expression ofCOL1α1,COL1α2,COL3α1andα-SMAin lung tissue at P56d. Values are mean±SEM. An asterisk (*) denotes a significant difference between the treatment groups (p<0.05). Values with different letters (before the value) are significantly different from each other.
Fig 6. Collagen expression in the lung at P7d and P56d.The mRNA expression ofCOL1α1in lung tissue at P7d was significantly greater in the TJ groups compared to the non-TJ groups (A). The area of collagen in the outer bronchiolar wall at P56d was significantly greater in the TJ groups compared to the Air group (B). Data points represent values from individual animals and values with different letters are significantly different from each other (p<0.05). Representative images of lung sections stained for collagen (black staining) are representative of the bronchioles analyzed at P56d (C, Air;D, Hyp;E, Air+TJ;F, Hyp+TJ). Scale bar = 10μm.
Discussion
Our study shows that ingestion of TJ attenuates some of the adverse effects of neonatal inhala-tion of hyperoxic gas. At P7d, TJ ameliorated the hyperoxia-induced increases in the oxidative stress marker nitrotyrosine and in the proportion of macrophages in lung tissue. At P56d, TJ consumption led to increased TAC of the lung tissue and ameliorated the hyperoxia-induced increase in ASM.
Antioxidant concentrations
Few experimental studies [34,35,49,50] have examined the protective effects of multiple die-tary antioxidants on induced alterations in lung development. We used TJ to protect against hyperoxia-induced lung injury, as it is reportedly a readily available source of multiple antioxi-dants that could potentially be administered to preterm infants [31]. The TJ we used had a measured lycopene concentration of 40mg/L; therefore, the diluted TJ provided to the animals had a lycopene concentration of 20mg/L, which equated to an approximate dose of 7mg/day/ Fig 7. The area of smooth muscle in the outer bronchiolar wall at P56d.The area of smooth muscle was significantly greater in the Hyp group compared to the other treatment groups (A). Data points represent values from individual animals and values with different letters are significantly different from each other (p<0.05). Immunohistochemical images (B-E) of lung sections stained forα-SMA (brown staining) are representative of the bronchioles analyzed at P56d (B, Air;C, Hyp;D, Air+TJ;E, Hyp+TJ). Scale bar = 10μm.
kg body weight and led to a plasma lycopene concentration of 5-6ng/L at P56d. The calculated dose of lycopene in our study is equivalent to that used in a previous study that showed a signif-icant protective effect of lycopene supplementation on allergic inflammation in a mouse model of allergic airways disease [51]. There is little evidence regarding the plasma antioxidant con-centrations required to exert significant effectsin vivo. Although other carotenoids were not detected in the plasma of supplemented mice, TJ increased the TAC of small antioxidant mole-cules in lung tissue; this increase could be due to antioxidants other than lycopene being increased, especially vitamin C as it reportedly has a concentration of 300mg/L in undiluted TJ, which would equate to an approximate dose of 52mg/day/kg body weight. Our TJ dosing regi-men was chosen as it could potentially be given to preterm infants and has been shown to pro-tect neonatal rats from nicotine-induced changes in lung archipro-tecture, which are largely due to oxidative stress [35]. In future, it may be beneficial to alter the route or timing of TJ administra-tion to further increase the plasma concentraadministra-tions of antioxidants in TJ, including lycopene and vitamins A, C and E.
Total antioxidant capacity of lung tissue
We conducted a TAC assay to determine whether TJ led to a functional increase in the TAC of small antioxidant molecules within the lung. At P7d, TAC was significantly greater in the Hyp +TJ group than in the Air group, and there was a tendency for TAC to be increased in the Air +TJ group. These results show that maternal TJ ingestion increases pulmonary TAC in suck-ling offspring, confirming that the ingested antioxidants are transferred across the placenta and/or are present within the breast milk of the dam. At P56d, the TAC of lung tissue was sig-nificantly greater in both of the TJ groups compared to the non-TJ groups. Together, the results obtained at P7d and P56d suggest that dietary TJ increased the lung’s ability to reduce ROS. Furthermore, this increase in TAC was related to evidence of significantly lower oxidative stress in the lungs, as discussed below.
Oxidative stress in the lung
It is well established that hyperoxia leads to oxidative stress within the lung [49,52–54], and our observations confirm this effect as there was increased oxidative stress in the Hyp group at P7d. Importantly,HO-1was decreased in the Hyp+TJ group compared to the Hyp group, and the hyperoxia-induced increase in nitrotyrosine was inhibited by TJ. Further, a recent study has shown that dietary supplementation with vitamin A and retinoic acid attenuates hyper-oxia-induced oxidative stress in the lung [49]. In contrast, the use of single antioxidants is largely ineffective at reducing hyperoxia-induced oxidative stress within the lung [55,56]. It appears therefore that multiple dietary antioxidants are more effective in reducing ROS, and hence oxidative stress, than single antioxidants.
Leukocytes and inflammatory markers in the lung
At P7d, we found a greater proportion of macrophages in the lung parenchyma in the Hyp group than in the Air group. This is consistent with other studies showing that neonatal hyper-oxia leads to an increase in pulmonary leukocytes, including macrophages, immediately after exposure [15,59]. However, our Hyp+TJ group did not have an increased proportion of mac-rophages compared to the Air or Air+TJ groups, suggesting that TJ may protect the lung from the hyperoxia-induced influx of macrophages immediately following exposure. Interestingly, in the Air+TJ group, the proportion of macrophages was reduced, suggesting that TJ affects pulmonary immune cell number under normal physiological conditions, which may impair innate immunity. To further characterize the immune response at P7d, we analyzed the gene expression of the pro-inflammatory markersIL-1βandTNF-αin lung tissue. The finding that there was no significant difference in the expression ofIL-1βorTNF-αbetween treatment groups was unexpected as macrophages are a major source ofIL-1βandTNF-αin the lung [60, 61] and are an essential component of host defense. However, as we did not interrogate macro-phage phenotype and function in the present study, the different proportions of macromacro-phages found between treatment groups could be due to cytokines other thanIL-1βorTNF-αbeing differentially expressed.
At P56d, we confirmed that neonatal hyperoxia increased the concentration of leukocytes in BALF [40], and that this effect was not ameliorated by TJ. We also found that the gene expres-sion ofIL-1βwas lower in the Hyp, Air+TJ and Hyp+TJ groups than in the Air group and the gene expression ofTNF-αwas greater in the Hyp+TJ group than in the other three treatment groups. AsTNF-αis known to play a role in M1 differentiation, the macrophage population in the Hyp+TJ group may be skewed towards a M1 phenotype, indicating a potentially detrimen-tal increase in inflammation [62]. Taken together, it appears that TJ did not attenuate the long-term pulmonary inflammatory response to neonatal hyperoxia and may have increased part of the inflammatory response.
Lung morphometry
Our findings on the effects of hyperoxia on lung tissue fraction, MLI and bronchiolar-alveolar attachments are consistent with previous studies [15,18,38,63]. We confirm that neonatal inhalation of 65% O2inhibits alveolarization, and suggest that TJ does not protect the lung
from the adverse effects of hyperoxia on alveolarization. Our results show that the early mor-phometric effects of hyperoxia (65% O2) do not persist to adulthood, apart from a reduction in
the number of bronchiolar-alveolar attachments in the Hyp+TJ group. Overall, our findings indicate recovery from the hyperoxia-induced inhibition of alveolarization by adulthood and suggest that TJ may adversely affect the ability of alveolarization to recover from early impairment. As previous studies have observed changes in lung function in adulthood follow-ing exposure to neonatal hyperoxia [19], further studies are required to determine whether TJ alters lung function.
Our findings suggest that TJ does not prevent hyperoxia-induced proliferation of bronchio-lar epithelial cells at P7d. As the observed increase in bronchiobronchio-lar epithelial cell proliferation was not accompanied by an increase in epithelial area, it is possible that the rate of epithelial cell apoptosis was increased, leading to increased cell turnover. At P56d, the proportion of cili-ated epithelial cells was decreased in both of the TJ groups, suggesting that TJ alone, but not hyperoxia, could be causing this effect. Thus, the TJ supplemented mice may have had a reduced ability to move mucus along their airways.
increase in collagen was unexpected and could be detrimental to lung function as increased col-lagen is indicative of pulmonary fibrosis [64] and is observed in asthmatics [65].
An increase in bronchiolar smooth muscle was observed in the Hyp group at P56d, relative to the Air and Hyp+TJ groups. This increased bronchiolar smooth muscle was not accompa-nied by an increase in the gene expression ofα-SMAat either P7d or P56d; this finding may have been becauseα-SMA deposition was only measured in the outer airway wall whereasα -SMAgene expression was measured in samples of whole lung tissue. The observed increase in ASM in adult mice following neonatal hyperoxia is consistent with previous studies [17,19,66, 67]. Increased ASM is a hallmark feature of BPD [68] and is also implicated in the pathogenesis of obstructive lung diseases, especially asthma [69]. As our data indicate that TJ may prevent the persistent increase in ASM induced by neonatal hyperoxia, it could be beneficial in the management of very preterm infants who are at risk of developing BPD and asthma later in life [1,70].
Effects of TJ alone on lung development
Our study revealed differences between the Air and Air+TJ groups at P7d and P56d, suggesting that TJ alone may alter lung development. The potentially adverse effects of TJ observed at P56d may be due to the long duration of TJ ingestion. Our findings suggest that TJ alone can alter cellular and structural development of the lungs, including increasing lung tissue fraction and collagen deposition, and markers of oxidative stress and inflammation under physiological conditions. Therefore, it is plausible that a reduction in ROS resulting from TJ ingestion during normal physiological conditions could adversely affect lung development.
Conclusions
We conclude that, although TJ does not ameliorate hyperoxia-induced alterations in lung architecture immediately following exposure, it has the beneficial effects of increasing TAC and attenuating the hyperoxia-induced influx of macrophages and increase in oxidative stress in the lungs. Importantly, TJ also protected hyperoxia-exposed lungs from a persistent increase in bronchiolar smooth muscle. However, TJ may alter the persistent pulmonary inflammatory response to neonatal hyperoxia, and it appears that TJ alone adversely affects some aspects of lung cellular and architectural development, redox balance and innate immunity, and may induce fibrosis. In view of the potentially adverse effects of TJ observed in our study, future studies could trial lower dosages, different dosing regimens or other routes of administration.
Supporting Information
S1 Fig. Gene expression ofIL-1βandTNF-αat P7d.mRNA expression ofIL-1β(A) and
TNF-α(B) in lung tissue. Data points represent values from individual animals. Values with the same letter are not significantly different from each other (p<0.05).
(PDF)
S2 Fig. Structural analysis of lung morphometry at P7d.Morphometric analyses of tissue fraction (A), mean linear intercept (B), the number of bronchiolar-alveolar attachments (C), the bronchiolar epithelial area (D), proportion of proliferating (E) and ciliated (F) cells in the bronchiolar epithelium, bronchiolar collagen content (G), and bronchiolarα-SMA content (H). Data points represent values from individual animals. Values with different letters are sig-nificantly different from each other (p<0.05).
S3 Fig. Gene expression of collagen and smooth muscle markers at P7d.mRNA expression ofCOL1α2(A),COL3α1(B) andα-SMA(C) in lung tissue. Data points represent values from individual animals. Values with the same letter are not significantly different from each other (p<0.05).
(PDF)
S4 Fig. Structural analysis of lung morphometry at P56d.Morphometric analyses of tissue fraction (A), mean linear intercept (B), the number of bronchiolar-alveolar attachments (C), the bronchiolar epithelial area (D) and proportion of proliferating (E) and ciliated (F) cells in the bronchiolar epithelium. Data points represent values from individual animals. Values with different letters are significantly different from each other (p<0.05).
(PDF)
S5 Fig. Gene expression of collagen and smooth muscle markers at P56d.mRNA expression ofCOL1α1(A),COL1α2(B),COL3α1(C) andα-SMA(D) in lung tissue. Data points represent values from individual animals. Values with the same letter are not significantly different from each other (p<0.05).
(PDF)
Acknowledgments
The authors wish to acknowledge Ms N Blasch, Ms J Ng, Dr A Thorburn and Associate Profes-sor J de Haan for their advice and assistance. The authors thank Dr A D Bird and ProfesProfes-sor T Cole for their donation of immunohistochemical antibodies.
Author Contributions
Conceived and designed the experiments: SB RH MOR FS. Performed the experiments: SB MOR LGW FS. Analyzed the data: SB LGW FS. Contributed reagents/materials/analysis tools: RH LGW. Wrote the paper: SB RH MOR LGW FS.
References
1. Clark RH, Gerstmann DR, Jobe AH, Moffitt ST, Slutsky AS, Yoder BA. Lung injury in neonates: causes, strategies for prevention, and long-term consequences. J Pediatr. 2001; 139(4):478–86. PMID:
11598592
2. Farstad T, Bratlid D, Medbo S, Markestad T, Norwegian Extreme Prematurity Study G. Bronchopul-monary dysplasia—prevalence, severity and predictive factors in a national cohort of extremely
prema-ture infants. Acta Paediatr. 2011; 100(1):53–8. doi:10.1111/j.1651-2227.2010.01959.xPMID:
20653607
3. Ambalavanan N, Carlo WA, D'Angio CT, McDonald SA, Das A, Schendel D, et al. Cytokines associated with bronchopulmonary dysplasia or death in extremely low birth weight infants. Pediatrics. 2009; 123 (4):1132–41. doi:10.1542/peds.2008-0526PMID:19336372
4. Speer CP. Pulmonary inflammation and bronchopulmonary dysplasia. J Perinatol. 2006; 26 Suppl 1: S57–62; discussion S3-4. PMID:16625227
5. Gross SJ, Iannuzzi DM, Kveselis DA, Anbar RD. Effect of preterm birth on pulmonary function at school age: a prospective controlled study. J Pediatr. 1998; 133(2):188–92. PMID:9709704
6. Coalson JJ. Pathology of new bronchopulmonary dysplasia. Semin Neonatol. 2003; 8(1):73–81. PMID:
12667832
7. Korhonen P, Laitinen J, Hyodynmaa E, Tammela O. Respiratory outcome in school-aged, very-low-birth-weight children in the surfactant era. Acta Paediatr. 2004; 93(3):316–21. PMID:15124832
8. Doyle LW, Faber B, Callanan C, Freezer N, Ford GW, Davis NM. Bronchopulmonary dysplasia in very low birth weight subjects and lung function in late adolescence. Pediatrics. 2006; 118(1):108–13.
9. Doyle LW. Respiratory function at age 8–9 years in extremely low birthweight/very preterm children
born in Victoria in 1991–1992. Pediatr Pulmonol. 2006; 41(6):570–6. PMID:16617453
10. Been JV, Lugtenberg MJ, Smets E, van Schayck CP, Kramer BW, Mommers M, et al. Preterm birth and childhood wheezing disorders: a systematic review and meta-analysis. PLoS Med. 2014; 11(1): e1001596. doi:10.1371/journal.pmed.1001596PMID:24492409
11. Kilbride HW, Gelatt MC, Sabath RJ. Pulmonary function and exercise capacity for ELBW survivors in preadolescence: effect of neonatal chronic lung disease. J Pediatr. 2003; 143(4):488–93. PMID:
14571227
12. Smith LJ, van Asperen PP, McKay KO, Selvadurai H, Fitzgerald DA. Reduced exercise capacity in chil-dren born very preterm. Pediatrics. 2008; 122(2):e287–93. doi:10.1542/peds.2007-3657PMID:
18676514
13. Chow SSW. Report on the Australian and New Zealand Neonatal Newtwork, Sydney, 2011. 2013. 14. Trembath A, Laughon MM. Predictors of bronchopulmonary dysplasia. Clin Perinatol. 2012; 39(3):585–
601. doi:10.1016/j.clp.2012.06.014PMID:22954271
15. Warner BB, Stuart LA, Papes RA, Wispe JR. Functional and pathological effects of prolonged hyper-oxia in neonatal mice. Am J Physiol. 1998; 275(1 Pt 1):L110–7.
16. McGrath-Morrow SA, Stahl J. Apoptosis in neonatal murine lung exposed to hyperoxia. Am J Respir Cell Mol Biol. 2001; 25(2):150–5. PMID:11509323
17. Denis D, Fayon MJ, Berger P, Molimard M, De Lara MT, Roux E, et al. Prolonged moderate hyperoxia induces hyperresponsiveness and airway inflammation in newborn rats. Pediatr Res. 2001; 50(4):515–
9. PMID:11568296
18. Yee M, Chess PR, McGrath-Morrow SA, Wang Z, Gelein R, Zhou R, et al. Neonatal oxygen adversely affects lung function in adult mice without altering surfactant composition or activity. Am J Physiol Lung Cell Mol Physiol. 2009; 297(4):L641–9. doi:10.1152/ajplung.00023.2009PMID:19617311
19. O'Reilly M, Hansbro PM, Horvat JC, Beckett EL, Harding R, Sozo F. Bronchiolar remodeling in adult mice following neonatal exposure to hyperoxia: relation to growth. Anat Rec. 2014; 297(4):758–69.
20. O'Reilly M, Harding R, Sozo F. Altered small airways in aged mice following neonatal exposure to hyperoxic gas. Neonatology. 2014; 105(1):39–45. doi:10.1159/000355641PMID:24281398
21. Berger J, Bhandari V. Animal models of bronchopulmonary dysplasia. I: The term mouse models. Am J Physiol Lung Cell Mol Physiol. 2014.
22. Mantell LL, Horowitz S, Davis JM, Kazzaz JA. Hyperoxia-induced cell death in the lung: the correlation of apoptosis, necrosis, and inflammation. Ann N Y Acad Sci. 1999; 887:171–80. PMID:10668473
23. Davis JM, Auten RL. Maturation of the antioxidant system and the effects on preterm birth. Semin Fetal Neonatal Med. 2010; 15(4):191–5. doi:10.1016/j.siny.2010.04.001PMID:20452845
24. Lee JW, Davis JM. Future applications of antioxidants in premature infants. Curr Opin Pediatr. 2011; 23 (2):161–6. doi:10.1097/MOP.0b013e3283423e51PMID:21150443
25. Poggi C, Dani C. Antioxidant strategies and respiratory disease of the preterm newborn: an update. Oxid Med Cellr Longev. 2014; 2014:721043.
26. Erdman JW, Ford NA, Lindshield BL. Are the health attributes of lycopene related to its antioxidant func-tion? Arch Biochem Biophys. 2009; 483(2):229–35. doi:10.1016/j.abb.2008.10.022PMID:18983972
27. Tyson JE, Wright LL, Oh W, Kennedy KA, Mele L, Ehrenkranz RA, et al. Vitamin A supplementation for extremely-low-birth-weight infants. National Institute of Child Health and Human Development Neona-tal Research Network. N Engl J Med. 1999; 340(25):1962–8. PMID:10379020
28. Brion LP, Bell EF, Raghuveer TS. Vitamin E supplementation for prevention of morbidity and mortality in preterm infants. Cochrane Database Syst Rev. 2003;(3: ):Cd003665. PMID:12917978
29. Berger TM, Frei B, Rifai N, Avery ME, Suh J, Yoder BA, et al. Early high dose antioxidant vitamins do not prevent bronchopulmonary dysplasia in premature baboons exposed to prolonged hyperoxia: a pilot study. Pediatr Res. 1998; 43(6):719–26. PMID:9621979
30. Berkelhamer SK, Farrow KN. Developmental regulation of antioxidant enzymes and their impact on neonatal lung disease. Antioxid Redox Signal. 2014; 21(13):1837–48. doi:10.1089/ars.2013.5515
PMID:24295375
31. Shi J, Le Maguer M. Lycopene in tomatoes: chemical and physical properties affected by food process-ing. Crit Rev Biotechnol. 2000; 20(4):293–334. PMID:11192026
32. Landete JM. Dietary intake of natural antioxidants: vitamins and polyphenols. Crit Rev Food Sci Nutr. 2013; 53(7):706–21. doi:10.1080/10408398.2011.555018PMID:23638931
34. Wood LG, Garg ML, Powell H, Gibson PG. Lycopene-rich treatments modify noneosinophilic airway inflammation in asthma: proof of concept. Free Radic Res. 2008; 42(1):94–102. doi:10.1080/
10715760701767307PMID:18324527
35. Maritz G, Mutemwa M, Kayigire A. Tomato juice protects the lungs of the offspring of female rats exposed to nicotine during gestation and lactation Pediatr Pulmonol. 2011; 46(10):976–86.
36. Carey MA, Card JW, Voltz JW, Arbes SJ Jr., Germolec DR, Korach KS, et al. It's all about sex: gender, lung development and lung disease. Trends Endocrinol and Metab. 2007; 18(8):308–13.
37. Barua AB, Kostic D, Olson JA. New simplified procedures for the extraction and simultaneous high-per-formance liquid chromatographic analysis of retinol, tocopherols and carotenoids in human serum. J Chromatogr. 1993; 617(2):257–64. PMID:8408391
38. McGrath-Morrow SA, Cho C, Soutiere S, Mitzner W, Tuder R. The effect of neonatal hyperoxia on the lung of p21Waf1/Cip1/Sdi1-deficient mice. Am J Respir Cell Mol Biol. 2004; 30(5):635–40. PMID:
14607813
39. van der Vliet A, Eiserich JP, Halliwell B, Cross CE. Formation of reactive nitrogen species during perox-idase-catalyzed oxidation of nitrite. A potential additional mechanism of nitric oxide-dependent toxicity. J Biol Chem. 1997; 272(12):7617–25. PMID:9065416
40. Bouch S, O'Reilly M, Harding R, Sozo F. Neonatal exposure to mild hyperoxia causes persistent increases in oxidative stress and immune cells in the lungs of mice without altering lung structure. Am J Physiol Lung Cell Mol Physiol. 2015; 309(5):L488–96. doi:10.1152/ajplung.00359.2014PMID:
26138645
41. Ryter SW, Alam J, Choi AM. Heme oxygenase-1/carbon monoxide: from basic science to therapeutic applications. Physiol Rev. 2006; 86(2):583–650. PMID:16601269
42. Zuberi RI, Hsu DK, Kalayci O, Chen H-Y, Sheldon HK, Yu L, et al. Critical role for galectin-3 in airway inflammation and bronchial hyperresponsiveness in a murine model of asthma. Am J Pathol. 2004; 165 (6):2045–53. PMID:15579447
43. Weibel ER. Morphometry of the Human Lung. New York: Springer; 1963.
44. Knight DA, Holgate ST. The airway epithelium: structural and functional properties in health and dis-ease. Respirology. 2003; 8(4):432–46. PMID:14708552
45. Bai A, Eidelman DH, Hogg JC, James AL, Lambert RK, Ludwig MS, et al. Proposed nomenclature for quantifying subdivisions of the bronchial wall. J Appl Physiol (1985). 1994; 77(2):1011–4.
46. O'Reilly M, Hooper SB, Allison BJ, Flecknoe SJ, Snibson K, Harding R, et al. Persistent bronchiolar remodeling following brief ventilation of the very immature ovine lung. Am J Physiol Lung Cell Mol Phy-siol. 2009; 297(5):L992–L1001. doi:10.1152/ajplung.00099.2009PMID:19717553
47. Saetta M, Ghezzo H, Kim WD, King M, Angus GE, Wang NS, et al. Loss of alveolar attachments in smokers. A morphometric correlate of lung function impairment. Am Rev Respir Dis. 1985; 132(4):894–
900. PMID:4051324
48. Grubbs F. Sample criteria for testing outlying observations. Ann Math. 1950; 21(1):27–58.
49. James ML, Ross AC, Nicola T, Steele C, Ambalavanan N. VARA attenuates hyperoxia-induced impaired alveolar development and lung function in newborn mice. Am J Physiol Lung Cell Mol Physiol. 2013; 304(11):L803–12. doi:10.1152/ajplung.00257.2012PMID:23585226
50. Husari A, Khayat A, Bitar H, Hashem Y, Rizkallah A, Zaatari G, et al. Antioxidant activity of pomegran-ate juice reduces acute lung injury secondary to hyperoxia in an animal model. BMC Res Notes. 2014; 7:664. doi:10.1186/1756-0500-7-664PMID:25241213
51. Hazlewood LC, Wood LG, Hansbro PM, Foster PS. Dietary lycopene supplementation suppresses Th2 responses and lung eosinophilia in a mouse model of allergic asthma. J Nutr Biochem. 2011; 22(1):95–
100. doi:10.1016/j.jnutbio.2009.12.003PMID:20392623
52. Berkelhamer SK, Kim GA, Radder JE, Wedgwood S, Czech L, Steinhorn RH, et al. Developmental dif-ferences in hyperoxia-induced oxidative stress and cellular responses in the murine lung. Free Radic Biol Med. 2013; 61c:51–60.
53. Nagato AC, Bezerra FS, Lanzetti M, Lopes AA, Silva MA, Porto LC, et al. Time course of inflammation, oxidative stress and tissue damage induced by hyperoxia in mouse lungs. Int J Exp Pathol. 2012; 93 (4):269–78. doi:10.1111/j.1365-2613.2012.00823.xPMID:22804763
54. Ozdemir OM, Gozkeser E, Bir F, Yenisey C. The Effects of Resveratrol on Hyperoxia-induced Lung Injury in Neonatal Rats. Pediatr Neonatol. 2014.
56. Langley SC, Phillips GJ, Tahedl S, Kelly FJ. Dietary supplementation of vitamin E fails to prevent the development of hyperoxic lung injury in the premature guinea pig. Comp Biochem Physiol A Physiol. 1992; 103(4):793–9.
57. Valko M, Leibfritz D, Moncol J, Cronin MT, Mazur M, Telser J. Free radicals and antioxidants in normal physiological functions and human disease. Int J Biochem Cell Biol. 2007; 39(1):44–84. PMID:
16978905
58. Bouayed J, Bohn T. Exogenous antioxidants—Double-edged swords in cellular redox state: Health
beneficial effects at physiologic doses versus deleterious effects at high doses. Oxid Med Cell Longev. 2010; 3(4):228–37. doi:10.4161/oxim.3.4.12858PMID:20972369
59. Auten RL, Mason SN, Auten KM, Brahmajothi M. Hyperoxia impairs postnatal alveolar epithelial devel-opment via NADPH oxidase in newborn mice. Am J Physiol Lung Cell Mol Physiol. 2009; 297(1):L134–
42. doi:10.1152/ajplung.00112.2009PMID:19411313
60. Rozycki HJ, Comber PG, Huff TF. Cytokines and oxygen radicals after hyperoxia in preterm and term alveolar macrophages. Am J Respir Cell Mol Biol. 2002; 282(6):L1222–8.
61. Thomas PS. Tumour necrosis factor-alpha: the role of this multifunctional cytokine in asthma. Immunol Cell Biol. 2001; 79(2):132–40. PMID:11264706
62. Martinez FO, Gordon S. The M1 and M2 paradigm of macrophage activation: time for reassessment. F1000prime Rep. 2014; 6:13. doi:10.12703/P6-13PMID:24669294
63. McGrath-Morrow SA, Lauer T, Collaco JM, Yee M, O'Reilly M, Mitzner W, et al. Neonatal hyperoxia contributes additively to cigarette smoke-induced chronic obstructive pulmonary disease changes in adult mice. Am J Respir Cell Mol Biol. 2011; 45(3):610–6. doi:10.1165/rcmb.2010-0259OCPMID:
21239606
64. Wilson MS, Wynn TA. Pulmonary fibrosis: pathogenesis, etiology and regulation. Mucosal Immunol. 2009; 2(2):103–21. doi:10.1038/mi.2008.85PMID:19129758
65. Sumi Y, Hamid Q. Airway remodeling in asthma. Allergol Int. 2007; 56(4):341–8. PMID:17965577
66. Hershenson MB, Garland A, Kelleher MD, Zimmermann A, Hernandez C, Solway J. Hyperoxia-induced airway remodeling in immature rats. Correlation with airway responsiveness. Am Rev Respir Dis. 1992; 146(5 Pt 1):1294–300.
67. Belik J, Jankov RP, Pan J, Tanswell AK. Chronic O2 exposure enhances vascular and airway smooth muscle contraction in the newborn but not adult rat. J Appl Physiol. 2003; 94(6):2303–12. PMID:
12562676
68. ter Horst SAJ, Fijlstra M, Sengupta S, Walther FJ, Wagenaar GTM. Spatial and temporal expression of surfactant proteins in hyperoxia-induced neonatal rat lung injury. BMC Pulmon Med. 2006; 6:8. 69. Bara I, Ozier A, Tunon de Lara JM, Marthan R, Berger P. Pathophysiology of bronchial smooth muscle
remodelling in asthma. Eur Respir J. 2010; 36(5):1174–84. doi:10.1183/09031936.00019810PMID:
21037369