Computer-Based Decision Support for Railroad Transportation Systems:
an Investment Case Study
Luminita DUTA
1, Adrian BITULEANU
2, Florin Gheorghe FILIP
3, Ion ISTUDOR
4 1Valahia University of Tîrgovi
ş
te, Tîrgovi
ş
te, Romania
2National Railroad Company, Craiova, Romania
3The Romanian Academy - INCE and ICI, Bucharest, Romania
4Valahia University of Tîrgovi
ş
te, Tîrgovi
ş
te, Romania
In the last decade the development of the economical and social life increased the complexity
of transportation systems. In this context, the role of Decision Support Systems (DSS) became
more and more important. The paper presents the characteristics, necessity, and usage of
DSS in transportation and describes a practical application in the railroad field. To compute
the optimal transportation capacity and flow on a certain railroad, specialized
decision-support software which is available on the market was used.
Keywords:
decision support systems, decision tree, logistics, optimization, railroad
transpor-tation
Introduction
In the modern society the mobility is an es-sential feature. The economical development re-quires the development of transportation systems (TS). The European Union has a clear policy in the domain of transportation systems and elabo-rated the main objectives of this important eco-nomical field. The White Paper of the European Commission [1] proposes 60 measures to aim at developing a European transport system “capable of shifting the balance between modes of port, revitalizing the railways, promoting trans-port by sea and inland waterways and controlling the growth in air transport”. In that document, the Intelligent Transportation Systems (ITS) have an important place since they have the potential to provide solutions for the 21st century European transportation. Those solutions take into account the transportation efficiency and velocity as well as its security of passengers. The other non-European states, as USA, Australia or Japan, ela-borated transportation strategies for supporting the sustainable development of their societies. Specific constituents of ITS are Decision Support Systems in Transportation (DSST), which are uti-lized at the operational and organizational man-agement levels. These are intelligent systems that support the decider–a human being or a group of persons - in approaching complex situations and decision making processes. In the transportation field, the usage of such intelligent systems has certain advantages such as a) taking into account all the possible decisional scenarios, b) querying large data bases, c)quick elaboration of the op-timal decision, and d)friendly interface
commu-nication [2]. In some cases, general-purpose deci-sion analysis software products from-the shelf may suffice as it will be described later in this paper.
In this paper a review of the characteristic fea-tures of the DSS in transportation is made first. Then an application of a decision analysis tool to an investment problem in the Romanian railroad development is presented.
2 Characteristics of the DSS in Transportation Decision Support Systems (DSS) ensure the computer-based support for the conscientious de-cision-making for solving problems that require large amount information processing and devel-opment of complex scenarios using this informa-tion [3]. A descripinforma-tion of DSS usage, technology and construction is given in [4]. Decision Support Systems are interactive, computer-based systems that help the decision makers to solve complex, unstructured or semi-structured decision prob-lems where a human expert assistant (or a group of assistants) would be otherwise needed.
The typical characteristics of a DSS are:
• specialization: each DSS is adapted to the in-formational necessities of the particular domain decision problem and decision maker and utiliz-es, beside general IT tools, specific tools for de-cision analysis;
• complexity: a DSS system is dealing with complex decision problems that “count”. It, sometimes, needs a large amount of information about the approached decision situation; such a system also provides complex tools for risk and sensitivity analysis.
• friendly interfacing: almost all DSS have “usa-ble” interface with the decision -maker that makes their usage more comfortable.
In addition to the above mentioned general fea-tures, some DSST integrate intelligent technolo-gies that are able to facilitate the learning of pre-vious special situations. There are some unex-pected situations that may occur in a transporta-tion system and the experience gained in solving such cases may be used in their future analysis. Moreover, the architecture of a DSST must be modular, since the dynamics of the transportation systems imposes changes and adaptations to the clients and market needs. The newest communi-cation and information technologies must be used to permanently modernize and evolve a DSST. Most of the DSST operation is based on the spa-tial DSS [5] and include GIS (Geographic Infor-mation Systems) and/or GPS (Geographic Posi-tioning Systems) subsystems as specific constitu-ents.
The main particular characteristics of DSST are:
• ensuring the safety of the passengers’
transpor-tation;
•reducing the costs of logistics or transportation procedures;
•optimizing the human/material traffic;
•allowing multi-criteria analysis;
•suggesting real-time solutions in case of inci-dents or urgent situations;
•providing with advanced remote control solu-tions.
As shown in the sequel, for some applications, general – purpose decision analysis tools may suffice.
3 Railroad transportation in Romania: a brief history
To set the stage for the decision analysis, a short excursion into the history of Romanian railways is made in the sequel following the lines exposed in [6]. The first railway line on present-day terri-tory of Romania was opened on 20th August
1854 between
Fig. 1. Romanian railway network [11]
In 1918, in the lines linked old and new Romanian regions (some of them previously i Empire, others placed under the administration of Romanian Railway Company (CFR). After 1947, one could notice a very important amount of investment in railway infrastructure as compared with other forms of transport infrastructures. In Fig. 1 the network of main Romanian railways is presented. After 1989, Romania inherited one of the largest, very dense, and frequently-utilized railway net-works in Europe, which has, at the same time, a
relatively outdated and partially worn-out infra-structure. This situation, combined with the eco-nomic decline that Romania faced in the 1990s due to its transition to a market economy, re-sulted in CFR entering in a period of noticeable relative decline. In the early 2000s, CFR started on a comprehensive modernization program with a view to improving its quality of services and image.
4 An investment decision problem
enhanced railroad capacity on the trans-Carpathian lines. This is a result of the develop-ment of two international railways: “Corridor IV” (from west to east) and “Corridor IX” (from north to south). Both corridors are breaking through the Southern Carpathian Mountains [7]. The decision–makers have to take into account some technical alternatives to increase the trans-portation flow capacity on these lines. One alter-native is to multiply three or four times the ca-pacity of the existing railroad lines between Bu-charest and Ploiesti. Another solution is to final-ize the work on the line Vîlcele – Bujoreni
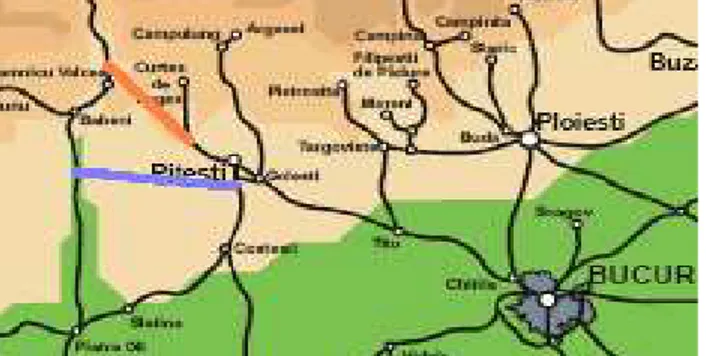
Vîlcea, but taking into consideration the con-struction risks on an unstable sliding natural ground. There is a third alternative, that of find-ing a new railroad between Pitesti and Rîmnicu Vîlcea. This railroad will pass from Bradu de Sus
to Ioneşti-Vîlcea and will have certain advantag-es in radvantag-espect of the land stability and construction investment costs.
The new possible railroad links are graphically drawn with solid thick lines in Fig. 2. . In the se-quel the decision analysis will take into account the investments costs and the annual profit.
Fig. 2. New railway possible links between Piteşti and Rîmnicu Vîlcea
5 Palisade’s Precision Tree® - a practical deci-sion tool
The Precision Tree® of Palisade is an example of decision analysis software which can be utilized as an add-in to Microsoft Excel® [8], [9].
The Precision Tree® system includes various tools for defining and analyzing decision trees and influence diagrams. In the software product, all decision model values, including the probabil-ities, are entered directly in spreadsheet cells, just like any other Excel models. It also allows link-ing values in the decision model directly to loca-tions specified in a spreadsheet model. The re-sults of solving that model can be utilized as payoffs for each path through the decision tree. All calculations of payoffs happen in real-time, that is, as the tree is edited, all payoffs and node values are automatically recalculated.
As shown in product description, the decision analyses supported by Palisade’s software can provide with several types of reports such as sta-tistical reports, risk profiles and policy sugges-tions. All analysis results are reported directly in Excel for easy customization, printing, and sav-ing. The user has not to learn a whole new set of formatting commands since all reports can be modified like any other Excel® worksheet or chart. More possible decision options can be add-ed because the decision trees can be easily
ex-panded, Palisade’s Precision Tree® also includes a set of features which are meant to help the user to reduce a tree to a more convenient size. All nodes can be collapsed, hiding from user’s view all paths which follow the node. A single sub-tree can be referenced from multiple nodes in other trees, saving the re-entry of the same tree over and over [8].
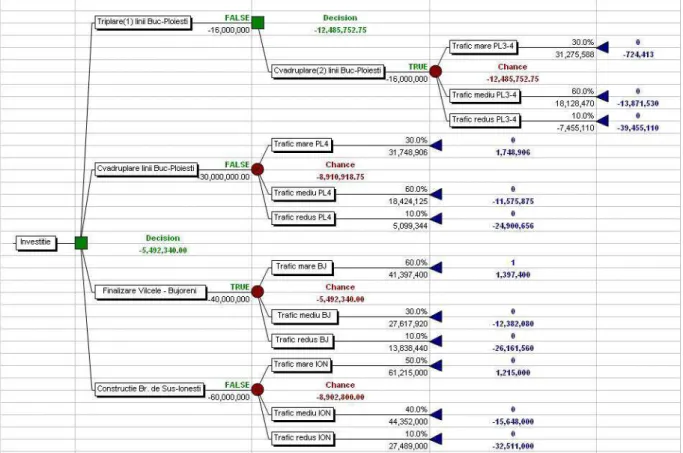
6 Experimental Results
As stated above, our decision analysis took into account four alternatives such as:
•(A1): increasing the transportation flow three times between Bucharest and Ploiesti,
•(A2): increasing the transportation flow four times between Bucharest and Ploiesti,
•(A3): constructing Vîlcele – Bujoreni Vîlcea railroad segment, and
• (A4): building the alternative railway segment
Bradu de Sus to Ioneşti-Vîlcea.
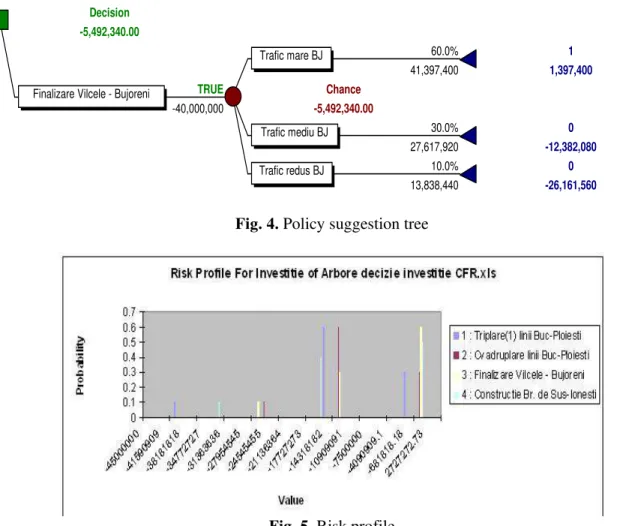
The policy suggestion is given in the figure 4 bel-low as a result of running the procedure of roll-ing-back the decision tree. The optimal decision is found to be the third alternative of investment that is to finish the railway Vilcele – Bujoreni. The risk profile is given in the Fig. 5. The graph-ic representation shows that the probability to
gain an annual profit over 2 billions euro is 65% if one decides to finish and to exploit the railway Vilcele – Bujoreni.
Note. All screen captures of figures 3 through 7 were obtained by using the Palisade Precision Tree® software.
Table 1. Characteristics of the decision alternatives [10]
A1 A2 A3 A4
PT FT PT FT PT FT PT FT
3.00 4.00 3.00 4.00 3.00 4.00 3.00 4.00
Trains / day 6 12 10 20 16 32 16 32
Length of the segmentkm] 59 59 59 59 39 39 50 50 Total length/day 354 708 590 1,180 624 1,248 800 1,600 Anual revenues from TUI [€] 1,421,310.00 2,368,850.00 2,505,360.00 3,212,000.00 Annual revenue from other
sources [€uro] 45,000.00 50,000.00 550,000.00 650,000.00 Total annual revenue [€uro] 1,466,310.00 2,418,850.00 3,055,360.00 3,862,000.00 Annual running costs [€uro] 1,000,000.00 1,600,000.00 1,800,000.00 1,750,000.00 Annual profit [€] 466,310.00 818,850.00 1,255,360.00 2,112,000.00 Legend: PT: passenger trains; FT: freight trains; TUI: fee for using the infrastructure
Policy Suggestion for Investitie of Arbore decizie investitie CFR.xls
Decision -5,492,340.00
60.0% 1
41,397,400 1,397,400
TRUE Chance
-40,000,000 -5,492,340.00
30.0% 0
27,617,920 -12,382,080
10.0% 0
13,838,440 -26,161,560
Finalizare Vilcele - Bujoreni
Trafic mare BJ
Trafic mediu BJ
Trafic redus BJ
Fig. 4. Policy suggestion tree
Fig. 5. Risk profile
The cumulative risk diagram (Fig 6) also shows that the probability to have loses in the case of the third decisional alternative is under 40%. Spider graph (Fig. 7) compares the results of multiple analyses. For each variable, the percen-tage of the base case is plotted on the X-axis and the expected value of the model is plotted on the Y-axis. The slope of each line depicts the relative change in the outcome per unit change in the in-dependent variable and the shape of the curve shows whether a linear or non-linear relationship exists. In Fig. 7, the total variation in the third decisional alternative (that to finish the railway
Vîlcele – Bujoreni) has the largest total effect on expected value. Spider graphs show the reasona-ble limits of change for each independent varia-ble and the unit impact of these changes on the outcome.
Fig. 6. Cumulative risk profile
Fig.7. Spider graph
7 Conclusions
A thorough decision analysis concerning the in-vestment for supplying the railroad capacity on the trans-Carpathian lines was made in this paper. To support the decision analysis, Precision Tree® a software product of Palisade was utilized. The presented study witnessed how usable and useful such a class of computer-supported decision analysis software tool (which includes several other products such as DPL7® of Syncopation TreeAge Lumina ( few examples) can be.
It is worth mentioning that a only single- attribute decision analysis was performed in our study.
The evaluation criterion utilized in our analysis was the maximization of the annual profit of the Romanian railway company over the next 25 years. In future works, we will take into account a multi-criteria decision analysis, by introducing several new attributes to form a set of indicators which should be mutually independent and col-lectively complete.
References
[1] EC (2001). White Paper: European transport poli-cy for 2010: time to decide [Online]. Available:
portation”, in Proc. The 7th International Conference in Competition and Ownership in Land Passenger Transport, Norway, 2001, pp. 35-56.
[3] F. G. Filip, “Decision support and control for large-scale complex systems”, Annual Reviews in Control, 32 (1), pp.61-70, 2008
[4] F. G. Filip, Sisteme Suport pentru Decizii, (Deci-sion Support Systems) 2nd edition, Bucharest: Editura Tehnica, 2007
[5] J. C. Thill (2000). Geographic Information Sys-tems in Transportation Research, Amsterdam: Perga-mon, 2000
[6] CFR(2006). CFR History [Online]. Available: http://www.cfr.ro/CFR_new/Rom/istoria. htm
[7] D. Ciocoreanu and M. Fedeles, (2008 ). O posibila
legatura peste Muntii Carpati . Jurnalul Feroviar
[On-line]. Available:
[8] Palisade (2008). The Decision Tool Suite [Online]. Available
[9] R.T. Clemen and T. Reilly, Making Hard Decisions with Decision Tools Suite. Updated Ed., Duxbury Resource Center, 2004
[10] A. Bituleanu, MSc. Thesis. Studiul variantei optime de sporire a capacităţii de circulaţie a secţiilor feroviare care tranzitează Carpaţii meridionali, Bucharest: Department of Transport Systems. Technical University “Politehnica”, 2008.
[11] http://www.romaniatourism.com/map/romania _rail_map.gif.
Luminiţa DUŢĂ is currently associate professor at Valahia University of Targo-viste, Romania. She took the PhD from Université de Franche Comté (France) and from Technical University “Politehnica” of Bucharest in Automation and Control field. Her research interests include the use of decision support systems in complex process controlling and meta-heuristics.
Engineer at CFR National Railroad Company, Adrian BITULEANU took the MSc degree in Transportation Logistics. He is now PhD candidate at Transportation Fa-culty from TU “Politehnica” of Bucharest. His main research field is the optimiza-tion and the stability of the railroad transportaoptimiza-tion.
Florin Gheorghe FILIP took his MSc and PhD in control engineering from the TU “Politehnica” of Bucharest. In 1991 He was elected as a member of the Romanian Academy (RA). He has been a scientific researcher at the National R&D Institute in Informatics (ICI) of Bucharest. Currently he is a part-time researcher at the National Institute of Economic Researches (INCE) of the RA, also the director of the Library of the Academy. He was elected as vice-president of RA in 2000 and re-elected in 2002 and 2006. His main scientific interests include large–scale systems, decision support systems, technology management and foresight.
![Fig. 1. Romanian railway network [11]](https://thumb-eu.123doks.com/thumbv2/123dok_br/16372793.191232/2.893.210.649.581.895/fig-romanian-railway-network.webp)