A Decision Making Approach to Support
Investment Analysis of Distribution Systems
Tatiano Busatto, Bibiana M. Petry, Sérgio L. Haffner,
Member, IEEE,
Flávio A. B. Lemos,
Member, IEEE,
Luís F.
A. Pereira, Luís A. Pereira, Paulo R. da S. Pereira
Abstract—This paper presents a methodology to provide formation for decision-making toward the alternatives of in-vestments in distribution system planning. Using multi-criteria analysis, the proposed method includes the evaluation of main factors that have influence on power quality and reliability indexes. Additionally, aspects related to economic costs and en-ergy efficiency are considered for different operating conditions. The decision is made taking into account the performance of medium voltage transformers and distribution system reliability standards of Regulatory Agency requirements. Loss of life in transformers, technical losses, voltage levels, and utilization factor are assessment together with continuity and availability of power supply in order provide efficient and reliable operation, avoid penalties for unsatisfactory performance. The methodology allows an easy way to compare financial losses from feeders, substation and geographical regions of the distribution system. To illustrate the use, the methodology is applied in a real distribution system, and the result are analyzed and discussed.
Index Terms—Distribution system, expansion planning, multi-criteria decision analysis, transformer loss-of-life
I. INTRODUCTION
T
HE direction of investments for expansion planning inelectrical systems depends on detailed studies about the real operational conditions including the use of computational resources to achieve the correct sizing of the new installations, or even making changes in the existents systems.Over the past decades several works that employ analytical processes for obtaining optimal solutions has been developed in this field. For generation systems projects, Yang and Chen [1], formulated a methodology to make optimal choices based on multi-creteria analysis method. Through hierarchical group-ing, assignment of the relative importance and weighting the criteria, is obtained the Euclidean distance to the ideal deci-sion, that defines the best solution. Based on AHP (Analytical Hierarchy Process), Silong et al [2] describe an evaluation methodology resulting in relative weights of indexes covering the operating characteristics, system capacity, reliability, power quality and economy. In [3], Yanget alpropose a methodology for evaluating the use of equipment in the system, assessing the load rate of lines and substation transformers under normal
T. Busatto, B. M. Petry, S. L. Haffner, F. A. B. Lemos, L. F. A. Pereira and L. A. Pereira are with Dept. of Electr. Eng., Fed-eral Univ. of Rio Grande do Sul, Porto Alegre, RS, Brazil (e-mail: [email protected], [email protected], [email protected], [email protected], [email protected], [email protected]).
P. R. S. Pereira is with CEEE-D, Porto Alegre, RS, Brazil (e-mail: [email protected]).
This work is partly supported by CEEE-D, under project no. 6804. Manuscript submitted March 15th, 2015.
operating conditions and when maximum capacity is reached. More recently, for project prioritization in distribution systems, Mussoi and Teive [4] suggest a methodology to optimize the value of the portfolio projects as part of the expansion planning process. For such, is considered the financial impacts, number of consumers and aspects related to system reliability and power quality. By using a multiobjective genetic algorithm (NSGA-II) is obtained a set of portfolios commitments and the project restrictions, reducing the subjectivity in decisions. The approaches cited are specific for each application and help in prioritizing investments indirectly, based on the oper-ation, reliability, and power quality indexes. In other words, forward the decision, is still required an interpretation in scale to have knowledge about the financial impact related to the indexes.
Aiming to make the decision more clear and direct, this study shows the implementation of a method to aid the decision making-process, combining technical to economic criteria, being these, the analysis results. This will enable decision-makers, who works in distribution systems, to be guided quickly on equipment or line identification that require investments to increase the power quality and reliability levels.
II. PROPOSEDMODELFORMULATION
Based on the objectives highlighted in Section I, the pro-posed method must relate economic criteria to technical well know parameters. To achieve this goal here is proposed the use of the theory of MCDA (Multi-Criteria Decision Analysis) as a way to achieve the desired results.
In fewer words, the MCDA approach helps to identify the best solution by ordering options and simplifying distinguish the possibilities acceptable from the unacceptable [5]. To achieve these objectives several solution methods consider-ing different criteria are available. Given the characteristics inherent to MCDA process, in this work was chosen some features that are part of theAHPmethod, allowing to reach the solution of a reduced set of steps. Among the characteristics used, can be highlighted the prioritization process, selection or the criteria, standardization, and finally, the results validation. In distribuition systems, the number of variables to be analyzed and controlled is somewhat worried. As a result, any analytical methods must select the right criterias as requirement.
and quality of service. In addition, the criteria selection are supported by the following requirements: (i) the criteria are regulated by the Regulatory Agency and, therefore, subject to penalties if limits are exceeded, (ii) the criteria directly reflect losses and consequent energy waste, and (iii) the criteria represents financial losses due to improper use of the equipments. As a result, the select criterias for the proposed method are: losses in lines and transformers, reliability levels, voltage levels, loss of life in transformers and load factor.
Considering the criteria grouping by categories, according to the criteria described above, we obtain a criteria value tree representation of the decision model illustrated in Figure 1.
Fig. 1: Criteria values tree
It is assumed that all data needed to calculate the criteria comes from a database, which has, among other information, the result of power flow solution and data reliability of the distribution system. The database is fed with the total energy measurement of each consumer. Joining these data with standard load profile for each type of costumer, is obtained the diary load cycle, used in the power flow solution. For that, is used a method for large weakly meshed network, proposed by Lue and Semlye [6]
Figure 2 illustrates the process of reading and power flow solution process based on the information stored in the database.
From the result of power flow solution, and reliability data, the criteria are calculated.
The next section presents the development of each criteria. Aiming to standardize and put on the same financial base, for each criteria is given an equation that establishes the assessment method for selected criteria with the financial costs, here represented by c(x), where xis the evaluated criteria.
III. CRITERIADEFINITION
For better understanding, this section provides a brief overview of the calculation methods in order to obtain the cost associated with each criteria.
A. Loss-of-Life in Transformers
The relationship between insulation aging and time variation and temperature can be represented by an adaptation of the Arrhenius reaction-rate theory [7], expressed by the equation (1).
L=A.e
B
ΘH+273
(1)
Fig. 2: Power flow computation process
where L is the insulation life, in p.u., ΘH is the winding hottest spot temperature, in ◦C,A is a modified constant, in pu, derived from the selection of the temperature of◦Cwhich defines the relationship of "one for each unit of life", andB
is the constant aging rate.
The durability evaluation of a transformer, in economical and reliability studies, is related to the conditions of how the transformer is used. The relationship between insulation aging and time variation and temperature can be represented by an adaptation of the Arrhenius reaction-rate theory [7], expressed by the equation (2), whereLis the insulation life, in p.u.,ΘH is the winding hottest spot temperature, in◦C.
L= 9,8×10−18.e
15.000 ΘH+273
(2)
From Equation (2) is obtained the Equation (3), which describes the Accelerated Aging Fator (FAA) for a given load and temperature, or else, at a variable load and temperature profile in a 24 hour period.
FAA=e
15.000
383 −Θ15H.+273000
(3)
To determine the aging over a given period and temperature cycle, Equation (3) may be modified resulting in equation (4).
FEQA=
PN
n=1FAA,n.∆tn
PN
n=1∆tn
(4)
whereFEQAis the equivalent aging factor for a period,nis the index of the interval∆t,Nis the total number of intervals, and∆tn is the interval itself.
hours (20.55 years) which is a requirement for transformers produced according to the standard IEEE C57.12.00 [8].
P V =FEQA×t×100
LN
(5)
In Equation (5), LN represents the transformer rated life,
P V is the loss of life in percentage andtis the analysis period
for FEQA. As this criteria is already expressed in percentage, within the chosen time horizon, the financial value associated with the loss of life, c(P V), is given by the expression (6), where c(SNi) is the transformer acquisition cost at the rated
power.
c(P V) =
N
X
i=1
P Vi×c(SNi)
100 (6)
B. Transformer Losses
The total losses in transformers (∆PT R) are composed by losses in the windings ∆PCu and losses in the core ∆PCu, as described on Equation 7.
∆PT R= ∆PF e+ ∆PCu (7) The core losses are approximately proportional to the rated power of the transformer. On the other hand, the losses in the windings are dependent on the current flowing through the transformer, and can be expressed by equation (8).
∆PCu =
P
avg
Pnom.cosϕ
.PNCu (8)
where: PNCu is the windings losses in the transformer
at rated load condition, in kWh, which is obtained by the difference between total losses and losses in no-load condition inkW,Pavg is the power average, obtained by the consumed energy by consumers connected to the transformer divided by time in hours, Pnom is the rated power of the transformer in kVA andcosϕ is the power factor, set at 0.92 in this study.
To determine the financial, c(PT R), is used the expression show in (9), where TE is the energy fare.
c(PT R) = N
X
i=1
∆PT Ri×T E (9)
C. Line losses
For the determination of technical losses in distribution lines, the vast majority of distribution companies uses power flow procedures, statistical processes and geometric models for estimating losses. In this study, a Top-Down method was used, which is based on simplifying assumptions.
For financial losses, c(PL), are associated the percentage losses of each section with the energy fare. The financial losses for the whole system (1toN) is the summation of the financial losses, according to the expression (10).
c(PL) = N
X
i=1
∆PLi×T E (10)
D. Voltage Level
From the consumers viewpoint, changes in mains voltage, different from the equipments rated voltage, can reduce the lifetime, even causing malfunction and, and in some cases, decreasing its efficiency. Similar to other criteria previously cited, the voltage levels are regulated and supervised by the regulatory authority.
In some countries, these limits are defined by indicators obtained through the voltage distribution frequency, which, by using percentiles, is obtained the quality of the voltage levels. In other countries, in a simplified form, is established limits for critical and precarious voltage levels, monitoring the time that these level remain within these limits, thus, obtaining indexes expression that represents the quality of voltage level. Usually, utility distribution companies use expressions for financial compensation, which may vary depending on the laws of each country. In this work is used the method described by the Equation (11) which is used in Brazil, based on PRODIST standard[9]. The total cost of voltage compensation
c(∆V)is calculated by the sum of all values of violation of each client, (i to N).
c(∆V) =
N
X
i=1
hDRPi −DRPM
100
·k1 +
DRCi −DRCM
100
·k2
i
·EU SD
(11)
In the equation,DRPM andDRCM refer to the maximum values allowed DRP and DRC are the indexes for Relative Duration of Transgression for Precarious and Critical Voltage respectively, both in percentage, k1 andk2 are constants that
depends on theDRP andDRC values when compared with
its limits. In this study, DRPM = 3 % and DRCM = 0,5 % was used. EUSD is the value relative to the charge of use of the distribution system, corresponding to the reference month from the last measurement, which is obtained obtained by multiplying the TUSD by the total energy consumption (EUSD=TUSD×kWh).
Knowing the DRP and DRC values, active power consump-tion by transformer in the analysis period and the distribuconsump-tion company TUSD, is possible to get the amount paid in financial compensation for each consumer.
E. Utilization Factor
The utilization factor for an equipment, in a given period of timet, is denominatedKuand represents the ratio between the maximum demand and its rated capacity (Ku=SSmaxN ).
Ku=
Smax
SN
(12)
Ku is dimensionless and indicates how the system or a particular equipment is being used, that is, whether or not it is under-utilized or overloaded.
The relative cost due to the error in sizing the transformer, associated with the utilization factor, c(KU), is obtained by the expression (13) defined as follows:
c(KU) = N
X
i=1
c(S
Ni)−c(KU.SNi)
∆t×20
(13)
where, c(SNi) is the cost related to the acquisition of the
installed transformer, c(KU.SNi)is the cost transformer that
best fits for that loading condition and ∆t is the analysis
horizon. In this way, is obtained the financial value due to the transformer incompatibility c(KU) based on their estimated life of 20 years.
F. Reliability
For reliability evaluation, is used the System Average In-terruption Frequency Index (SAIFI), Equation 14, and System Average Interruption Duration Index (SAIDI), Equation 15, that quantify the frequency and duration of the occurred interruptions, weighted in relation to a group of consumer. SAIFI is given by interruptions/year and SAIFI by hours/year.
SAIF I=T otal N umber of Customer Interruptions
T otal N umber of Customers Served (14) SAIDI=
P
Customer Interruption Durations
T otal N umber of Customers Served (15) By violating the limits, established for the verification period, utility distribution companies must compensate the consumers making credit on electricity bill. Equations (16) and (17) describe the calculation of the compensation amount based on the standard PRODIST [9].
c(SAIDI) =
SAIDI
SAIDIL− 1
.SAIDIL.
EU SD
730
.kei (16) c(SAIF I) =
SAIF I
SAIF IL − 1
.SAIF IL.
EU SD
730
.kei (17) where, SAIDIL andSAIF IL are the limits of continuity established in the period considered for the SAIDI and SAIFI indicator respectively, 730 is the average number of hours in the month and key is the scale factor which depends on the
voltage level to which the consumer is supplied.
Finally, the financial cost for SAIDI and SAIFI c(R)parts to be compensated for every customer, can by obtained by
c(R) =c(SAIDI) +c(SAIF I). IV. CASESTUDY
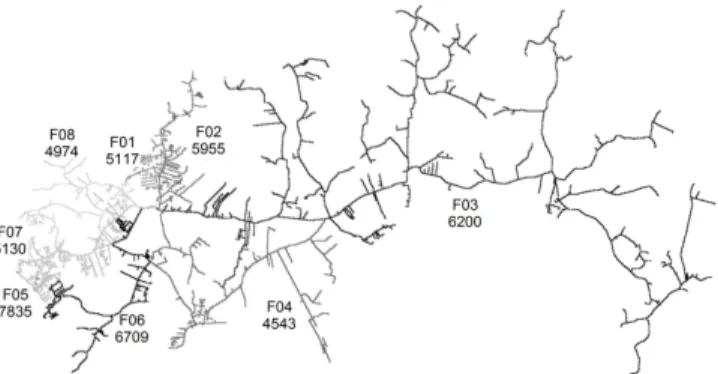
To evaluate the method, it was applied in a primary distri-bution network in the state of Rio Grande do Sul, Brazil. The system consists of a substation comprising 8 feeders, which provides energy to 46436 consumers.
The selection of this network was motivated because its presents load diversity in urban and rural regions. Moreover, in its composition, there are section with old and new equipments which enables a better view of the sensitivity of the method with respect to various parameters. Figure 3 show the real network topology.
Fig. 3: Network topology of the distribution system
In this case study, we selected a time horizon of one month. Although the expansion planning is carried out with a horizon of five years, the monthly assessment allows monitor trends and act more dynamically in order to mitigate the system problems.
Based on power flow results, percentage losses rates for each section of the system was obtained. Technical losses in the transformers windings were obtained considering the monthly average of the active power based on the load profile for each transformer. Using the respective classes and nominal output voltage, there was obtained the core percentage loss.
To determine the transformer loss-of-life was considered transformers class 65°C and cooling type ONAN (Natural Oil Natural Air).
In addition, for the oil temperature at the hottest point was used the temperature for daily averages of a weather station located near to the distribution network.
The values for voltage transgression were obtained through the voltage profile of the primary network for typical days of the month. As the penalties levied on the secondary network, the voltages of the primary network were converted to sec-ondary voltages based on theTapadjust for each transformer. To determine the reliability results, were calculated the costs for each customer based on the values of SAIDI and SAIFI, recorded by the company for each client.
As example of the model output, the graph in Figure 4 show the ID of the top 12 transformers that has the worst financial losses for loss-of-life, serving as a tool to identify the equipment that deserve greater attention.
Fig. 4: Ordened cost due to transformer loss-of-life
As a final result, in Figure 5, we have the composition of all economic criteria selected for evaluation of the distribution system. As can be seen, it is clear and direct, which feeder has greater financial loss during the month selected for analysis.
Fig. 5: System cost composition by feeder
and the selected period. Thus, we obtain the relationship between losses and gains, enabling the decision-maker an additional element in the choice of their decisions. The graph in Figure 6 illustrates the result of this analysis by feeder, where financial losses are presented as absolute and percentage based on the financial revenues for each feeder.
Fig. 6: Cost composition and revenue by feeder
The graph in Figure 7 illustrates the composition of the losses for the substation studied, beingr(SED)the net revenue of all feeders for the substation. Losses are detailed, showing the contribution of each criterion analyzed.
Fig. 7: Cost composition by criteria compared to total revenues
V. CONCLUSION
In this work we seek to add to the set of existing methods, a more simplistic and fast way to evaluate results using automated measurements process, linking common technical criteria for financial marks. The method was able to meet the desires of those looking for economic evidences in a direct and clear way, enabling a simultaneous analysis of important criterias in distribution systems.
By the case study, we identified the feeder F03 having the greatest financial losses, deserving action plans to mitigate the problems. It is observed that the method can easily be applied where there are already other tools for analyzing the network performance. Starting from the power flow solution, are joined the normal analyzed elements and is established a link which quantifies the losses and gains of the financial system.
Based on preliminary results, can be stated that the method shows high potential to be used by decision-makers who work
in utility distribution companies. This tool can support theirs strategic decisions on expansion planning, reducing financial losses and help to increase the system efficiency.
REFERENCES
[1] H. Yang and S. Chen, “Incorporating a multi-criteria decision proce-dure into the combined dynamic programming/production simulation algorithm for generation expansion planning,” Power Systems, IEEE Transactions on, vol. 4, no. 1, pp. 165–175, Feb 1989.
[2] L. Silong, Y. Jianping, W. Jun, and S. Xiaolan, “Study and application of the evaluation index system for distribution network,” in Electricity Distribution, 2008. CICED 2008. China International Conference on, Guangzhou, China, Dec 2008, pp. 1–6.
[3] W.-H. Yang, H. Liu, Z. Wang, W.-T. Cui, and L. Cao, “Study on evaluation index system of equipment utilization on distribution network,” inInnovative Smart Grid Technologies (ISGT Asia), 2012 IEEE, 2012. [4] F. Mussoi and R. Teive, “A multistage value-based model for
prioriti-zation of distribution projects using a multiobjective genetic algorithm,”
Journal of Control, Automation and Electrical Systems, vol. 24/5, 2013. [5] J. Dodgson, M. Spackman, A. Pearman, and D. L. Phillips,Multi-criteria
analysis: a manual. London, UK: CLG Publications, 2009.
[6] G. Luo and A. Semlyen, “Efficient load flow for large weakly meshed networks,”Power Systems, IEEE Transactions on, vol. 5, no. 4, pp. 1309– 1316, Jun 1989.
[7] S. Arrhenius, Über die Reaktionsgeschwindigkeit bei der Inversion von Rohrzucker durch Säuren. Wilhelm Engelmann, 1889. [Online]. Available: http://books.google.com.br/books?id=wAvwtgAACAAJ [8] “IEEE standard for general requirements for liquid-immersed distribution,
power, and regulating transformers,”IEEE Std C57.12.00-2010 (Revision of IEEE Std C57.12.00-2006), pp. 1–70, Sept 2010.