OSTEOPOROSIS-RELATED MORTALITY: TIME-TRENDS
AND PREDICTIVE FACTORS
*Nelly Ziadé
Department of Rheumatology, Hotel-Dieu de France Hospital; School of Medicine,
Saint-Joseph University, Beirut, Lebanon
*Correspondence to [email protected]
Disclosure:
The author has no conflict of interest.
Received:
07.04.14
Accepted:
11.05.14
Citation:
EMJ Rheumtol. 2014;1:56-64.
ABSTRACT
Osteoporosis is one of the leading causes of handicap worldwide and a major contributor to the global
burden of diseases. In particular, osteoporosis is associated with excess mortality. We reviewed the impact
of osteoporosis on mortality in a population by defining three categories: mortality following hip fractures,
mortality following other sites of fractures, and mortality associated with low bone mineral density (BMD).
Hip fractures, as well as other fractures at major sites are all associated with excess mortality, except at
the forearm site. This excess mortality is higher during the first 3-6 months after the fracture and then
declines over time, but remains higher than the mortality of the normal population up to 22 years after
the fracture. Low BMD is also associated with high mortality, with hazard ratios of around 1.3 for every
decrease in 1 standard deviation of bone density at 5 years, independently of fractures, reflecting a more
fragile population. Finally predictors of mortality were identified and categorised in demographic known
factors (age and male gender) and in factors reflecting a poor general health status such as the number of
comorbidities, low mental status, or level of social dependence. Our results indicate that the management
of a patient with osteoporosis should include a multivariate approach that could be based on predictive
models in the future.
Keywords: Bone mineral density, fracture, mortality, mortality indicators, osteoporosis, predictive model,
population, time-trends.
BACKGROUND AND OBJECTIVES
Osteoporosis is one of the leading causes of
handicap worldwide and a major contributor to
the global burden of diseases.
1-3The impact at the
population level is constantly increasing due to
aging in societies,
4,5although some studies have
reported a stabilisation or even decline in the
incidence of age-adjusted osteoporotic fractures
in Western societies, possibly due to increased
average body weight, improved functional ability
among the elderly, and specific measures to
prevent bone loss and reduce the risk of falling.
6-9Osteoporotic fractures are associated with a high
mortality rate.
10-13This excess mortality is mostly
elevated in the first 3-6 months following the
fracture then seems to decline during the first 2
years post-fracture, but does not return to the
levels of the general population even 10 years after
the fracture.
10,14,15Some studies showed that the excess mortality
seems to be stable during the last few
decades
13,16,17while others suggested it is decreasing
with time, probably due to advances in the surgical
management of the fractures, or to preventive
measures in the postoperative periods, such
as antibiotherapy and anticoagulation, and to
pharmacological primary and secondary preventive
measures.
14,18-24Moreover, the decline in age-specific
rates of osteoporotic fractures could indirectly
lead to a decline in the global mortality burden.
focused on potential risk factors associated with
mortality. Magnitude of time trends in absolute
and relative mortality following fractures differs
between studies. Furthermore, and beyond the
fracture event, there is emerging evidence that bone
mineral density (BMD) is associated independently
with increased mortality.
The objective of the current review is to investigate
time-trends of mortality associated with different
aspects of osteoporosis: hip fractures, other sites
of fractures, and low BMD. The association with
specific predictive factors is also addressed.
METHODS
A review of the US National Library of Medicine
(PubMed database) was performed using the
Medical Subject Headings (MeSH) terms:
“osteoporosis”, “fractures”, “bone”, “mortality”, and
“population”. A second search using the terms:
“bone density”, “mortality”, and “population”
was performed in a subsequent step. The search
retrieved 433 articles, 64 of which were retained for
the analysis. Studies were retained when relevant
to the review objectives and when conducted
in a population setting. Studies were excluded
when their objective related to the efficacy of
anti-osteoporotic treatments, sponsored or not.
The studies were divided into three categories:
mortality following a hip fracture, mortality
following any other fracture, and mortality in low
BMD patients regardless of fractures. For each
study, the population and study design were
identified, as well as the mortality indicator used.
For every category, the studies were classified by
year of publication.
RESULTS
1. Mortality Following Hip Fractures
Among all osteoporotic fractures, hip fracture is
the site most commonly associated with mortality.
The highest excess in mortality is during the
immediate post-fracture period, especially the first
than the fracture itself.
5,26,27It is clear nowadays
that the excess deaths after a hip fracture can be
attributed to serious underlying comorbidities
that are unrelated to osteoporosis, suggesting
that a certain proportion of deaths could not be
prevented by reducing fractures.
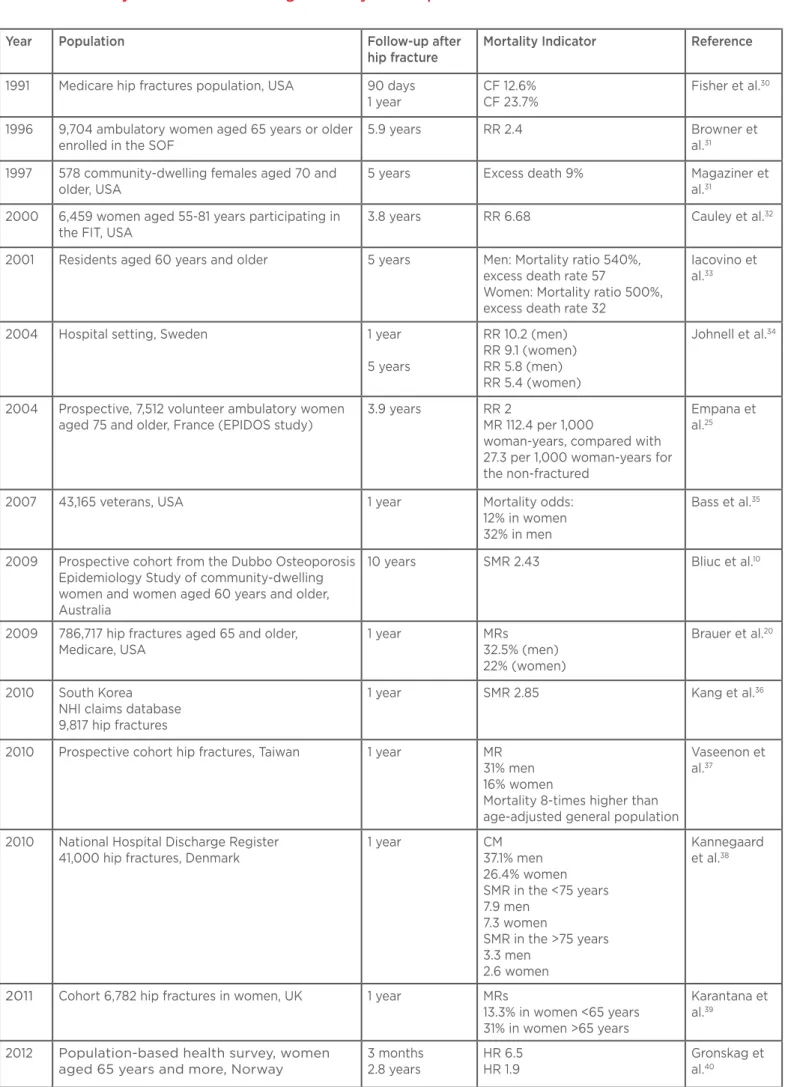
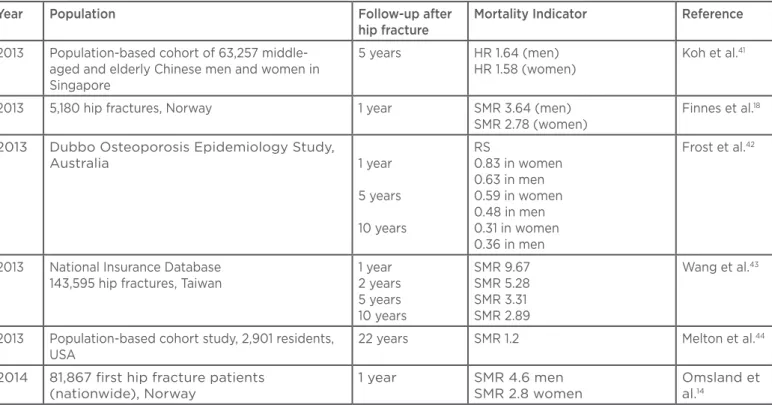
28,29The mortality indicators are shown in
Table 1
by
study and by chronological order of publication.
Although the studies have different populations,
methodologies, and mortality indicators, there is a
clear trend of decreased excess mortality with time
within the same cohort, even if this excess remains
present up to 22 years after the hip fracture. At 1
year, hazard ratios (HRs) vary from around 3-10;
they decline to 5 at 5 years, and to 2.5 at 10
years. There is also a trend for a decline in excess
mortality at 1 year by date of study publication,
suggesting a decreased association with mortality
over the last decade (
Figure 1
).
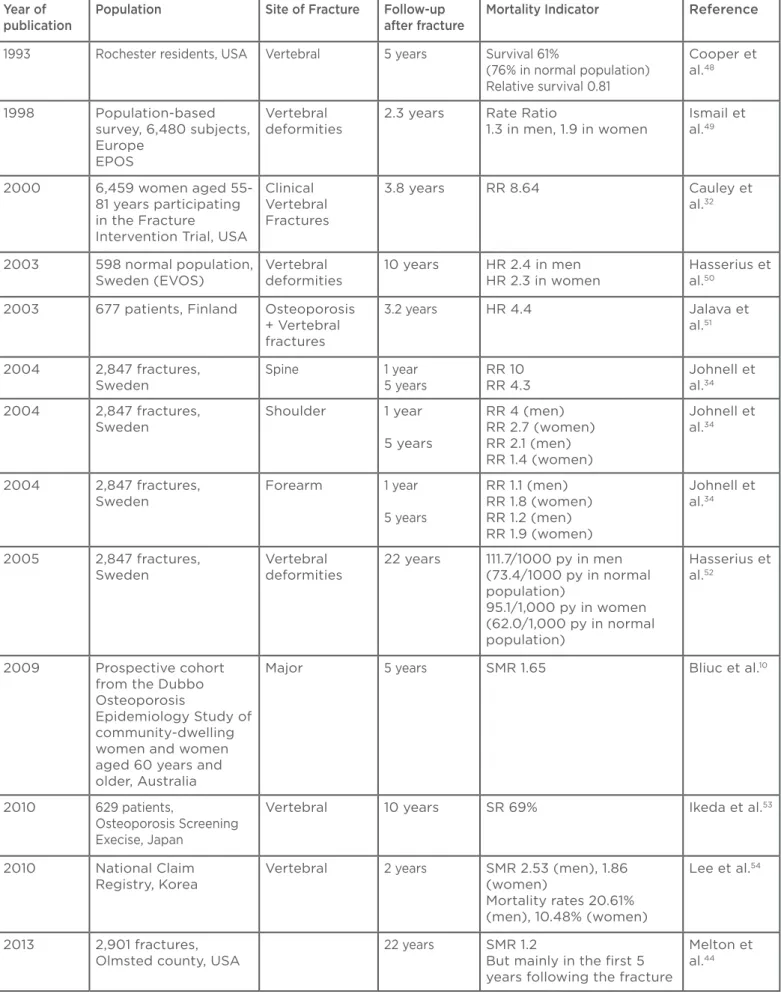
2. Mortality Following Fractures at Sites other
than the Hip
Osteoporotic fractures at sites other than the hip
also lead to a high number of excess deaths.
5,45,46Most deaths occur within 1 year of fracture,
particularly during the first 6 months.
47Mortality
following fractures is higher in men than in women.
5The Dubbo study from Australia reported that a
high mortality is associated with any type of major
fracture compared to the general population,
10and
that this excess mortality persists up to 5 years
after all major types of fracture. Many studies,
however, showed that mortality rates after forearm
fracture are similar to the general population.
10,34The mortality indicators are shown in
Table 2
by study, by chronological order of publication.
Due to the heterogeneity of the studies, a direct
comparison cannot be made, but again, in the same
cohort, there is a decline in excess mortality with
time and higher mortality in males.
pelvis, shoulder). Fractures at the forearm were
not associated with excess mortality. As for time,
the mortality risk was higher in the immediate
post-fracture period and declined subsequently,
remaining however higher than the normal
population up to 10 years after the occurrence of
the fracture.
However, most factors were independent from
the fracture
per se
and yet predicted excess
mortality.
26,37,38,55-57These can be divided in
demographic factors, such as age and male
gender, and factors reflecting a poor general
health status: the number of co-medications,
associated chronic diseases (two or more), Charlson
index CI) components and medications, low score
on entality status test, not walking outdoors
before the fracture, lower handgrip strength, use
of walking aids, level of social dependence, and
being in an institution. It is noticeable that the
CI components encompass several chronic
diseases. A comparable mortality with the normal
opulations was suggested in the absence of
risk factors such as low mentality status, low
handgrip strength, and fewer than two associated
chronic diseases.
55Finally, the non-operative conservative management
is also associated with poorer outcome. However,
this finding could be due to selection bias; the
patients chosen for conservative management may
have a lower health status or be at higher mortality
risk initially, preventing them from reaching the
operative option.
4. Mortality Associated with Low BMD
Except for pulmonary deaths in women with
severe vertebral deformities and kyphosis, strong
associations of osteoporotic fractures with
specific causes of death have not been identified,
suggesting an indirect association with underlying
comorbid conditions that may also lead to
osteoporosis.
46This is consistent with the notion
that low BMD
per se
is associated with excess
mortality from various causes.
28,31,45,46,48,49Low BMD is responsible for a growing global
health burden, only partially representative of
the real burden of osteoporosis. In fact a recent
meta-analysis showed that global deaths
attributable to low BMD increased between 1990
and 2010, and that low BMD could be responsible
for at least one-third of deaths attributable to falls,
which is third in the list of major health burdens
after road injuries and self-harm.
58,59BMD was shown to be associated with mortality
independently of age, weight, body mass index,
smoking status, previous fracture, physical activity,
drug use, and presence of chronic diseases. Low
BMD was defined in the studies by low values
measured by Dual Energy X-ray Absorptiometry
or calcaneus quantitative ultrasound. HR was
calculated by linear reduction of 1 standard
deviation (SD) of bone density or broadband
ultrasonic attenuation (
Table 3
). The risk of
mortality at 5 years was inversely correlated with
BMD with HRs of 1.16-1.44, except for one study
that included a clinical endpoint (height loss),
where HRs were higher (3.43).
60-65Factors associated with excess mortality in
osteoporosis cohorts are mainly CI components
and Elixhauser index.
66The Charlson comorbidity
index predicts the 10-year mortality for a patient
who may have a range of comorbid conditions,
such as myocardial infarction, congestive heart
failure, peripheral vascular disease, dementia,
cerebrovascular disease, chronic lung disease,
connective tissue disease, ulcer, chronic liver
disease, diabetes, haemiplegia, moderate or severe
kidney disease, diabetes with end-organ damage,
tumour, leukaemia, lymphoma, moderate or severe
liver disease, malignant tumour, metastasis, and
AIDS.
67The Elixhauser comorbidity measure
Table 1: Summary of studies addressing mortality after hip fracture.
Year Population Follow-up after
hip fracture
Mortality Indicator Reference
1991 Medicare hip fractures population, USA 90 days
1 year
CF 12.6% CF 23.7%
Fisher et al.30
1996 9,704 ambulatory women aged 65 years or older
enrolled in the SOF
5.9 years RR 2.4 Browner et
al.31
1997 578 community-dwelling females aged 70 and
older, USA
5 years Excess death 9% Magaziner et
al.31
2000 6,459 women aged 55-81 years participating in
the FIT, USA
3.8 years RR 6.68 Cauley et al.32
2001 Residents aged 60 years and older 5 years Men: Mortality ratio 540%,
excess death rate 57
Women: Mortality ratio 500%, excess death rate 32
Iacovino et
al.33
2004 Hospital setting, Sweden 1 year
5 years
RR 10.2 (men) RR 9.1 (women) RR 5.8 (men) RR 5.4 (women)
Johnell et al.34
2004 Prospective, 7,512 volunteer ambulatory women
aged 75 and older, France (EPIDOS study)
3.9 years RR 2
MR 112.4 per 1,000
woman-years, compared with 27.3 per 1,000 woman-years for the non-fractured
Empana et
al.25
2007 43,165 veterans, USA 1 year Mortality odds:
12% in women 32% in men
Bass et al.35
2009 Prospective cohort from the Dubbo Osteoporosis
Epidemiology Study of community-dwelling women and women aged 60 years and older, Australia
10 years SMR 2.43 Bliuc et al.10
2009 786,717 hip fractures aged 65 and older,
Medicare, USA
1 year MRs
32.5% (men) 22% (women)
Brauer et al.20
2010 South Korea
NHI claims database 9,817 hip fractures
1 year SMR 2.85 Kang et al.36
2010 Prospective cohort hip fractures, Taiwan 1 year MR
31% men 16% women
Mortality 8-times higher than age-adjusted general population
Vaseenon et
al.37
2010 National Hospital Discharge Register
41,000 hip fractures, Denmark
1 year CM
37.1% men 26.4% women SMR in the <75 years 7.9 men
Kannegaard
CF: case fatality; SOF: Study of Osteoporotic Fractures; FIT: Fracture Intervention Trial; RR: Relative Risk;
EPIDOS: Epidemiology of Osteoporosis Study; MR: mortality rate; NHI: National Health Insurance; SMR:
standardised mortality ratio; CM: cumulative mortality; HR: hazard ratio; RS: relative survival.
Figure 1: Mortality indicators after hip fracture by study and by time to fracture.
Mortality indicators are derived from different studies and different populations. RR (dots): relative risk,
defined as the ratio of the probability of an event (mortality) occurring in an exposed group (fracture) to
the probability of the event in a comparison non-exposed group (population). SMR (squares): standardised
mortality ratio, defined as the ratio of the observed deaths in the study group (fracture) to expected deaths
in the general population. HR (cross): hazard ratio, defined in survival analysis as the ratio of probability of
death in the fracture arm compared to the non-fracture arm.
RR, men, Johnell 200434
SMR, Kannegaard 201038
SMR, Finnes 201318
HR, Kang 201036
RR, Cauley 200032
RR, men, Johnell 200434
RR, Browner 199631
SMR, Bliuc 200910
SMR, Melton 201344
RR, Empana 200425
SMR, Wang 201343
SMR, Wang 201343
SMR, Wang 201343
SMR, Omsland 201414
Mortality Indica
tor
12
10
8
6
4
2
0
0 5 10 15 20 Years Since Hip Fracture
Year Population Follow-up after
hip fracture
Mortality Indicator Reference
2013 Population-based cohort of 63,257
middle-aged and elderly Chinese men and women in Singapore
5 years HR 1.64 (men)
HR 1.58 (women)
Koh et al.41
2013 5,180 hip fractures, Norway 1 year SMR 3.64 (men)
SMR 2.78 (women)
Finnes et al.18
2013 Dubbo Osteoporosis Epidemiology Study,
Australia 1 year
5 years
10 years
RS
0.83 in women 0.63 in men 0.59 in women 0.48 in men 0.31 in women 0.36 in men
Frost et al.42
2013 National Insurance Database
143,595 hip fractures, Taiwan
1 year 2 years 5 years 10 years
SMR 9.67 SMR 5.28 SMR 3.31 SMR 2.89
Wang et al.43
2013 Population-based cohort study, 2,901 residents,
USA
22 years SMR 1.2 Melton et al.44
2014 81,867 first hip fracture patients
(nationwide), Norway
1 year SMR 4.6 men
SMR 2.8 women
Omsland et
al.14
Table 2: Summary of studies addressing mortality after fracture at sites other than the hip.
Year of publication
Population Site of Fracture Follow-up after fracture
Mortality Indicator Reference
1993 Rochester residents, USA Vertebral 5 years Survival 61%
(76% in normal population) Relative survival 0.81
Cooper et
al.48
1998 Population-based
survey, 6,480 subjects, Europe
EPOS
Vertebral deformities
2.3 years Rate Ratio
1.3 in men, 1.9 in women
Ismail et
al.49
2000 6,459 women aged
55-81 years participating in the Fracture
Intervention Trial, USA
Clinical Vertebral Fractures
3.8 years RR 8.64 Cauley et
al.32
2003 598 normal population,
Sweden (EVOS)
Vertebral deformities
10 years HR 2.4 in men
HR 2.3 in women
Hasserius et
al.50
2003 677 patients, Finland Osteoporosis
+ Vertebral fractures
3.2 years HR 4.4 Jalava et
al.51
2004 2,847 fractures,
Sweden
Spine 1 year
5 years
RR 10 RR 4.3
Johnell et
al.34
2004 2,847 fractures,
Sweden
Shoulder 1 year
5 years
RR 4 (men) RR 2.7 (women) RR 2.1 (men) RR 1.4 (women)
Johnell et
al.34
2004 2,847 fractures,
Sweden
Forearm 1 year
5 years
RR 1.1 (men) RR 1.8 (women) RR 1.2 (men) RR 1.9 (women)
Johnell et
al.34
2005 2,847 fractures,
Sweden
Vertebral deformities
22 years 111.7/1000 py in men
(73.4/1000 py in normal population)
95.1/1,000 py in women (62.0/1,000 py in normal population)
Hasserius et
al.52
2009 Prospective cohort
from the Dubbo Osteoporosis
Epidemiology Study of community-dwelling women and women aged 60 years and older, Australia
Major 5 years SMR 1.65 Bliuc et al.10
2010 629 patients,
Osteoporosis Screening Execise, Japan
Vertebral 10 years SR 69% Ikeda et al.53
2010 National Claim
Registry, Korea
Vertebral 2 years SMR 2.53 (men), 1.86
(women)
DISCUSSION AND CONCLUSION
We reviewed population studies addressing
osteoporosis-related mortality, and identified a
trend towards decreasing mortality over time. This
review has some limitations. The included studies
present a high degree of heterogeneity: different
populations, different methodologies. The mortality
indicators were highly heterogeneous, which also
limits the comparisons. This heterogeneity may result
in biased interpretation of comparability between
populations at the same time point, between
different populations at different time points,
but also within the same populations at different
time points. When separated by decades,
confounding factors such as higher life expectancy
may interfere with the interpretation of trends of
crude mortality rates.
When considering major endpoints such as
mortality, the patient should be viewed as a whole
and their prognosis cannot be summarised by a
single risk factor figure or a single health event.
Otherwise healthy and fit patients do not seem to
have increased mortality subsequent to the fracture.
Male sex, age, site of fracture, the immediate
post-fracture period, and poor general health status
seem to be universally accepted risk factors for
excess mortality.
Some risk factors, when taken individually, may be
subject to controversies in different studies. Obesity
for example is traditionally associated with lower
fracture rates, but recent data from the GLOW
study
70suggest that obesity is associated with
higher fracture rates at some specific sites such as
the ankle
26and also with longer hospital stays and
poorer functional status.
71Due to the important contribution of comorbidities
to mortality associated with osteoporosis, a general
multivariable approach is suggested to predict
mortality, rather than individual indicators such
as BMD. Predictive models, similar to models used
in cardiovascular diseases, may be developed
for more patient-tailored preventive programmes
in the future.
Table 3: Summary of studies addressing mortality associated with low BMD.
Year of publication
Population Site of BMD Follow-up Mortality Indicator Reference
2002 5,816 women, aged 70
years and above, USA
Quantitative Ultrasound of calcaneus
5 years HR 1.16 Bauer et
al.60
2006 275 postmenopausal
elderly women, Brazil
Femur dual energy X-ray absorptiometry
5 years HR 1.44 (total mortality)
HR 1.28 (cardiovascular mortality)
Pinheiro et
al.61
2010 3,145 community dwelling
people aged 65 years and above, China
Height Loss >2 cm, correlated with low BMD
5 years HR 3.43 Auyeung et
al.62
2011 1,429 ambulatory
postmenopausal female volunteers aged over 50 years, Japan
Lumbar spine BMD
4.5 years HR 1.39 Shiraki et
al.63
2013 Prospective
population-based observational study on 390 white North European women
aged 48 at study start, Sweden
Distal forearm BMD
3.4 years RR 1.36 Svejme et
al.65
BMD: bone mineral density; RR: relative risk; HR: hazard ratio.
1. Johnell O et al. The burden of hospitalized fractures in Sweden. Osteoporos Int. 2005;16(2):222–8.
2. Genant HK et al. Interim report and recommendations of the World Health Organization Task-Force for Osteoporosis. Osteoporos Int. 1999;10(4):259–64.
3. European Commission (EC) and International Osteoporosis Foundation (IOF). Osteoporosis in the European community – action for prevention. 1998. Available: http://www.iofbonehealth.org/ european-policy-reportsl.
4. Johnell O, Kanis J. Epidemiology of osteoporotic fractures. Osteoporos Int. 2005;16(suppl 2):S3–7.
5. Cummings SR, Melton LJ. Epidemiology and outcomes of osteoporotic fractures. Lancet. 2002;359(9319):1761–7.
6. Korhonen N et al. Continuous decline in incidence of hip fracture: nationwide statistics from Finland between 1970 and 2010. Osteoporos Int. 2013;24(5): 1599-603.
7. Nieves JW et al. Fragility fractures of the hip and femur: incidence and patients characteristics. Osteoporosis Int. 2010;21(3):399-408.
8. Leslie WD et al. Trends in hip fracture rates in Canada. JAMA. 2009;302:883–9. 9. Chevalley T et al. Incidence of hip fracture over a 10-year period (1991– 2000): reversal of a secular trend. Bone. 2007;40:1284–9.
10. Bliuc D et al. Mortality risk associated with low-trauma osteoporotic fracture and subsequent fracture in men and women. JAMA. 2009;301(5):513–21. 11. Abrahamsen B et al. Excess mortality following hip fracture: a systematic epidemiological review. Osteoporos Int. 2009;20(10):1633–50.
12. Vestergaard P et al. Has mortality after a hip fracture increased? J Am Geriatr Soc. 2007;55(11):1720–6.
13. Roberts SE, Goldacre MJ. Time trends and demography of mortality after fractured neck of femur in an English population, 1968–98: database study. BMJ. 2003;327(7418):771–5.
14. Omsland TK et al. Mortality following
17. Giversen IM. Time trends of mortality after first hip fractures. Osteoporos Int. 2007;18(6):721–32.
18. Finnes TE et al. Secular reduction of excess mortality in hip fracture patients >85 years. BMC Geriatr. 2013;13:25. 19. Ziadé N et al. Population-level impact of osteoporotic fractures on mortality and trends over time: a nationwide analysis of vital statistics for France, 1968-2004. Am J Epidemiol. 2010;172(8):942-51.
20. Brauer CA et al. Incidence and mortality of hip fractures in the United States. JAMA. 2009;302(14):1573–9. 21. Handoll HH, Sherrington C. Mobilisation strategies after hip fracture surgery in adults. Cochrane Database Syst Rev. 2007;(1):CD001704.
22. Handoll HH et al. Heparin, low molecular weight heparin and physical methods for preventing deep vein thrombosis and pulmonary embolism following surgery for hip fractures. Cochrane Database Syst Rev. 2000;(2):CD000305.
23. Stafford RS et al. National trends in osteoporosis visits and osteoporosis treatment, 1988–2003. Arch Intern Med. 2004;164(14):1525–30.
24. Ringa V et al. Trends in the use of hormone replacement therapy in eastern France between 1986 and 1993. Eur J Public Health. 1999;9(4):300–5.
25. Empana JP et al. Effect of hip fracture on mortality in elderly women: the EPIDOS prospective study. J Am Geriatr Soc. 2004;52:685–90.
26. Melton 3rd LJ et al. Predictors of excess mortality following fracture: a population-based cohort study. J Bone Miner Res. 2014;doi:10.1002/jbmr.2193. [Epub ahead of print].
27. Kanis JA et al. The components of excess mortality after hip fracture. Bone. 2003;32(5):468-73.
28. Melton 3rd LJ. Adverse outcomes of osteoporotic fractures in the general population. J Bone Miner Res. 2003;18(6):1139-41.
29. Poor G et al. Determinants of reduced survival following hip fractures in men. Clin Orthop. 1995;319:260–5.
33. Iacovino JR. Mortality outcomes after osteoporotic fractures in men and in women. J Insur Med. 2001;33(4):316-20. 34. Johnell O, Kanis JA. An estimate of the worldwide prevalence, mortality and disability associated with hip fracture. Osteoporos Int. 2004;15(11):897-902. 35. Bass E et al. Risk-adjusted mortality rates of elderly veterans with hip fractures. Ann Epidemiol. 2007;17:514–9.
36. Kang HY et al. Incidence and mortality of hip fracture among the elderly population in South Korea: a population-based study using the national health insurance claims data. BMC Public Health. 2010;10:230.
37. Vaseenon T et al. Long-term mortality after osteoporotic hip fracture in Chiang Mai, Thailand. J Clin Densitom. 2010;13(1):63-7.
38. Kannegaard PN et al. Excess mortality in men compared with women following a hip fracture. National analysis of comedications, comorbidity and survival. Age and Ageing. 2010;39:203–9.
39. Karantana A et al. Epidemiology and outcome of fracture of the hip in women aged 65 years and under. J Bone Joint Surg [Br]. 2011;93-B:658-64.
40. Gronskag AB et al. Excess mortality after hip fracture among elderly women in Norway. The HUNT study. Osteoporos Int. 2012;23(6):1807-11.
41. Koh GC et al. All-cause and cause-specific mortality after hip fracture among Chinese women and men: the Singapore Chinese Health Study. Osteoporos Int. 2013;24(7):1981-9.
42. Frost S et al. Excess mortality attributable to hip-fracture: a relative survival analysis. Bone. 2013;56:23–9. 43. Wang C et al. Excess mortality after hip fracture among the elderly in Taiwan: a nationwide population-based cohort study. Bone. 2013;56:147–53.
44. Melton 3rd LJ et al. Long-term mortality following fractures at different skeletal sites: a population-based cohort study. Osteoporosis Int. 2013;24(5): 1689-96.
45. Center JR et al. Mortality after all
48. Cooper C et al. Population-based study of survival after osteoporotic fractures. Am J Epidemiol. 1993;137(9):1001-5. 49. Ismail AA et al. Mortality associated with vertebral deformity in men and women: results from the European Prospective Osteoporosis Study (EPOS). Osteoporos Int. 1998;8(3):291-7.
50. Hasserius R et al. Prevalent vertebral deformities predict increased mortality and increased fracture rate in both men and women: a 10-year population-based study of 598 individuals from the Swedish cohort in the European Vertebral Osteoporosis Study. Osteoporos Int. 2003;14(1):61-8.
51. Jalava T et al. Association between vertebral fracture and increased mortality in osteoporotic patients. J Bone Miner Res. 2003;18(7):1254-60.
52. Hasserius R et al. Long-term morbidity and mortality after a clinically diagnosed vertebral fracture in the elderly--a 12- and 22-year follow-up of 257 patients. Calcif Tissue Int. 2005;76(4):235-42.
53. Ikeda Y et al. Mortality after vertebral fractures in a Japanese population. J Orthop Surg (Hong Kong). 2010;18(2): 148-52.
54. Lee YK et al. Mortality after vertebral fracture in Korea: analysis of the National Claim Registry. Osteoporos Int. 2012;23(7):1859-65.
55. Meyer HE et al. Factors associated with mortality after hip fracture. Osteoporos Int. 2000;11(3):228-32.
56. Tarity TD et al. Mortality in centenarians with hip fractures. Orthopedics.
2013;36(3):e282-7.
57. Baudoin C et al. Clinical outcomes and mortality after hip fracture: a 2-year follow-up study. Bone. 1996;18:149S–57S. 58. Sànchez-Riera L et al. The global burden attributable to low bone mineral density. Ann Rheum Dis. 2014;doi:10.1136/ annrheumdis-2013-204320. [Epub ahead of print].
59. Waterloo S et al. Important risk factors and attributable risk of vertebral fractures in the population-based Tromsø study. BMC Musculoskelet Disord. 2012;13:163. 60. Bauer DC et al; Study of Osteoporotic Fractures Research Group. Quantitative ultrasound and mortality: a prospective study. Osteoporos Int. 2002;13(8):606-12. 61. Pinheiro MM et al. Low femoral bone mineral density and quantitative ultrasound are risk factors for new osteoporotic fracture and total and cardiovascular mortality: a 5-year population-based study of Brazilian elderly women. J Gerontol A Biol Sci Med Sci. 2006;61(2):196-203.
62. Auyeung TW et al. Effects of height loss on morbidity and mortality in 3145 community-dwelling Chinese older women and men: a 5-year prospective study. Age and Ageing. 2010;39:699–704. 63. Shiraki M et al. Established osteoporosis associated with high mortality after adjustment for age and co-morbidities in postmenopausal Japanese women. Intern Med. 2011;50:397-404.
64. Johannson et al. Low bone mineral density is associated with increased mortality in elderly men: MrOs Sweden.
Osteoporosis Int. 2011;22(5):1411-8.
65. Svejme O et al. Low BMD is an independent predictor of fracture and early menopause of mortality in post-menopausal women – a 34-year prospective study. Maturitas. 2013;74(4):341–5.
66. Lix LM et al. Performance of comorbidity measures for predicting outcomes in population-based osteoporosis cohorts. Osteoporos Int. 2011;22(10):2633-43.
67. Charlson ME. A new method of classifying prognostic comorbidity in longitudinal studies: development and validation. Journal of Chronic Diseases. 1987;40(5):373–83.
68. Sharabiani M et al. Systematic review of comorbidity indices for administrative data. Medical Care. 2012;50(12):1109–18. 69. Van Walraven C. A modification of the Elixhauser comorbidity measures into a point system for hospital death using administrative data. Medical Care. 2009;47(6):626–33.