UNIVERSIDADE ESTADUAL PAULISTA “JULIO DE MESQUITA FILHO”
INSTITUTO DE GEOCIÊNCIAS E CIÊNCIAS EXATAS
Trabalho de Formatura
Curso de Graduação em Geologia
STRONTIUM ISOTOPES MEASUREMENT FROM BUNKER CAVE SYSTEM: A CONTRIBUTION FOR THE MULTI-PROXY PALEOCLIMATE RESEARCH OF CENTRAL EUROPE
Cintia Fernandes Stumpf
Prof. Dr. Daniel Marcos Bonotto Prof. Dr. Augusto Mangini
Rio Claro (SP)
UNIVERSIDADE ESTADUAL PAULISTA
Instituto de Geociências e Ciências Exatas
Câmpusde Rio Claro
CINTIA FERNANDES STUMPF
STRONTIUM ISOTOPES MEASUREMENT FROM
BUNKER CAVE SYSTEM: A CONTRIBUTION FOR THE
MULTI-PROXY PALEOCLIMATE RESEARCH OF
CENTRAL EUROPE
.
Trabalho de Formatura apresentado ao Instituto de Geociências e Ciências Exatas - Câmpus de Rio Claro, da Universidade Estadual Paulista Júlio de Mesquita Filho, para obtenção do grau de Geólogo.
Comissão Examinadora
Augusto Mangini, Prof. Dr. at Heidelberg University AmauriAntônioMenegário, Prof. Dr. at UNESP University
Leticia Hirata Godoy, Prof. MSc. at UNESP University
Rio Claro, 28 de Junho de 2013.
ACKNOWLEDGEMENTS
I am really grateful to the people who assisted me during this first scientific journey, particularly to Andrea Schröder-Ritzrau for the constructive reviews and Augusto Mangini for the opportunity to realize my Bachelor these in Umweltphysik Institute, Heidelberg/Germany. I would like to thank René Eichstädter for the long German classes and also the technical approach, Sylvia Riechelmann for the field excursions to Bunker cave. This project would not be done without the support from DAPHENE research group.
ABSTRACT
In recent years speleothem has been intensely studied due to its great potential of registering paleoclimate proxies but some considerably uncertaintiesregarding speleothem proxy interpretation still exist. In order to minimize these uncertainties, multi-proxy approach has been used. Here is presented the strontium isotope record from Bunker cave, northwest Germany. This cave was previously studied and has proved well record paleoclimate changes during Holocene for central Europe.87Sr/86Sr ratio is presented for rain water, A-horizon soil (water and leachate), C-horizon soil (water and leachate), host rock and host rock leachate, drip water and from a stalagmite (Bu4) previously dated covering the Holocene. Upper soil presented the higher values in contrast with host rock (lower values). Drip water and C-horizon presented intermediated ratios. Sr isotopesare used to track the source of 87Sr/86Sr in the Bunker system, resulting in a mixture between A-horizon soil, C-horizon soil and host rock. A decreasing trend in Bu4 indicates change in the Sr source in the system.
RESUMO
Nos últimos anos espeleotemas tem sido intensamente estudados devido ao seu grande potencial de registro de proxies paleoclimáticas, mas ainda existem algumas incertezas consideráveis em relação à interpretação das proxies em espeleotemas. A fim de minimizar estas incertezas, aproximação multi-proxy tem sido utilizada. Aqui é apresentado o registro isótopos de estrôncio da caverna Bunker, noroeste da Alemanha. Esta caverna foi previamente estudada e provou registrar bem mudanças paleoclimáticas durante o Holoceno na Europa central. Razão de 87Sr/86Sr é apresentada para a água da chuva, horizonte A do solo (agua e solução lixiviada), horizonte C do solo (áua e solução lixiviada), rocha hospedeira e lixiviado da rocha, água de gotejamento e de uma estalagmite (Bu4) previamente datada, cobrindo o Holoceno. O solo orgânico apresentou os valores mais elevados, em contraste com a rocha hospedeira (valores de razão menores). Água de gotejamento e horizonte-C do solo apresentaram índices intermediários. Isótopos de Sr são utilizados para rastrear a fonte de 87Sr/86Sr no sistema Bunker, resultando em uma mistura entre o horizonte A do solo, horizonte C do solo e rocha hospedeira. Uma tendência descendente na Bu4 indica mudança na fonte de Sr no sistema.
List of Figures
Figure 1 - Location of Bunker cave. The European continent/ Germany / North
Rhine-Westphalia state / Bunker Cave ... 15
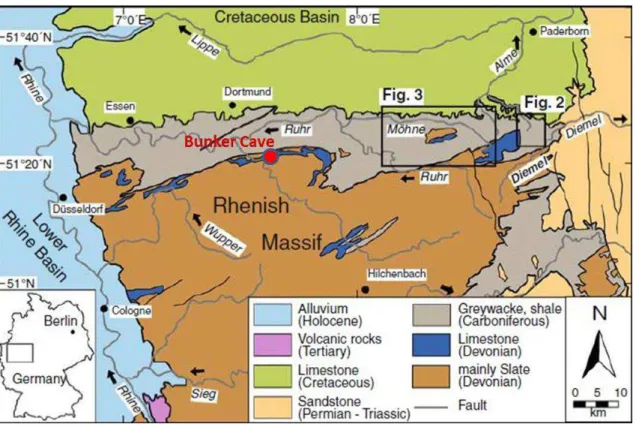
Figure 2 - Geological map of the Rhenish Slate Mountains. ... 18
Figure 3 - The comprehensive karst system ... 23
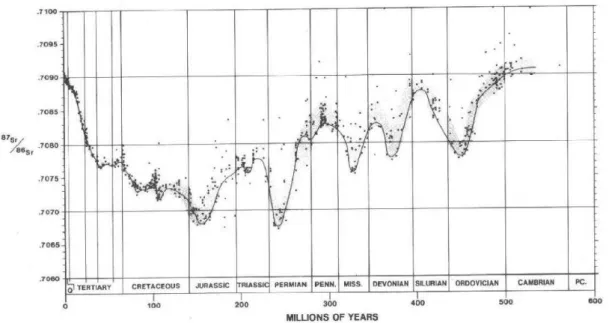
Figure 4 - The curve of 87Sr/86Sr versus geologic time. ... 27
Figure 5 -Fractioning correction normalizing the measured ratio to a fixed absolute 88/86Sr value ... 30
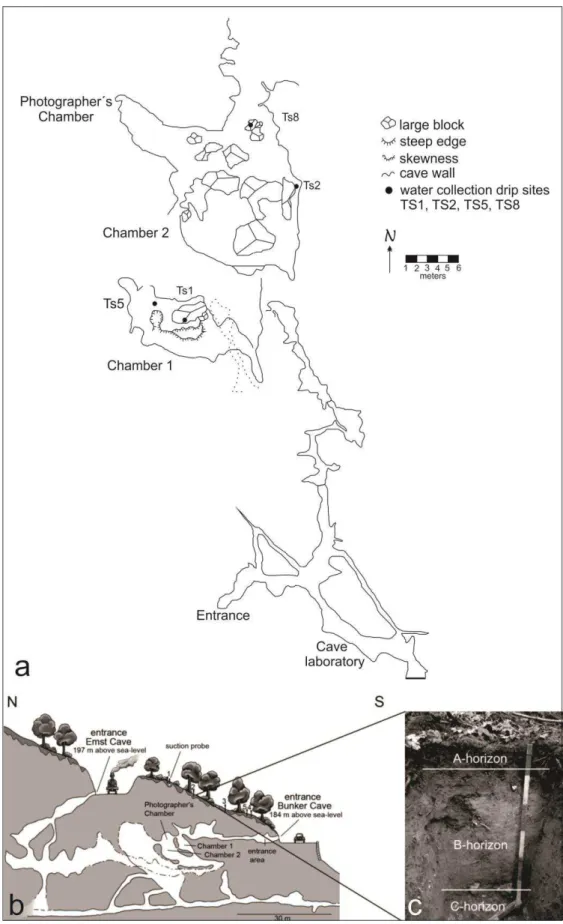
Figure 6 - Survey map of the monitoring chambers of Bunker Cave and longitudinal profile of the cave ... 32
Figure 7 - Acid dependency of k´ for various ions at 23-25ºC. ... 34
Figure 8 - Bu4 stalagmite, with the depth of samples made. ... 35
Figure 9 - Flowchart representing the chromatographic column process for separating Sr ... 37
Figure 10 - Distribution of ratio values from different source samples. ... 40
Figure 11 - Synthesis diagram with the minimum, maximum and mean values of 87Sr/86Sr ratio. ... 41
Figure 12 - Soil water samples ... 42
Figure 13 -87Sr/86Sr from soils leachates and total digestion ... 43
Figure 14 - HR 87Sr/86Sr ratios. ... 44
Figure 15 -87Sr/86Sr ratio for Bu4 stalagmite. ... 45
Figure 16 - Comparison between 87Sr/86Sr ratio from stalagmite and drip water.. ... 45
List of Tables
Table 1 - The four strontium isotopes, their masses and relative abundance in nature. ... 28
Table 2: Summary of the samples used in this study, all related to Bunker Cave System. ... 32
Table 3 - Flowchart differing the solid and fluid phases and the sequential stacking materials analyzed, as well as the mean value of its 87Sr/86Sr ratios. Notice the lower ratio value for the
L
IST OF ABBREVIATIONS AND ACRONYMSBu4 Stalagmite
BuS Bunker cave soil
DW Drip Water
HR Host rock
MS Mass Spectrometry
MW Meteoric Water
PCP Prior Calcite Precipitation
REE Rare Earth Elements
RW Rain Water
SW Soil Water
TD Total Digestion
S
UMMARY1.0
I
NTRODUCTION... 12
1.1 Stalagmite as paleoclimate proxy ... 12
1.2 General setting of the Bunker Cave and Related Environment ... 13
1.2.1 Access and Location ... 15
1.2.2 Soil, Vegetation and Climate ... 15
1.2.3 Geology and Geomorphology... 17
1.2.4 Geology of the Cave ... 19
2.0
OBJECTIVES ... 21
3.0
T
HEORETICALB
ACKGROUND... 22
3.1 Aspects on Karst Science ... 22
3.1.1 Karst system and Karst Hydrogeology... 22
3.1.2 Speleothems ... 25
3.2 Aspects on Isotopic Analyses ... 26
3.2.1 Isotopic data on paleoclimate and environmental science ... 26
3.2.2 The Strontium Isotopes ... 28
4.0
M
ETHODOLOGY... 31
4.1 Source of the Samples ... 31
4.2 Equipment... 33
4.3 Reagents ... 33
4.4 Procedure ... 34
4.4.1 Rock Samples preparation ... 34
4.4.2 Soil Samples preparation ... 35
4.4.3 Water Samples preparation... 36
4.5 Chemistry process... 36
4.6 Mass spectrometry analyses ... 37
5.0
RESULTS ... 39
5.1 Rain Water ... 41
5.2 Soil water and soil leachates ... 41
5.3 Host Rock ... 43
5.4 Stalagmite and Drip Water ... 44
7.0
C
ONCLUSIONS... 53
REFERENCES ... 55
B
IBLIOGRAPHY... 58
A
PPENDIXA
–
S
AMPLE LIST... 59
1.0INTRODUCTION
1.1 Stalagmite as paleoclimate proxy
Proxies are any parameters that can be measured in an archiveand which stand in, or substitute for an environmental variable (FAIRCHILD and BAKER, 2012). To high-resolution climate proxy, it is understood monthly to decadal high-resolution, that can be obtained from lake or marine sediments, speleothems, ice cores, corals, tree rings and also human archive from documentary records (COBB et al 2008). Monthly to annually resolved speleothem proxy records are still extremely rare (FLEITMANN et al 2008). Speleothems (stalagmites, stalactites and flowstones) as proxy is a recent resource for paleoclimate investigation.
With the increase interest on speleothems in science due to the potential to new studies and interpretation in the environmental changes,Fairchild and Baker (2012) attempt to concentrate the knowledge on the theme, clarifying, among other topics, the preferential use of stalagmite as a paleoclimate proxy among other speleothems (described below).
First, stalagmitesmay be precisely dated. The development of techniques for precise and accurate U-Th dating on small amounts of sample (each sedimentation layer) is the most important factor that has allowed speleothem science to become so prominent in recent years. The main principle is that during speleothem growth, it incorporates some uranium from aqueous solution, but fails to incorporate the insoluble element thorium. The nuclide 230Th accumulates over time, by alpha-decay from 234U, after that particular speleothem growth layer has been deposited. The half-life of 234U is around 245.000 years and 230Th around 75.400 years.
Another point might be the substantial contribution of the last decade research to paleoclimate records that placed speleothems at the forefront of paleoenvironment reconstructions (FLEITMANN et al 2008), despite the great uncertaintythat is often present. As speleothems contain several proxy parameters that can be used singly or in combination, multiple proxies are being developed to better understand the climatic changes. It may be more effective for our comprehension the use of multi-proxy approaches available on stalagmites to reduce the uncertainties.
the preservation of information, different from other proxies in which the information can be lost due e.g. to erosion orbioturbation. Speleothems are also widespread in inhabited continental areas, principally in northern hemisphere were large carbonate areas present karstic regions with stalagmites recording the continental past climate. This kind of rock is also physically and chemically robust, contributing to collection and laboratory procedure.
1.2General setting of the Bunker Cave and Related Environment
Bunker cave was discovered in 1926 during road works, but only in 1989 the deeper parts of the cave were explored by opening a narrow crevice. The entrance area is artificially enlarged due to its use as an air-raid shelter during the second Word War. It is an intensively studied karst area (NIGGEMANN et al., 2008; NIGGEMANN et al., 2003; DREYER et al., 2008), one of the reasons for the choice of this cave for the paleoclimate studies (RIECHELMANN et al. 2011). A gate protects the little entrance (with an approximated dimension of 1m X 60 cm) nearby the road, offering an easy accessibility during all year´s period.
The cave has a central European location (see item 1.2.1), in the so called Rhenish Slate Mountains, NW Germany, and it is part of a 3,5km long cave system with Emst cave. They are connected by a narrow and impassable cleft.The cave system is inserted in a 700 meter thick Middle to Upper Devonian limestone unity, composed by low-Mg limestone hosting thin dolomite veins. The thickness of the host rock above the cave ranges from 15 to 30m (FOHLMEISTER et al., 2012).
The Sauerland, region where Bunker cave is inserted, is a hilly area spreading across most of the southeast part of North Rhine Westphalia Bundesland. It is today an important touristic region, in particular for outdoor sports and scenic recreation. It is limited in west by the Bergische Land, to the south by Siegerland, to the north by Haarstrang and Hellwegzone and to the east by Bergland (Waldecker Land) (fig. 1). The major rivers of the Sauerland are the Ruhr and Lenne rivers (BAALES et al, 2011).
prehistory and also of archaeological research, since the first finding of human prehistory have been developed for central Europe.
In present days the cave is above the groundwater level however it still an active cave with percolation of meteoric water. From the monitoring data (RIECHELMANN et al., 2011), it presents a mean air cave temperature of 10,6ºC and a mean value of cave air humidity of 93%.
Figure 1 -Location of Bunker cave. a) The European continent featured Germany boundary, in the central European region; b) limits of Germany. The North Rhine-Westphalia state is highlighted and Bunker Cave location is indicated; c) a detailed view on the North Rhine-Westphalia state, showing the limits of Sauerland region and the position of Bunker Cave in relation to the geologic context of Rhenish Slate Mountains. Source: Google Earth image. Assessed in 15.04.2013.
1.2.1 Access and Location
Bunker Cave is located on the Rhenish Slate Mountains, western part of Germany (Sauerland), central Europe, exactly in Iserlohn city. The biggest and reference city nearby is Dortmund. The entrance of the cave (fig. 1) is in the coordinate 51º22´03´´N ; 7º39´53´´E, 184 m above sea level on a south dipping hill slope of the DröschederEmst, a small karst plateau with approximately 1Km2 (RIECHELMANN et al. 2011).
The Sauerland region can be reached by car or train. By car, the drive should be either via the E37 road from Cologne or via E30 road from Berlin (capital). From Dortmund, the largest city in the Ruhr Area, approximately 35 Km from Iserlohn, it is possible to reach Iserlohn by via E41. By train, it is reachable by Regional Express 16 (Essen – Hagen – Letmathe - Iserlohn - Siegen), Regional Bahn 53 (Iserlohn – Schwerte - Dortmund) or either Regional Bahn 91 (Hagen – Letmathe – Iserlohn – Siegen). The closest commercial airport is Dortmund Airport.
1.2.2 Soil, Vegetation and Climate
The formation of soil during the Holocene in the Rhenish Massif depends largely on the vertical sequence of Pleistocene periglacial slope deposits and on the degree of alteration of the underlying slates (SAUER& FELIX-HENNIGSEN, 2006). The soil profile above the cave has up to 70 cm thick (see fig. 6) and consist of a weathered material from the limestone host rock and loess/debris deposits from Pleistocene epoch.
The limestone surface is covered by brown and loamy soil (inceptisol/alfisol developed from loess loam). A thin humic A-horizon with less than 10 cm thick covers a brown/yellow B-horizon, which originated from loess loam and frequently contains limestone fragments. The C-horizon consists of the massive limestone, the host rock (FOHLMEISER et al. 2012).
of the word´s ice free land surface. In other hand, an alfisol is in semiarid to moist areas. These soils result from weathering processes that leach clay minerals and other constituents out of the surface layer and into the subsoil, where they can hold and supply moisture and nutrients to plants. They were formed primarily under forest or mixed vegetative cover and are productive for most crops. It makes up about 10% of the word´s ice-free land surface (NRCS, 2013).
The soil water present a alkali pH of 7,6. Part of the CO2 in the soil air is dissolved in the soil water, promoting the acidification of the water.The vegetation above the cave consists mainly in a mixture of deciduous forest (mainly ash and beech trees) and scrub. δ13 C values indicates C3 vegetation, including bushes and trees in the temperate climate zone (RIECHELMANN et al. 2011).
Ehleringer&Cerling (2002) use the term C3 vegetation not just as a metabolism classification but also as an approach of description of plant environment according to its carbon metabolism pathways. The ancestral pathway for carbon fixation made by C3 plants may be related to the [CO2]/[O2] ratio establishing a strong link between current atmospheric conditions and photosynthetic activity.
The C3 photosynthesis is described by Ehleringer&Cerling (2002) as a multi-step process in which thecarbon from CO2 is fixed into stable organic products. This occurs by the combination ofRubisco (a 5C molecule)with CO2 to form two molecules of phosphoglycerate(3C molecule). However, Rubisco is an enzyme capableof catalyzing two distinct reactions depending on the substrate. When CO2 is the substrate, lead the formation of two molecules of phosphoglycerate (3C molecule), in contrast when O2 is the substrate, lead the formation of just one phosphoglycerate plus one phospoglycolate (2C molecule).
This reaction results in less carbon fixation and lead the production of CO2 in a process known as photorespiration. For the authors, the consequence of rubiscosensitivity to O2 is that the efficiencyof the C3 photosynthesis decreases as atmospheric CO2decreases, it is to say,under elevatedCO2 environments or at cool temperatures, C3 vegetation shows a great efficiencyof photosynthesis.
of Bunker Cave air pCO2 as a result of inside/outside differences in temperature. When the outside air temperature is lower than the cave temperature (during winter), the warmer and less dense cave air ascends and leaves the cave through the upper entrance. This leads to cold surface air been sucked into the cave through the lower entrance. The opposite phenomenon is observed when the surface temperature is higher than the cave temperature (during summer). This phenomenon generates ventilation in the cave, decreasing the pCO2 from cave air, principally in winter. It is important to note that the seasons in the northern hemisphere (Europe) are distinct from the southern hemisphere (Brazil). In Europe summer occurs from Jun to August and the winter December/January/February.
1.2.3 Geology and Geomorphology
The Rhenish Slate Mountains, at the western boundary of Germany, was palaeogeographically part of the Cornwall-Rhenish Basin, which was characterized by a back-arc extension and rapid subsidence during the Late Devonian and earliest Carboniferous and it is part of the Variscan mountain belt in Central Europe (FRANKE, 2000). The uppermost Devonian of the basin is characterized by the interruption of pelagic conodontbiofacies, which is replaced by a more nearshorebiofacies. These faunal changes, associated with deep lithological changes elsewhere in Europe, are thought to be the result of some kind of Devonian/Carboniferous event, characterized by the extinction of many fossil groups and with a subsequent rapid diversification of the others that survived the event (STEENWINKEL, 1992). A geological map of the area is shown in fig. 2.
The rock uplift of the region, locally accompanied by volcanic activity to the south occurred in a prolonged period during the early Tertiary, according to Meyer; Hetzel; Strauss, (2010) due to isostatic response of the lithosphere heating by a mantle plume located beneath the Eifel Region.
plateaus (SAUER& FELIZ – HENNINGSEN, 2006). Modern soils are developed above Pleistocene periglacial slope deposits.
Figure 2 - Geological map of the Rhenish Slate Mountains. The black line between mainly slate
Devonian rocks and the greywacke, shale carboniferous rock represent the important Devonian/carboniferous event. A discontinuous belt of submarine “shoals” formed by Givetian-Frasnian reef masses is represented in blue. Source: Meyer et al., (2010).
During the Upper Carboniferous period, the sediments were folded by the Variscian orogeny, bordered to the north against the autochthonous foreland along the Variscan front (HEIN, 1993). Tectonic uplift, which occurredduring the mid-Tertiary, led to the development of theRhine graben, which crosses the Rhenish Massif fromsoutheast to northwest (SAUER& FELIZ – HENNINGSEN, 2006).Apart from slates and siltstones, there is also present some graywacke, quartzite and limestone. The rivers dissect intensely these unites, forming reliefs dominated by steep valleys. Away from the river’s edge planation surfaces characterize the landscape. More competent rocks, such as quartzite, follow the general direction of the Variscian orogeny, striking in southwest to northeast direction.
the Massif, also suggest the process of gelifluction. Frost creep and gelifluction are the cold-climate representatives of mass-wasting processes.
Sauer & Felix-henningsen (2006) present a reconstruction of the climate and landscape history of theRhenish Massif since the Mesozoic. Subtropical to tropical conditions indicated by the thick saprolite cover led to intensive deep weathering with the formation of kaolinitic soils and saprolites from slates and siltstones. Erosive denudation occurred simultaneously, developing planations surfaces. The warm and humid conditions continued until the end of the Miocene and came back in several phases during the Pliocene, but, besides these warm phases, the Pliocene was in general characterized by an overall temperature decrease marking the transition from interglacial to glacial period (Tertiary – Pleistocene).
The Rhenish Massif was not glaciated during the Pleistocene, however it was subject to periglacial conditions. In this Epoch, the rivers incised deeply into the basement rocks, dissecting the planation surfaces. Extensive erosion occurred by the congelifraction, gelifluction and melt water runoff processes. Above the remnants of the Mesozoic – Tertiary surface were formed the Pleistocene Periglacial slope deposite(SAUER& FELIZ – HENNINGSEN, 2006).Eolian deposition forming loess deposits, took place during cold and dry periods in the Middle and Upper Pleniglacial, but subsequently more humid conditions allowed gelifluction of the loess layers.With the end of the last ice age the landscape wasstabilized and no significant slope processes occurred untilhistorical time, when deforestation and agricultural landuse again led to favorable conditions for extensiveerosion.
1.2.4 Geology of the Cave
The cave is developed in Devonian limestone, represented in blue in the geological map (fig. 2). This carbonate unit occurs as lenses following the boundary between the Devonian and Carboniferous rocks.
The cave presents actively drip sites with growing speleothems, e.g. Bu4 stalagmite, studied in this coursework, sampled in an actively drip site. According to the monitoring data (RIECHELMANN et al. 2011), the drip-rate patterns of most drip sites are consistent with the main infiltration events, taking into account a delay of several months. An instantaneous response to precipitation is not observed for any drip site indicating a specific water capacity threshold in the soil/karst aquifer.
The karst aquifer recharge water seems to be well mixed from the uniform drip water δ18 O data. The water percolating through the soil and host rock is stored, and the drip sites document seepage flow from these reservoirs with an average residence time of up to few years (RIECHELMANN et al. 2011). The velocity of seepage flow (the slow movement of water through a porous surface) is determined by the permeability of the respective geological unity and the unsaturated soil.
2 OBJECTIVES
3 THEORETICAL BACKGROUND
3.2Aspects on Karst Science
Kranjc (2001) explains the international term “karst” as derived from a karst plateau in the background of Trieste bay, in the Adriatic sea, by the border between Slovene and Italian. This region is known as Kras in Slovenia and consists of Cretaceous and Tertiary carbonate rocks, with well-developed underground water flow systems. In this way, “Kras” is translated into Karst in German, Carso in Italian and Carste in Portuguese language. The author also refers the meaning of the prefix kras as stone, and relates it to the first known ethnic groups living on the nowadays Slovenian territory, named Carni. This Kras region was the first intensively studied karst terrain, and thereafter similar places were referred also as karst when presented same characteristics, as a reference to the Slovenian landscape, an international term used until today.
3.2.1 Karst system and Karst Hydrogeology
Ford & Williams (1996) define karst as a distinctive hydrology terrain where landforms arising from a combination of high rock solubility and well developed secondary porosity. Another typical feature is the development of unusual subsurface hydrology. A variety of forms, either in surface and subsurface, characterize karst regions, such as dolines, karren, poljes and caves (WAELE et al, 2009). Those distinctive landforms aretypical of karst landscapes and are formed by solution along pathways provided by the structure, reinforcing the idea that just solubility of the rock alone is insufficient to produce karst, therefore bedding planes, joints and faults have also an important paper in controlling pathways of underground flow (FORD& WILLIAMS, 1996).
Karst environment or karst-like landscapes can be formed in different lithologies, such as quartzites, sandstone, granites (MONTEIRO& RIBEIRO, 2001; HARDT et al 2010; AUBRECHT et al, 2011; WRAY, 1999; GONÇALVES et al., 2011; RODRIGUEZ, 2003) however carbonate rocks are the most common lithotype to karst development. These rocks are more abundant in the northern hemisphere in comparison to Gondwana continents that present some carbonate of cretaceous or later age related to post-breakup of the super-continent (FORD& WILLIAMS, 1996).
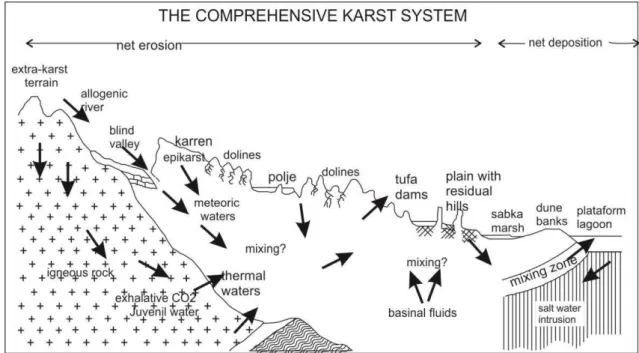
To understand carbonate karstified aquifer it is required to analyze the in-out put with a systematic understanding so that the intermediated process may be understood. A synthesized view is given in fig. 3.
Figure 3 - The comprehensive karst system: a composite diagram illustrating the major
phenomena encountered in active karst terrains. Source: Ford & Williams, (1996).
Caves are one of the most significant subsurface karst features, principally because of the possibility of being explored and directly studied by us. They are empty spaces under the surface with an entrance connecting the underground with the surface where man can enter. Davis (1931) reinforces two contrasted processes that happen inside caves, excavation and replenishment. The solution work of percolating water associated with the corrosion potential promotes excavation processes, creating caves and generating the enlargement of the cavities. Following these conduits, the water concentrates and flows similarly to a surface drainage system. The saturated waters when exposed to e.g. lower carbon dioxide pressures may provoke calcite precipitation thus reestablishing chemistry equilibrium (replenishment process).
Karstification is the dissolution of the carbonate rock due to percolation of acidic water, following the reaction:
-The addition of CO2 from atmosphere and soil into meteoric water is responsible for the acidity of percolating waters, due to formation of the weak carbonic acid. The concentration of dissolved CO2 is driven by both the temperature and CO2 partial pressure of the atmosphere related to ground-water.
According to Waele et al. (2009), the dissolution, although much more powerful at the surface, continues underground slowly enlarging fissures and initial openings, forming the karst conduit system. Speleogenesis is the term for the whole evolution of karst systems, from the origin to their full development up to the present form. White (2002) assumes dissolution as a very rapid process on a geologic time scale, modifying constantly the flow paths. As a result, karst aquifers must be regarded as works in progress, due to its rapidly changing.
Generally climate is considered as a driving karst processes (BAKALOWICZ, 2005) because of its influence on triggering chemical reactions of dissolution and weathering, i.e. amount of precipitation, pCO2 and hydraulic gradient (difference in elevation between the top of the karst recharge area and the spring base level).
In a geologic concept, Davis (1931) describes a continuous evolution of the landscape where excavation and replenishment process inside the cave happens simultaneously with tectonic uplift, lowering of the groundwater level, and surface erosion. In this case, surface karst features as dolines can reach cave roofs, opening this underground environment, and erosion might transform them to open or blind valleys with the removal of the walls. In geological time scale this may become eventually a new featureless peneplain surface and caverns will have vanish by erosion.
In a hydrological point of view, the water pathway trough discontinuities from recharge area to spring creates a very high heterogeneity in the karst aquifer (BAKALOWICZ, 2005) with different length, size, direction conduits. This heterogeneity progressively becomes organized and hierarchizes in the same way as fluvial systems. The similarity with surface flows and not inter-porous flow is characteristic from karst aquifers. Karst hydrology requires a mix of surface water concepts and ground water concepts to be understood (WHITE, 2002).
permeability, as compared to the bulk rock below. Its principal functions are to store and temporally distribute autogenic infiltration recharge to vadose zone. For Bakalowicz (2005) it may be compared to the skin of the karst, and exchange zone between the bio-atmosphere and the karst itself, storing groundwater where CO2 is produced and transported in solution and also where an air-soil-rock-water mixing occurs. Because of temporally storage in the epikarst (also called subcutaneous zone) diffuse infiltration water may require days to weeks to reach the water table. In contrast, where soils are thin and the bedrock is highly fractured, diffuse infiltration reaches the subsurface rapidly, giving sharp and peaked hydrographs that lag only slightly behind the precipitation (WHITE, 2002).
3.2.2 Speleothems
The word Speleothem comes from the Greek meaning Spelaion = cave and Thema =
deposit. They represent the chemical sedimentation inside a cave, and are mainly composed by calcite or aragonite. Commonly present in mature cave systems, the dripstones are formed by the ions in solution transported by the drip water that comes from the epikarst/soil and drip from the cave roof causing mineral precipitation. During the first stages of active cave opening and enlargement, when fractures are occupied by streams and the cave found itself under the vadose zone, speleothem formation is inhibited.
Stalactites (from the Greek: Stalaktós = dripping) are the formations hanging from the
cave roof. The solution in contact with the cave atmosphere (that present lower pCO2 than the water) degasses liberating CO2 to the cave air, causing the precipitation of calcite (CaCO3) that is not soluble in water. The rest of the drip follow the gravitationalpathdownward to the cave floor to form the stalagmite (from the Greek:
Stalagmós = dropping). The impact of the drip with the floor also provokes the
degassing of the solution and consequently precipitation of calcite.
3.3Aspects on Isotopic Analyses
Isotopes are atoms with the same number of protons and electrons, differing only in the numbers of neutrons. The difference in neutron quantity results in different atomic mass and maintenance of the same atomic number. The so called stable isotopes are those that do not decay, that is to say, they are not radioactive. Sulzman (2007) consider that when the number of neutrons and the number of protons are quite similar, the isotope tends to be stable. In contrast, isotopes that derivate from decay are named as radiogenic isotopes.
Generally the isotopic differences between materials are exceedingly small (SULZMAN, 2007), thus an internationally accepted expression comparing to standards is used as represented by the equation below, where xx is the atomic mass of the isotope, E is the element and R is the ratio. As the difference is so small, it is multiplied by one thousand, attributing δ values in parts per thousand (ppt - ‰) (DAWSON and SIEGWOLF, 2007).
δxxE = (R
sample/Rstandard – 1) x 1000
Dawson and Siegwolf (2007) point out diverse applications of stable isotope analyses for ecological research, recording and tracing various changes to the earth´s diverse terrestrial, aquatic, marine and atmospheric systems. In sedimentary geology, Banner (2003) indicate applications for tracing the sources and transport of dissolved and detrital constituents; reconstruction of temporal changes in ocean water chemistry; and dating the time of formation of rocks and minerals. The use of radiogenic and non-radiogenic isotopes studies done in various disciplines (chemistry, geochemistry, geology, ecology, biology) affirms this methodology as being relevant for environmental science researches.
3.3.1 Isotopic data on paleoclimate and environmental science
Miocene epoch increased δ 18O registered in benthonic foraminifera, coinciding with sea water isotopic composition.
The “Burke curve” presented on Burke et al (1982),is the secular Sr isotope curve for oceanic water covering the Phanerozoic eon, constructed from analyses of marine carbonates, evaporates and phosphate samples. It reveals systematic temporal variation of seawater strontium composition though geological time (fig. 4). Sources of rocks with low or high strontium ratios influence directly the ratio of carbonates during diagenesis, developing different ratios than the marine original one. This publication intrigued the Earth science community with its potential applications to stratigraphic correlation, diagenesis and fluid flow, paleotectonics, and paleoenvironmental change (BANNER, 2003)
Figure 4- The curve of 87Sr/86Sr versus geologic time. The configuration of the curve is strongly
influenced by the history of plate interactions and seafloor spreading throughout the Phanerozoic. Source: Burke et al., (1982).
summarizes that radiogenic isotope variations in oceans offers unique insight into crustal evolution, weathering, climate change and a range of other Earth surface processes.
3.3.2 The Strontium Isotopes
Strontium is an alkaline earth element (symbol = Sr), with atomic number 38, widely distributed on Earth (abundant in seawater, low concentrations for mantle derivate rocks - basic rocks - and highly concentrated in reworked rocks).The element has a ionic radio of about 1.18 Å, therefore can easily substitute for calcium in mineral lattices. In aqueous solution it occurs commonly in the valence Sr(II).This element has four different isotopes, their masses and relative abundance is shown on table X.The 86Sr isotope is a non-radiogenic isotope, whereas the 87Sr isotope is produced by the radioactive β – decay of 87Rb (half-life approx. 48.8 x 10⁹ year and decay constant λ = 1.42 x 10⁻¹¹ year-1).A β decay is represented by a nuclear reaction where a neutron becomes a proton with the emission of an anti-neutrino and an electron.
Table 1 - The four strontium isotopes, their masses and relative abundance in nature.
Sr Isotopes
Masses 84 86 87 88
Abundance (%) 0.56 9.87 7.04 82.53
Different from oxygen or hydrogen, Sr isotope ratios are not expressed in standard delta notation, but instead as the ratio of 87Sr to 86Sr in a sample. Dawson and Siegwolf (2007) attempt to the importance of understand that the 87Sr/86Sr ratio depends on the Rubidium content in the source, and how long ago in time it fractionated from the 87Rb parent isotope to the 87Sr daughter isotope. As example of this “Rb - source” on the strontium ratio, the authors show that rocks derived from the Earth´s mantle have low 87Rb/86Sr while recent oceanic islands like Hawaii present slightly higher values. With
melting of the mantle, Rb isotopes are released into the melt phase with other incompatible elements, so that continental rocks derived from mantle melts present higher 87Rb/86Sr ratio, and if reprocessed (weathering releases Sr from certain minerals), it present usually much higher ratios values.
upper mantle present low present-day 87Sr/86Sr values (~0.703). Partial melting and crystal fractionation processes caused higher Rb/Sr, generating heterogeneity on the crust geochemistry reflecting the wide range of magmatic, sedimentary and metamorphic processes. The combined inputs of 87Sr/86Sr from crustal material and mantle rocks gave intermediate values for Phanerozoic seawater, reflecting the mixing of the sources in agreement with the high mixing time of ocean waters.
Variations in the Sr isotopic composition are therefore caused entirely by the mixing of Sr derived sources. For this reason, the 87Sr/86Sr ratio can be used to identify and quantify the contribution of different Sr sources in a system. In the modern geochemical cycle for Sr, oceanic water is enriched in radiogenic Sr by the weathering of crustal rocks, principally differentiated rocks that are transported to the oceans by superficial rivers or underground water. Low radiogenic ratios sources are the mantle-derived rocks, poorly differentiated, provided from hydrothermal circulations or seafloor rocks. Therefore, variance in the Sr isotopic composition of sea water (fig. 4) can be understood in response to geological events. Periods of seafloor spreading releases lower Sr ratios and orogeny events provide sources of higher Sr values.
In relation to the Sr source in a karst system, Banner (2003) consider the major control as weathering and transport of Ca since Sr follows Ca in its low-temperature aqueous geochemistry and substitute Cain mineral structures, in this case the stalagmite. Carbonate dissolves directly into solution liberating Sr ions. Weathering reactions produce residual clay minerals that will also introduce new Sr into solution.
Because of the slight mass ratio between Sr isotopes and due to the fact of not occurring in molecule form, biological and chemical processes in nature causes neglected isotopic fractionation (change in the isotopic composition due to chemical/physical process).Halicz et al (2008) also showed that among diverse marine and terrestrial carbonate material, no substantial fractionation in stable strontium isotope composition is observed.
Figure 5- Graphic representation of the fractioning correction normalizing the measured ration
to a fixed absolute 88/86Sr value. Source: Nier, (2011).
4 METHODOLOGY
For strontium analysis, initially chemistry separation and concentration of the element is performed by chromatography and then the measurement of isotopes by Mass-Spectrometry device. All samples were homogenized, purified and concentrated before measurement, with special methods described below.
Milli-Q water is used during the chemistry process, and it needs to be completely free of Strontium in a way that no contamination in the original samples is generated. Hence blanks were processed to evaluate potential Sr added by the chemistry process.
All samples were processed at the Institute of Environmental Physics, Heidelberg University. The source of samples and description of the equipment are presented below.
4.2Source of the Samples
The samplings were made by collaborating team of the Institute for Geology, Mineralogy and Geophysics Ruhr-University Bochum, Germany. The stalagmite is from Bunker cave as well the drip water samples (fig. 6).
The soil samples were obtained from a soil profile in the surface just above Bunker cave (51º 22’ 03,1” N; 7º 39’ 52,9” E) as well as the soil water samples. Sampling was done in two different horizons, the upper – organic A horizon (0,13m) and C horizon (0,75m) with a suction probe UGT (fig. 6).
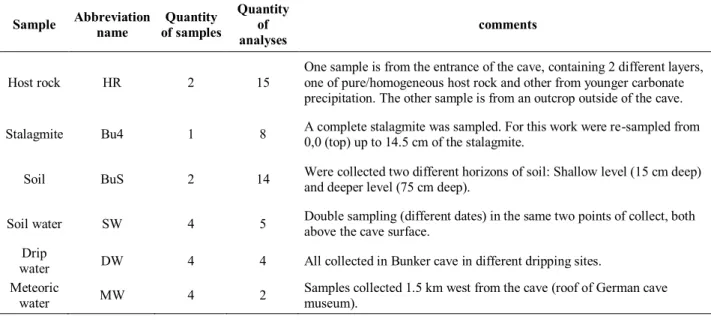
Table 2: Summary of the samples used in this study, all related to Bunker Cave System.
Sample Abbreviation name of samples Quantity Quantity of
analyses comments
Host rock HR 2 15 One sample is from the entrance of the cave, containing 2 different layers, one of pure/homogeneous host rock and other from younger carbonate precipitation. The other sample is from an outcrop outside of the cave.
Stalagmite Bu4 1 8 A complete stalagmite was sampled. For this work were re-sampled from 0,0 (top) up to 14.5 cm of the stalagmite.
Soil BuS 2 14 Were collected two different horizons of soil: Shallow level (15 cm deep) and deeper level (75 cm deep).
Soil water SW 4 5 Double sampling (different dates) in the same two points of collect, both above the cave surface. Drip
water DW 4 4 All collected in Bunker cave in different dripping sites.
Meteoric
water MW 4 2 Samples collected 1.5 km west from the cave (roof of German cave museum).
4.3Equipment
All solid samples (Bu4, HR and BuS) were powdered and weighted. The powdering of the rock samples (HR and Bu4) was done using a portable dentist drill. All the solid samples (HR, Bu4 and BuS) were weighted using a Mettler Toledo AT261 Delta Range® ISO 9001 balance. The weight measurements were performed in milligram with two decimal places (i.e. 0,01mg).
The liquid samples (MW, DW and SW) were heated forevaporation and concentration using a pack of 3 radiation lamps OSRAM SICCATHERM® E27, with power of 250 Watts. These lamps are used with the aid of suitable holders positioned just above the samples boxes that are connected with a Gerhardt pump. This pump removes the condensed vapor inside the boxes during the evaporation process by suction.
A Thermal Ionization Mass Spectrometer (TIMS) Finnigan Mat MS Model 262 was used for the isotopic measurement, and the standard report was made by the MS Control Program SpectromatRunlt 26 X.
4.4Reagents
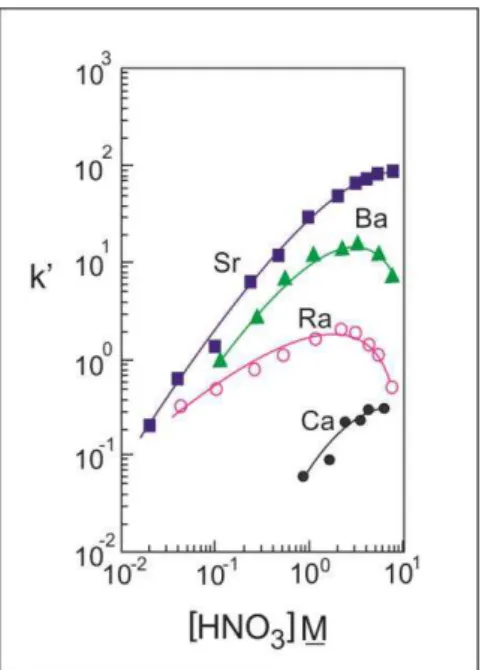
elements do not show affinity for the resin (fig. 7). Calcium which is a chemical analogue of strontium shows no affinity to the resin either.
Different concentrations of nitric acid (HNO3) are used. Purified water (18 Ω cm) used through all chemistry is obtained in a Millipore machine, Q-Gard®. Hydrogen peroxide is also used as an anti-organic contamination that could be present in the sample. Due to the high content of particles and compounds in soil, a stronger chemistry procedure take place, with the use of Na-Acetate buffer solution for the dissolution of carbonate content in the sample.
Figure 7- Acid dependency of k´ for various ions at 23-25ºC. It is possible to notice that,
especially at high nitric acids concentrations, the affinity of the resin for Sr element rise. Modified from Triskem International.
4.5Procedure
4.5.1 Rock Samples preparation
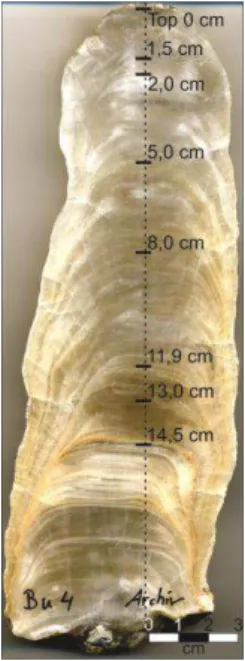
Mg and Sr concentrations from previously data (RIECHELMANN et al., 2011) were analyzedto decide where to make the sampling on the stalagmite. Fourteen samples of 2 mg each were made in different high (fig. 8) and numbered according to the laboratory book number (annex 1).
same carbonate unity. The others eleven HR analyses were done by milling 15mg of rock resulting in a very fine gravel (2 to 4 mm). Different grain sizes were used to observe differences in dissolution behavior in relation to exposed surface area.
Figure 8- Bu4 stalagmite, with the depth of samples made. The sampling was performed in the principal growth axis (represented by the dashed line).
4.5.2 Soil Samples preparation
In contrast to stalagmites and host rock, the soil samples contain silicates, organic matter, roots, etc. Hence they require chemical treatment to obtain a pure leaching of Sr from the sample for MS measurement. First they are homogenized and organized in small amount.
The first step is to dissolve the carbonate content of the soil, adding to the samples Na-Acetate buffer solution. The reaction occurs with constant shaking and mixing of the buffer solution with the sample, releasing formed CO2. This process may be longer depending on the carbonate content of the sample. The samples are introduced in a centrifuge for 4 minutes with a velocity of 2400 rpm, separating the dissolved carbonate in the liquid phase, decanted and manually separated.
HNO3, in the second cycle in 9 mol L-1HCl and one drop of H2O2is also added to avoid oxidation. In the last dry cycle it is dissolved in 1mol L-1HCl.
The last step is the chromatographic column process for separation of REE (Rare Earth Elements) elements from the soil. The columns are cleaned with Milli-Q water and with 6mol L-1HCl, and then they are load with Dowex 50 WX 8 and with 1mol L-1HCl. The samples are poured on the column which is rinse with HCl and eluted the strontium with 2,5mol L-1HCl.
4.5.3 Water Samples preparation
The water samples are almost ready for the chemistry column process. Reduction by evaporation was done to concentrate the samples. The drip water naturally presents a pure quality, due to the natural filtering process in the karst system, but the meteoric water contain some foreign solid particles that may not enter in the process. Therefore these samples were filtered before the evaporation using a single use filter Sartorius stedimminisart non-pyrogenic with pores of 0,45 microns size.
4.6 Chemistry process
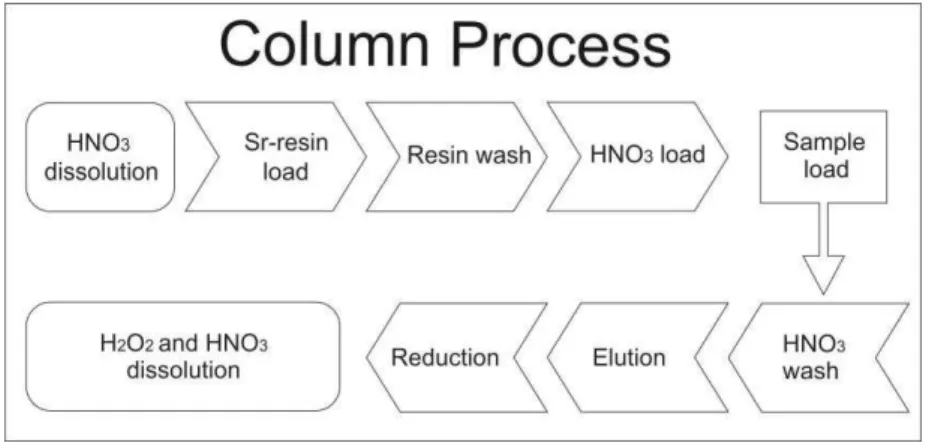
In fig. 9 is observed the flowchart representing the steps of the process. First all samples need to be dissolved in 0.5ml of 3 N HNO3acid. Each sample has one owner column. These column are filled with 0.3 ml of Sr-resin TRISKEM, responsible for retaining the Sr while the others elements are leached. The resin is washed with 6 ml of water, activating the resin. The next step is to activate the resin loading the column with 1ml of HNO3 3N and then the sample is loaded.
Figure 9- Flowchart representing the chromatographic column process for separating Sr
4.7Mass spectrometry analyses
The mass spectrometer (MS) is the responsible of separating the different isotopes of interest due to their masses. It is composed basically from an ion source, a magnetic field and detectors. The samples are introduced in the MS by metal filaments (rhenium-filaments) into the ion source. Each sample is added to one filament, and they are arranged always in pairs of sample filament and evaporation filament. (KRABBENHÖFT, 2011).
During the introduction of the sample in the MS, it is necessary to maintain the vacuum inside the equipment. Hence valves between the ion source and the magnetic analyzer are closed due to the maintaining of the vacuum inside the MS. The pressure in the ion source is also controlled, using liquid nitrogen and pumping system after the introduction of the samples. The pressure in the ion source should run around 3,5 10-9 mbar.
In the ion source the filament (and the sample) are heated by a bombarding of electrons producing positive ions that are accelerated by high voltage into a magnetic field located perpendicular to the ions beam. Passing through this magnetic field the different masses are separated following different paths according to their masses until reach the cups in the detector that were previously positioned according to the paths of the desired isotopes (IAEA, 2001).
ion beam (each mass, in the case, 88Sr, 87Sr and 86Sr). Then, the isotopic ratio is obtained dividing all the isotopes for the stable one (86Sr).
Calibration of the MS is done according to the isotopes to be measured. The calibration his made to rightly positioning of the cups and mathematical corrections of fractionating. According Banner (2003), fractionation can occur in nature or during the analyses, but for strontium isotopes it is clear that the instrumental fractioning is far bigger than natural fractioning, thus the importance of instrumental fractioning correction.
First correction is due the difference behavior of light and heavier isotopes. The light ones are easily evaporated, converting to gas phase in the start of heating in the MS source. This process generates an increase of the molar mass of the residual material in the sample-filament. The second correction is related to the presence of rubidium in the sample. It is corrected by measuring the mass 85, related to rubidium, so the correction of the mass 87 (that correspond even to Sr and Rb) can be done.
5 RESULTS
The results obtained are isotopic ratios (87Sr/86Sr) from solid and liquid phases of the karstic profile at Bunker cave (table 3). Sr isotopic ratio are measured in different subtracts in the water pathway downwards to the cave ceiling, until the stalagmite formation. The contact of karst water with each of the solid phase elements contribute for a specific geochemical signal in the percolating water, since different ratios were obtained in each material (Appendix A).
Table 3 - Flowchart differing the solid and fluid phases and the sequential stacking materials analyzed, as well as the mean value of its 87Sr/86Sr ratios. Notice the lower ratio value for the
HR.
Mean (sol. Ph.) Solid Phase Flowpath Fluid Phase Mean (fl. Ph.)
Rain 0.7097
0.7101 Soil A Upper Soil Water 0.7101 0.7089 Soil C Bottom Soil Water 0.7096 0.7085 Host Rock
Drip Water 0.7094
0.7095 Stalagmite
Geological material (HR and Bu4) were the mostanalyzed kind of samples, followed by soil leachates. Host rock samples are more abundant and can be sampled not just inside the cave (where implies environmental problems) but also in outcrops on the surface. Soil water could not be sampled during very dry seasons in summer and due to frozen conditions in winter (RIECHELMANN, 2011).
Comparing all the analyzed samples (fig. 10), the HR by far presents the lowest 87Sr/86Sr ratio. In agreement, the leachate from C - horizon presents also lower values,
Figure 10- In the horizontal axis is the 87Sr/86Sr ratio and in the vertical axis the error values. In
the Graphic it is possible to observe the distribution of ratio values from different source samples.
A synthesis of the strontium isotope values for Bunker Cave is shown in fig. 11. Minimum and maximum values, as well mean values are plotted. Soil leachates present the highest values and the host rock the lowest values. The stalagmite isotopic composition is in agreement with the drip water isotopic composition. The biggest arrows, as well as the higher ratios are from soil water, differing considerably from others samples ratio behavior. DW isotopic signal seems to be formed by a mixture of sources, altering the rain signature with soil and rock signals.
0,00E+00 2,00E-05 4,00E-05 6,00E-05 8,00E-05 1,00E-04 1,20E-04
0,707 0,708 0,709 0,71 0,711
leachate horizon A leachate horizon C drip water rain water
soil water horizon A soil water horizon C stalagmite
host rock
87Sr/86Sr
Figure 11- Synthesis diagram with the minimum, maximum and mean values of 87Sr/86Sr ratio.
5.1 Rain Water
RW samples were filtered due to particles before the concentration process. As concerns to the ratio values, the results are different and unconnected, representing no trend or average between them. In the TIMS, practically no 85 mass was detected, indicating the low Rb content of the RW. The measured values were 0,7092323 ± 5,02E-05 and 0,709678 ± 4,11E-05. The Sr/Ca weight ratio for these samples are 0,00276, higherwhencomparedto other samples due to the low content of Ca in meteoric water (mean value of 0.9mg/l Ca2+ (RIECHELMANN, 2011).
5.2Soil water and soil leachates
It is clearly distinguishable the signal from A – horizon and C – horizon SW. Upper soil water presents high ratio values, which decreases drastically within the percolation downwards, suggesting aninfluence of the lower HR ratio. The uniform δ18O values from DW (RIECHELMANN, 2011), indicates a well-mixed karst aquifer. This may influence the abrupt change in the 87Sr/86Sr ratio from upper to bottom soil water and not a gradational decreasing trend.The values range between 0,7095878 ± 1,95E-05 and 0,7100996 ± 4,20E-05 respectively in base and upper soil horizons (fig. 12).
0,7070 0,7120 0,7170 0,7220 0,7270
Figure 12 - Soil water samples: Notice the clear different values from the C - horizon soil (lower
values) and the upper A - horizon soil samples (higher values).
According to the SW samples, the A-horizon soil leachate presents also higher values as C – Horizon, however the difference is slightly pronounced. All leachates, from different methods (Milli-Q water leach, Na-Acetate leach and HNO3 leach), presented little differences observed on fig. 13 a. The total digestion of the soil samples resulted in higher values either to upper soil and base soil. The enrichment of A – horizon soil sample with total digestion process is notable (fig. 13 b).
0,7095 0,7096 0,7097 0,7098 0,7099 0,71 0,7101 0,7102
0,00E+00 5,00E-05 1,00E-04 1,50E-04
Horizon A SW
Horizon C SW
Standard deviation 0,7086 0,7088 0,709 0,7092 0,7094 0,7096 0,7098 0,71 0,7102 0,7104
0 0,2 0,4 0,6 0,8
soil horizon A
soil horizon C
87Sr
/
86Sr
Figure 13- Y axis represent the 87Sr/86Sr and X axis the soil depth sampling, 0,13 cm for upper
soil and 0,75 cm for base soil. In a) it is shown the higher values of total digestion processes in relation to the simple leachates measurement. In b) it is possible to see the different ratios according to the leachate method used. The difference between lower base soil leachate ratios and higher upper soil leachate ratios is noticeable in both graphics.
5.3Host Rock
The Massif is geologically heterogeneous and thatreflects on the geochemistry of the rocks, hence the HR analyzed samples showed also different ratio values. These samples presented the lowest 87Sr/86Sr ratios values. No representative difference between outcrop sample ratio and cave entrance ratio was found, even on the re-precipitated calcite layer (fig. 14). 85 mass signals were identified in the TIMS measurement, indicating the presence of some Rb in the HR bulk composition. The strontium ratio values varies between 0,707960 ± 5,00E-5 to 0,70845 ± 1,4E-05.
0,707 0,712 0,717 0,722 0,727
0 0,2 0,4 0,6 0,8
Base soil
Base soil TD
Upper soil
Upper soil TD
87Sr
/
86Sr
Figure 14- HR 87Sr/86Sr ratios.
5.4Stalagmite and Drip Water
In Bu4 stalagmite eight samples well distributed in the stalagmite axis were analyzed. Dating speleothems as Bu4, it is important to recognize that a drilled sample might contain powders from different time periods (FLEITMANN et al 2008). The sampling of Bu4 was made from ~2 mm diameter cores, perpendicular to the axis in the dated layer. Thus mixing of different ages in relation to age resolution should not be a bigger problem.
In the deeper part of Bu4 (three older samples, fig. 15), the ratio increases significantly, suggesting either that the isotopic composition of the DW changed since then or an enrichment of radiogenic strontium took place in the base of the speleothem during growth time. The lowest 87Sr/86Sr ratio of Bu4 (0,709372) is still above from the higher HR ratio (0,70845), in the same way as the 87Sr/86Sr data presented by Verheyden et al (2000), suggesting an external source of Sr with a higher isotopic composition than the HR.
As expected, the DW 87Sr/86Sr ratios agree well with the stalagmite ratios, with exception of the deeper stalagmite samples due probably to changes in the geochemistry of the percolating water. In respect to A and C horizons leachates, the composition of DW is intermediate, indicating a mixed source (fig.16). This result is in agreement with Wong et al (2011), with lower HR ratios, higher soil leachate values and intermediate DW ratios of the Natural Bridge Caverns in central Texas despite the higher radiogenic
0,7079 0,708 0,7081 0,7082 0,7083 0,7084 0,7085
0 1 2 3 4
host rock
cave entrance MK
content for all samples in Bunker cave. The 87Sr/86Sr ratio from DW varies between the range of 0,709418 ± 6,16E-06 to 0,709446 ± 1,24E-05.
Figure 15-87Sr/86Sr ratio for Bu4 stalagmite. In the X aixis is represented the depth of the sample
on the stalagmite, starting in the top following to the base. The increasing trend to the base is clear.
Figure 16- Comparison between 87Sr/86Sr ratio from stalagmite, drip water, soil A and soil C.
The composition reflects a mixing between the A and C soils horizons ratios. 0,70925
0,7093 0,70935 0,7094 0,70945 0,7095 0,70955 0,7096 0,70965
0,0 1,5 2,0 5,0 8,0 11,9 13,0 14,5
Bu4
Stalagmite Depth
87
Sr
/
6 DISCUSSION
The rain water presented a mean value (87Sr/86Sr) of 0.7097, higher than the DW, suggesting that a direct correlation between drip water composition (i.e. stalagmite – the DW signal is reflected directly on the stalagmite)and rain water composition is not established. The interaction of the water through the soil and epikarst prior to the cave ceiling results in variance of the water isotopic composition, due to contribution of different strontium isotopic sources, being the MW ratio not preserved in the system.
The RW should not be also an important source of Sr in the system, due to its low concentrations of Sr. According to Banner (2003) rainwater might present a very low Sr concentration, since Sr is not a volatile element and should remain in the ocean during evaporation. In agreement, Riechelmann (2011) present a mean value of 3µg/l of Sr2+ in the RW from Bunker cave. Thus the RW does not represent a relevant input of Sr to the system. In contrast, the soil values found suggest the soil to be one of the most important Sr source for the system. Leaching experiments resulted in higher radiogenic ratios, indicating the importance of weathering in the soil to the drip water ratios.
Bunker cave is located approximately 270 km south and 300 km east from the North sea, a quite large distance enough to disregard the effects of sea spraySr isotopic composition. The Ca content of RW, as affirmed by Banner (2003) may yield insight into the controls of Sr in RW. In the monitoring data base of Bunker cave (Riechelmann 2011), the concentration of Ca2+ in RW is very low (0.9 mg/l) in agreement. Atmospheric Sr contribution is also negligible according to Drouet et al (2007).
The differences between the values of base soil and upper soil are glaring. It is also notable the increasing ratio within the leachates and total digestion processes, due to intensively induced dissolution of soil materials.The high isotopic composition and the considerable Sr content of the soil (107µg/l Sr2+ in soil water, from Riechelmann (2011) indicates the soil as an important Sr source in the system. The soil is characterized with a low content of clay, rich on silt, as a product from loess loam. This texture classification suggests a considerable porosity that may interfere in the percolation velocity of water and thus in the residence time of Sr in the soil.
The A-horizon is a thin layer, less than 10 cm, and presents the higher ratios (mean value of 0.7253). The contribution of A-horizon to the DW composition may bethe most important source of high isotopic composition, that will be slighted by lower signals downwards (soil C and HR) to form the DW final composition deeper in the karst system. It is noteworthy that the uppermost soil is rich in organic matter and siliceous material from dust and surface sediments and approximately 20 % (percentage of the total mass) has clay grain size.This may allow the higher values to A-horizon ratio.
The high radiogenic contribution of erosion and superficial transport of the carboniferous rocks (graywackes and shales) stratigraphically above is not expressive because the river does not anymore flows in the surface (has been captured by the karst) and a vertical flow component predominate actually.
Tooth & Fairchild (2003) reinforce that variations in karst drip waters need to have a holistic approach to the karst system to be understood, encompassing atmospheric, soil and aquifer ones. Hydrology exerts a dominant control on water chemistry in terms of both geometry and residence time, both of which determine the degree and characteristics of water-sediment and water-rock interaction.
It is known that in karst aquifers, the water flow has a similar behavior as surface water, and in the same logic, the composition of the water reflect a first-order control by the geology of the regions that they drain (BANNER, 2003). This may suggest that the influence of the HR, with low ratio, is preponderant.However, assuming the actual DW composition, hypothetical end-member contributions represented by the mixing lines (fig. 17) should be ~60% from Soil A ratio and the other ~40% from HR ratio. In this case the biggest contribution is from A horizon, nevertheless, if it is consideredthe C-horizon formation (fig. 17) this contribution changes to ~40% of Soil A contribution and ~60% of Soil C ratio.
Zhou et al (2009) discuss similar mixing lines trying to track Sr sources between two end members. In their case, ~70% of the Sr in the cave water was derived from the HR while the remaining ~30% from the overlying soil layer. The measurement for cave sediment leached by milli-Q water suggests more than 60% of which deriving from the HR. This result shows a larger participation of HR and HR-derived end-member than Bunker cave.
The Bu4 base ratio (~0,7095) has bigger influence of upper soil ratio and Bu4 top ratio (~0,7093) a bigger influence of host rock ratio. The lower 87Sr/86Sr ratios in the top of Bu4 can be explaned either from (i) more contribution from HR signature or (ii) less contribution from soil A signature or (iii) both simultaneously could result in decrease of the ratio.Verheyden et al (2000) suggest that the radiogenic Sr decrease can be induced by changes in the weathering processes or by differential weathering in the overlying soil. In other hand, an increased input of the low radiogenic Sr can be due to enhanced dissolution of the host rock limestone, but the dissolution of limestone will depend on water availability and acidification of the water. In tropical regions where abundant rainfall occurs and denser vegetation is present generating CO2, the dissolution is more effective (FORD& WILLIAMS, 1996).
If the Sr isotopic composition is a result of mixing between different Sr isotopic compositions, long-term changes in 87Sr/86Sr ratios may reflect changes in the relative importance of the two end-members (VERHEYDEN et al, 2000).Clearly it is possible to define 3 end-member sources. Soil A leachate with high ratios, Soil C leachate with slightly low ratios and Host Rock leachate with low values (fig. 16). The DW composition is closer to soil C composition with a mean values difference of only 0,0005, suggesting that the initial fluid with Soil A leachate contribution is altered by a mix of Soil C and HR ratios, promoting the decrease of the ratio of DW in relation to upper soil values.
intense as it is for a mature soil profile, inducing the decreasing trend simultaneously with soil profile development.
Perrin (1997, apudVERHEYDEN, 2004) observed an increase the ion concentration in cave waters with increasing cave depth, reflecting the increase in water-rock interaction along time. As longer is the residence time of water in the aquifer, more influence from the HR signal should be attributed to DW ratio. In dryer period, the residence time of water is greater in the epikarst, promoting more dolomite dissolution and increasing the Mg/Ca ratio of the solution. The Sr/Ca ratio covaries with Mg/Ca, providing a major contribution of the HR Sr composition (with lower isotopic ratio). The use of isotopic Sr together with Mg and Sr concentrations in relation to Ca may provide insight to the amount of rainfall.
The shift in the DW composition could also be related to a change in the flow path in the system (i.e. conduit/fracture vs. seepage flow/diffuse). In an initial situation the epikarstis not completely developed and larger fractures may feed Bu4 drip site. With faster flow, there is no much interaction time between HR and water flow necessary to the dissolution of the HR and consequently contribution of Sr ratio from this source. With increasing complexity of the soil profile, a longer flow path through B-Horizon and C-horizon, increased the contact of the percolating water with lower ratios sources, inducing a decreasing trend in the 87Sr/86Sr composition of DW in the last 0.85 Ka BP. The hydrological control is extensively discussed in Tooth and Fairchild (2003). They conclude that the soil matrix flow is the dominant karst water source during dry periods.
Extensive literature attribute trends of decreasing Ca2+ concentrations accompanied by increasing Mg/Ca and Sr/Ca ratios (WONG et al 2011, TOOTH& FAIRCHILD 2003, FOHLMEISER et al., 2012). This co-variation between Mg and Sr in relation to Ca is understand as an effect of PCP (prior calcite precipitation) at lower flow rates, that use to occur in dry periods, when the availability of water is little and ventilated air-filled aquifer porosity is higher.