CPD
10, 4149–4190, 2014A 500 year seasonally resolvedδ18O/δ13C
M. Van Rampelbergh et al.
Title Page
Abstract Introduction
Conclusions References
Tables Figures
◭ ◮
◭ ◮
Back Close
Full Screen / Esc
Printer-friendly Version
Interactive Discussion
Discussion
P
a
per
|
Discus
sion
P
a
per
|
Discussion
P
a
per
|
Discussion
P
a
per
|
Clim. Past Discuss., 10, 4149–4190, 2014 www.clim-past-discuss.net/10/4149/2014/ doi:10.5194/cpd-10-4149-2014
© Author(s) 2014. CC Attribution 3.0 License.
This discussion paper is/has been under review for the journal Climate of the Past (CP). Please refer to the corresponding final paper in CP if available.
A 500 year seasonally resolved
δ
18
O and
δ
13
C, layer thickness and calcite fabric
record from a speleothem deposited in
equilibrium of the Han-sur-Lesse cave,
Belgium
M. Van Rampelbergh1, S. Verheyden1,2, M. Allan3, Y. Quinif4, H. Cheng5,6, L. Edwards6, E. Keppens1, and P. Claeys1
1
Earth System Sciences, Vrije Universiteit Brussel (VUB), Pleinlaan, 1050, Brussels, Belgium 2
Royal Belgian Institute of Natural Sciences, Geological Survey, Direction Earth and History of Life, Jennerstraat 13, 1000, Brussels, Belgium
3
AGEs, Départment de Géologie, Université de Liège, Allée du 6 Août, B18 Sart-Tilman, 4000, Liège, Belgium
4
Faculté Polytechnique, Université de Mons, Rue de Houdain 9, 7000, Mons, Belgium 5
Institute of Global Environmental Change, Xi’an Jiaotong University, Xi’an 710049, China 6
CPD
10, 4149–4190, 2014A 500 year seasonally resolvedδ18O/δ13C
M. Van Rampelbergh et al.
Title Page
Abstract Introduction
Conclusions References
Tables Figures
◭ ◮
◭ ◮
Back Close
Full Screen / Esc
Printer-friendly Version
Interactive Discussion
Discussion
P
a
per
|
Discus
sion
P
a
per
|
Discussion
P
a
per
|
Discussion
P
a
per
|
Received: 29 August 2014 – Accepted: 21 September 2014 – Published: 22 October 2014
Correspondence to: M. Van Rampelbergh (mvrampel@vub.ac.be)
CPD
10, 4149–4190, 2014A 500 year seasonally resolvedδ18O/δ13C
M. Van Rampelbergh et al.
Title Page
Abstract Introduction
Conclusions References
Tables Figures
◭ ◮
◭ ◮
Back Close
Full Screen / Esc
Printer-friendly Version
Interactive Discussion
Discussion
P
a
per
|
Discus
sion
P
a
per
|
Discussion
P
a
per
|
Discussion
P
a
per
|
Abstract
Speleothemδ18O andδ13C signals have already proven to enable climate reconstruc-tions at high resolution. However, seasonally resolved speleothem records are still scarce and often difficult to interpret in terms of climate due to the multitude of fac-tors that can affect the proxy signals. In this paper, a fast growing (up to 2 mm yr−1)
5
seasonally laminated speleothem from the Han-sur-Lesse cave (Belgium) is analyzed for itsδ18O andδ13C values, layer thickness and changes in calcite fabric. The studied part of the speleothem covers the most recent 500 years as indicated by layer count-ing and confirmed by 20 U/Th-ages. Epikarst recharge occurs mainly in winter and lesser during spring and fall. a good correlation can be established between lower
win-10
ter temperatures and lower winter precipitation (DJF) based on the measured data by the Belgian meteorological institute since 1833 indicating that a dry winter is also a cold winter. Colder and dryer winters cause lower winter recharge and generally drier conditions in the cave. Lower winter recharge decreases the amount of isotopically light (δ18O) winter precipitation added to the epikarst in comparison to the heavier spring
15
and fall waters, which leads to a net increase inδ18O value of the water in the epikarst. Increasedδ18O values in the Proserpine are consequently interpreted to reflect colder and dryer winters. Higherδ13C signals are interpreted to reflect increased prior calcite precipitation (PCP) due to colder and dryer winters, when recharge is lower. Thinner layers and darker calcite relate to slower growth and occur when drip rates are low and
20
when the drip water calcium ion concentration is low due to increased PCP, both caused by lower recharge during periods with colder and dryer winters. Exceptionally cold and dry winters cause the drip discharge to decrease under a certain threshold value in-ducing anomalies in the measured proxy records. Such anomalies occur from 1565 to 1610, from 1770 to 1800, from 1810 to 1860 and from 1880 to 1895 and correspond
25
CPD
10, 4149–4190, 2014A 500 year seasonally resolvedδ18O/δ13C
M. Van Rampelbergh et al.
Title Page
Abstract Introduction
Conclusions References
Tables Figures
◭ ◮
◭ ◮
Back Close
Full Screen / Esc
Printer-friendly Version
Interactive Discussion
Discussion
P
a
per
|
Discus
sion
P
a
per
|
Discussion
P
a
per
|
Discussion
P
a
per
|
amplitude variations are observed such as between 1479 and 1565 and between 1730 and 1770 with two periods of relatively warmer and wetter winters. Between 1610 and 1730 a period of relatively cooler and dryer winters occurs and may relate to a de-crease in solar irradiance during the Maunder Minimum (1640–1714). Seasonalδ18O variations indicate a 2.5◦C seasonality in cave air temperature during the two periods
5
with warmer and wetter winters (1479–1565 and 1730–1770), and correspond to the cave air temperature seasonality observed today. a smaller 1.5◦C seasonality in cave air temperature occurs during the interval with colder and wetter winters between 1610 and 1730 and suggests colder summers. Theδ13C seasonal changes suggest that the seasonality in discharge was lower than the one observed today with a short interval of
10
increased seasonality between 1600 and 1660 reflecting stronger summer PCP-effects due to decreased winter recharge.
1 Introduction
Climate reconstructions such as the Northern Hemisphere temperature curve (Mann et al., 1999) or the NAO variation curve (Trouet et al., 2009) are based on a selection of
15
climate archives such as tree-rings, ice-cores, speleothems or lake sediments. To refine these curves and obtain more regionally relevant information, more detailed and better regionally spread climate proxy reconstructions at yearly or even seasonal resolution are necessary. In the studied western European region, high-resolution proxy climate records covering the last 500 years are scarce. Most climate information at seasonal
20
or yearly scale is retrieved from historical data such as the price of flour or grapes (Van Engelen et al., 2001; Le Roy Ladurie, 2004) which may induce biases in the climate record. Therefore it is necessary to confront information from different archives, based on different approaches.
Speleothems have already often proven to enable climate reconstruction at
high-25
CPD
10, 4149–4190, 2014A 500 year seasonally resolvedδ18O/δ13C
M. Van Rampelbergh et al.
Title Page
Abstract Introduction
Conclusions References
Tables Figures
◭ ◮
◭ ◮
Back Close
Full Screen / Esc
Printer-friendly Version
Interactive Discussion
Discussion
P
a
per
|
Discus
sion
P
a
per
|
Discussion
P
a
per
|
Discussion
P
a
per
|
scales, the δ18O and δ13C variations can often be related to a single climate proxy such as temperature or vegetation cover (Spotl and Mangini, 2002; Genty et al., 2003; McDermott, 2005). However, on decadal and seasonal scale, a larger range of factors can influence theδ18O,δ13C, layer thickness or calcite fabric of a speleothem making an interpretation in terms of climate more difficult. To allow reconstructing the climate
5
up to seasonal variation using mid-latitude speleothems, a detailed analysis of each used proxy must be compared with a multiproxy approach. Different European records have enabled to reconstruct climate successfully by using this approach (Frisia et al., 2003; Niggemann et al., 2003; Mangini et al., 2005; Mattey et al., 2008; Fohlmeister et al., 2012).
10
Belgian speleothems have the valuable advantage to often display a clear internal layered structure reflecting seasonal variations (Genty and Quinif, 1996). The link be-tween layer thickness and water excess in Belgian stalagmites for the Late Glacial and Holocene period has clearly been demonstrated by Genty and Quinif (1996). Theδ18O andδ13C signals from a speleothem sampled in the Père Noël cave were interpreted
15
as due to variations in cave humidity and drip rate inducing changes in the kinetics of the calcite deposition occurring closer or less close to isotopic equilibrium. More neg-ativeδ18O andδ13C values occur during periods of higher cave water recharge, when calcite deposition occurs closer to isotopic equilibrium (Verheyden et al., 2008). In this speleothem, the isotopic (δ18O andδ13C) and geochemical (Mg/Ca and Sr/Ca)
prox-20
ies vary similarly and record the climate in terms of wetter and dryer phases (Verheyden et al., 2014). The studied Proserpine stalagmite is a large tabular shaped speleothem, growing in the Han-sur-Lesse cave, which is part of the same cave system as the Père Noël cave. A former study of the stalagmite revealed deposition from 200 to 2001 AD, indicating an exceptionally high average growth rate of±1 mm yr−1. The upper 60 cm,
25
CPD
10, 4149–4190, 2014A 500 year seasonally resolvedδ18O/δ13C
M. Van Rampelbergh et al.
Title Page
Abstract Introduction
Conclusions References
Tables Figures
◭ ◮
◭ ◮
Back Close
Full Screen / Esc
Printer-friendly Version
Interactive Discussion
Discussion
P
a
per
|
Discus
sion
P
a
per
|
Discussion
P
a
per
|
Discussion
P
a
per
|
These proxies therefore have the potential to be used to reconstruct climate in terms of wetter and dryer phases.
In this paper we study this potential more in detail and up to a seasonally resolved timescale. An absolute age model is established by combining layer-counting ages with measured U/Th-ages. A comparison of variations in layer thickness, calcite fabric,
5
δ18O and δ13C signals in the light of former studies (Genty and Quinif, 1996; Ver-heyden, 2001; Genty et al., 2003; Mühlinghaus et al., 2007; Wackerbarth et al., 2010; Fohlmeister et al., 2012; Verheyden et al., 2014) and monitoring of the same stalag-mite location (Van Rampelbergh et al., 2014) leads to a better understanding of how these proxies are related among them as well as with the monitoring data, and how
10
they reflect climate variations. The derived climate interpretation is further verified and refined by comparing the Proserpine climate signal with temperature reconstructions in the Northern Hemisphere (Jones and Mann, 2004) and Europe (Van Engelen et al., 2001; Le Roy Ladurie, 2004; Luterbacher et al., 2004; Dobrovolny et al., 2010) a well as with a winter NAO reconstruction (Trouet et al., 2009).
15
2 Study area
The Proserpine stalagmite is sampled in the Salle-du-Dôme chamber in the Han-sur-Lesse cave, southern Belgium (Fig. 1). The Han-sur-Han-sur-Lesse cave is a meander cutting of the Lesse-river, which still flows through the cave. The large rooms, the multiple entrances and the presence of the river make it a well-ventilated cave. Part of the cave,
20
including the Dôme, is a show cave since the mid 19th century. The Salle-du-Dôme, being the largest chamber of the cave system (150 m wide and 60 m high), is located under ca. 40 m of Givetian limestone (Quinif, 1988) with a C3-type vegetation covered soil. The Proserpine stalagmite is a 2 m high stalagmite with a large tabular shape (with a horizontal 70 cm by 150 cm to surface) that was actively growing when
25
CPD
10, 4149–4190, 2014A 500 year seasonally resolvedδ18O/δ13C
M. Van Rampelbergh et al.
Title Page
Abstract Introduction
Conclusions References
Tables Figures
◭ ◮
◭ ◮
Back Close
Full Screen / Esc
Printer-friendly Version
Interactive Discussion
Discussion
P
a
per
|
Discus
sion
P
a
per
|
Discussion
P
a
per
|
Discussion
P
a
per
|
fast growing “tam-tam” shaped stalagmites have the property to record climate signals and environmental information at high resolution (Perette, 2000).
The mean annual precipitation at the nearest meteorological station of Han-sur-Lesse is 844 mm yr−1 and the mean annual air temperature averages 10.3◦C (Royal Meteorological Institute Belgium) characterizing a warm temperate, fully humid climate
5
with cool summers (Kottek et al., 2006). While the temperature displays a well-marked seasonality with cool summers and mild winters, the rainfall is spread all over the entire year. The external seasonality in temperature causes a subdued temperature variation within the Salle-du-Dôme of 2 to 2.5◦C between summer and winter (Van Rampel-bergh et al., 2014). During summer the stronger evapotranspiration causes the drip
10
discharge to diminish. Both isotopic signals (δ18O and δ13C) are interpreted to be deposited in equilibrium under the present-day conditions (Van Rampelbergh et al., 2014). The δ18O signal of freshly formed calcite collected on top of the Proserpine varies seasonally due the changes in cave air temperature. The δ13C signal varies seasonally due to changes in prior calcite precipitation intensity, driven by changes in
15
net precipitation (Van Rampelbergh et al., 2014).
3 Methods
The Proserpine stalagmite was sampled in January 2001, by drilling a 2 m core in the tabular shaped stalagmite. The precise location was on the side with the highest drip rate but far enough away from the edge to avoid disturbance of the expected
horizon-20
tal layering of the growth increments (Fig. 1b). The core was cut in half and a slab of 1 cm was cut from the center. The slabs were polished by hand with carbide powder and finished with Al2O3. The upper 56 cm, was further studied and cut in seven parts, numbered I to VII (Fig. 2), to allow easy handling in the laboratory. A petrographic de-scription was done and layers were counted per part, under the Mercantec Micromill
25
CPD
10, 4149–4190, 2014A 500 year seasonally resolvedδ18O/δ13C
M. Van Rampelbergh et al.
Title Page
Abstract Introduction
Conclusions References
Tables Figures
◭ ◮
◭ ◮
Back Close
Full Screen / Esc
Printer-friendly Version
Interactive Discussion
Discussion
P
a
per
|
Discus
sion
P
a
per
|
Discussion
P
a
per
|
Discussion
P
a
per
|
and with different zooms when counted on computer screen. The reported layer amount is given by the average of 10 layer counting rounds per part and the error is given by the SD for that part. The thickness of each layer was measured using the measurement tool of the Merchantec Micromill microscope with an uncertainty of 0.1 µm. Samples for
δ18O andδ13C measurements were taken with a drill bit of 0.3 mm diameter mounted
5
on a Merchantec Micromill. Ethanol was used to clean the speleothem surface and drill bit prior to sampling. Between samplings, drill bit and speleothem surface were cleaned with compressed air. Samples were drilled every 0.5 mm in part I and in every layer for the other parts, in total 867 samples. Stable isotope measurements were carried out using a Kiel-III-device coupled on a Thermo Delta plus XL with analytical uncertainties
10
of (1σ)≤0.06 ‰ for δ13C and ≤0.08 ‰ for δ18O. A total of 20 U-series age, among
which 8 from a former study (Verheyden et al., 2006) were measured at the University of Minnesota (USA), using the procedures for uranium and thorium as described in Ed-wards et al. (1987) and Cheng et al. (2000, 2009a, b). StalAge (Scholz and Hoffmann, 2011) was used to obtain the best age estimation per part based on the U/Th-ages.
15
The StalAge age model was run with the 20 U/Th-ages and the age of the top (year of coring) 2001 AD. The seasonal character of the layering (Verheyden et al., 2006; Van Rampelbergh et al., 2014) in the Proserpine allows using layer counting to establish an age model. The amount of counted layer couplets per part represents the amount of years for that part. The amount of years obtained by layer counting is then compared
20
CPD
10, 4149–4190, 2014A 500 year seasonally resolvedδ18O/δ13C
M. Van Rampelbergh et al.
Title Page
Abstract Introduction
Conclusions References
Tables Figures
◭ ◮
◭ ◮
Back Close
Full Screen / Esc
Printer-friendly Version
Interactive Discussion
Discussion
P
a
per
|
Discus
sion
P
a
per
|
Discussion
P
a
per
|
Discussion
P
a
per
|
4 Results
4.1 Calcite fabric and layer thickness
The Proserpine stalagmite displays a clear sedimentological perturbation at ∼9 cm
(Fig. 2). The calcite deposition is heavily disturbed with straw pieces embedded in the calcite (Verheyden et al., 2006). The straw pieces are interpreted to be relics from
5
fires lit on the paleo-surface of the stalagmite to illuminate the Salle-du-Dôme chamber (Verheyden et al., 2006). Below this perturbation, from 10 to 12.5 cm, calcite is heavily altered and more matte and whiter compared to the generally more translucent calcite fabric in other parts of the stalagmite. The heat of the fires made on the surface of the stalagmite during the perturbation period may have altered the calcite in this part.
10
From 18 to 20 cm, layering is heavily undulating with vertically orientated layers in some parts. This part is supposed to represent a small basin or rimstone structure on the paleo-surface of the speleothem. Part I, above the perturbation, has a generally darker and more compact calcite structure compared to the parts below the perturbation (parts II to VII). This greyish calcite in part I is interpreted to be related to the incorporation of
15
soot from torches used by visitors and for touristic attractions (Verheyden et al., 2006). Layering is present in the studied upper 56 cm of the Proserpine core and is formed by alternating dark more compact and white more porous layers (Fig. 2a) (Verhey-den et al., 2006). The seasonal character of the layering in the Proserpine stalagmite, with one dark and one white layer deposited every year is suggested by Verheyden
20
et al. (2006). Monitoring results at the Proserpine growth site confirmed the yearly layer couplets and showed that dark layers are formed in summer while white layers are formed in winter (Van Rampelbergh et al., 2014). Furthermore, Van Rampelbergh et al. (2014) counted 10 additional layer couplets in a core drilled in 2011, 10 years after the Proserpine core used by Verheyden et al. (2006), drilled in 2001, which confirms
25
CPD
10, 4149–4190, 2014A 500 year seasonally resolvedδ18O/δ13C
M. Van Rampelbergh et al.
Title Page
Abstract Introduction
Conclusions References
Tables Figures
◭ ◮
◭ ◮
Back Close
Full Screen / Esc
Printer-friendly Version
Interactive Discussion
Discussion
P
a
per
|
Discus
sion
P
a
per
|
Discussion
P
a
per
|
Discussion
P
a
per
|
0.3 mm layer−1. In the parts II to IV layer thickness increases to 0.5 mm layer−1 with very clear easily countable layering in part IV. In the parts V to VII layer thickness av-erages 1 mm layer−1 with well distinguishable layers in part VII. Superimposed short intervals of darker, more compact and thinner layers of 0.2 mm layer−1 occur between 7 and 8 cm and between 34 and 36 cm.
5
4.2 U/Th and layer counting ages
Eight U/Th-ages that were previously published by some of us (Verheyden et al., 2006) are used and numbered 1, 2, 7, 8, 15, 17, 18 and 19, and marked in light grey in Table 1. Twelve new U/Th ages measured in this study are listed in black in Table 1 and correspond well with the previously measured ages. Due to the large amounts of
10
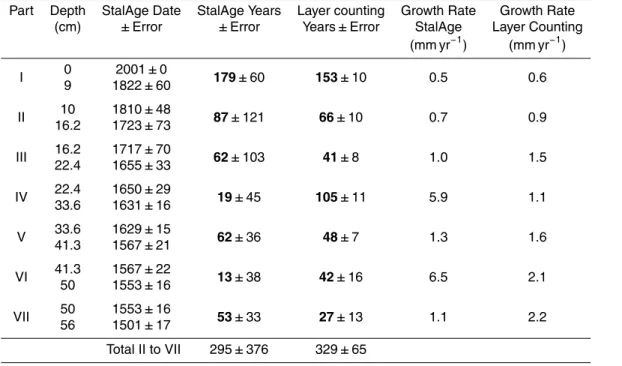
detrital 232Th, the U/Th-ages of samples from part I have large error bars. For each part, the amount of years obtained by StalAge, as well as by layer counting are listed in Table 2, together with their suggested growth rate. With the exception of part IV, both independent approaches deliver similar results within their uncertainty ranges. The uncertainties obtained by layer counting are substantially smaller than the ones
15
obtained by StalAge (Table 2). The growth rates per part, based on layer counting, are low at 0.6 mm yr−1in part I, higher around 1 mm yr−1in part II, III and IV, and very high at 2 mm yr−1 in the parts V, VI, and VII. The growth rates derived by StalAge display much larger variations between the different parts, with exceptionally high growth rates of 5.6 mm yr−1for the part IV and 6.5 mm yr−1for part VI.
20
4.3 Stable isotopes of oxygen and carbon
The δ18O values average −6.6±0.16 ‰ in part I and are slightly more negative in the parts II to VII with an average of−7.0±0.12 % (Fig. 3). Theδ13C values average −10±0.12 ‰, with no significant difference between part I and the parts II to VII. The
δ18O andδ13C signals are well correlated (R2=0.64) between the top and 12.5 cm (in
25
CPD
10, 4149–4190, 2014A 500 year seasonally resolvedδ18O/δ13C
M. Van Rampelbergh et al.
Title Page
Abstract Introduction
Conclusions References
Tables Figures
◭ ◮
◭ ◮
Back Close
Full Screen / Esc
Printer-friendly Version
Interactive Discussion
Discussion
P
a
per
|
Discus
sion
P
a
per
|
Discussion
P
a
per
|
Discussion
P
a
per
|
correlation coefficient is calculated between 12.5 and 56 cm (parts II to VII) (R2=0.16). In the latter part both isotopic signals display different long-term variations. Theδ18O signals display two periods with more negative values varying around−7.5±0.16 ‰
between 14 and 18.5 cm and between 38 and 56 cm. From 18.5 to 38 cm, in between the two more negative periods, the δ18O values are higher and vary around −6.8±
5
0.16 ‰. No such variations are visible in the δ13C values. They remain more stable around−10±0.12 ‰. Superimposed on the above discussed variations, four shorter-term, large amplitude shifts, occur between 7 and 8 cm, between 11 and 12.5 cm, at 18.5 cm and between 32 and 38 cm. Isotopic values display a simultaneous increase up to−6.0±0.16 ‰ for theδ18O and to−8.0±0.12 % for theδ13C values.
10
In the parts II to VII, the layering is clearly visible and the sampling resolution is sea-sonal being one sample per layer. Theδ18O andδ13C signals demonstrate very clear seasonal (Fig. 3) variations superimposed on the variations described above. The sea-sonality is defined as the amplitude of the seasonal variations, which is the difference in proxy values between darker and whiter layers. The seasonality inδ18O is stronger
15
during the two more negative periods, between 14 and 18.5 cm and between 38 and 56 cm, and equals 0.5 ‰. Between 18.5 and 32 cm, the δ18O seasonality lowers to 0.25 ‰. Forδ13C, the seasonality averages at 0.7 ‰. An increase inδ13C seasonality to 1.5 ‰ occurs at 32 cm and is followed by a gradual decrease until 27 cm when the seasonality returns to 0.7 ‰.
20
5 Discussion
5.1 Speleothem Age model
Two independent geochronological methods were used to establish the age model of the Proserpine: StalAge based on 20 U/Th-ages and layer counting. The total amount of years for the studied part of the Proserpine corresponds for both methods. However,
25
CPD
10, 4149–4190, 2014A 500 year seasonally resolvedδ18O/δ13C
M. Van Rampelbergh et al.
Title Page
Abstract Introduction
Conclusions References
Tables Figures
◭ ◮
◭ ◮
Back Close
Full Screen / Esc
Printer-friendly Version
Interactive Discussion
Discussion
P
a
per
|
Discus
sion
P
a
per
|
Discussion
P
a
per
|
Discussion
P
a
per
|
always correspond with the ages derived from counting the yearly layer couplets. Such is the case for part IV where StalAge suggests the part was deposited in 19±46 years while the layer counting indicates a total of 105±11 layer couplets (Table 2). The very clear layering in part IV makes it highly improbable that too many layers have been counted. Furthermore, the uncertainty on the reported StalAge age for part IV is larger
5
than the modeled value itself, indicating the very large uncertainty of the StalAge model in that part. This is due the five consecutive U/Th-ages; 1676±71 AD, 1634±30 AD,
1617±30 AD, 1635±26 AD and 1637±17 AD that cover the segment between 19.5 and 34.2 cm and all suggest an age of∼1600 within their error range. These similar ages for a large part of the stalagmite cause the StalAge modeled growth rate in part IV
10
to increase to unrealistically high values of 5.9 mm yr−1. Speleothems growing in cool temperate climate have growth rates varying between 0.01 and 0.1 mm yr−1 (Fairchild et al., 2006) indicating that the StalAge suggested growth rate is very improbable. The growth rate obtained by layer counting equals 1.1 mm layer−1 in part IV, being still high but more within the expected rates for the fast growing Proserpine. A similar
15
problem occurs in part VI. The StalAge model suggests an exceptionally high growth rate of 6.5 mm yr−1for part VI while the layer counting ages results in a growth rate of 2.1 mm yr−1, still very high, but acceptable for the fast growing Proserpine stalagmite (Verheyden et al., 2006).
Layer thickness measurements indicate thinnest layers of on average 0.3 mm in part
20
I, thicker layers of 0.5 mm in part II, III and IV and exceptionally large layers well over 1 mm in parts V, VI and VII. Two phases in which the growth rate noticeably increases may be expected at the transition of part I in part II and at the transition of part IV in V. Such a growth rate increase at the transition of part I in part II and at the transition of part IV in V is suggested in the layer counting growth rates while the StalAge growth
25
rates do not display a growth rate change at these points (Table 2).
CPD
10, 4149–4190, 2014A 500 year seasonally resolvedδ18O/δ13C
M. Van Rampelbergh et al.
Title Page
Abstract Introduction
Conclusions References
Tables Figures
◭ ◮
◭ ◮
Back Close
Full Screen / Esc
Printer-friendly Version
Interactive Discussion
Discussion
P
a
per
|
Discus
sion
P
a
per
|
Discussion
P
a
per
|
Discussion
P
a
per
|
suggests that the layer counting age model is the most accurate. The layer counting age model is thus used to establish the chronology of the Proserpine.
Based on the layer counting ages, the bottom of part I is estimated at 1847±10 AD. Below the perturbation (at 10 cm), an age estimation of the onset of the perturbation has to be made to restart the layer counting ages downwards. A first possible way
5
to estimate this age is to count the layers back upward from the U/Th-age located closest below the perturbation (=1798±45 AD). By doing this, the counted age for the top layer of part II is 1810±51 AD. A second possible way is to use the StalAge
modeled age of 1810±48 AD for the top of part II. Both age-estimations are in excellent
agreement. A14C-date on a straw piece embedded in the perturbed calcite indicates
10
an age interval of 1760 to 1810 (Verheyden et al., 2006) also suggesting a similar time window for the perturbation. The age of 1810±48 AD modeled by StalAge, has the
smallest age uncertainty of all three methods and is based on a statistical combination of the measured U/Th-dates before and after the modeled age (Scholz and Hoffmann, 2011). This age is thus considered more robust than the layer counted age based on
15
solely one U/Th-age point, and is the one we use for the onset of the perturbation. Based on this age of 1810±48 AD, and with 331±65 layer couplets counted in the parts II to VII, an age of 1479±113 AD is suggested for the start of the record at
56 cm.
5.2 Variations inδ18O,δ13C, layer thickness and calcite fabric
20
Cave monitoring results show that fresh-farmed Proserpine calcite is deposited in equi-librium with the drip water. Theδ18O values vary seasonally between −6.5±0.15 ‰
and −7.0±0.12 ‰ and the δ13C values vary seasonally between −10±0.12 ‰ and
−11±0.12 ‰ (Van Rampelbergh et al., 2014). Between 1565 and 1610, at 1730, be-tween 1770 and 1800 and bebe-tween 1880 and 1895, theδ18O and δ13C values
mea-25
CPD
10, 4149–4190, 2014A 500 year seasonally resolvedδ18O/δ13C
M. Van Rampelbergh et al.
Title Page
Abstract Introduction
Conclusions References
Tables Figures
◭ ◮
◭ ◮
Back Close
Full Screen / Esc
Printer-friendly Version
Interactive Discussion
Discussion
P
a
per
|
Discus
sion
P
a
per
|
Discussion
P
a
per
|
Discussion
P
a
per
|
changes (blue bars in Fig. 4). Calcite becomes darker between 1565 and 1610 and between 1880 and 1895. At 1730, calcite is still whiter, but heavily disturbed with layer-ing that becomes vertical in some parts, which may relate to rimstone structures on the paleo-surface of the stalagmite. Between 1770 and 1800 the calcite fabric is very matte white, different from the other parts of the speleothem and may possibly be altered by
5
the heat of the fires lit on the paleo-surface of the stalagmite between 1860 and 1810. The 4 periods where stable isotopes are not deposited in equilibrium, layers are thicker and calcite is darker or more altered, are interpreted as anomalies (Fig. 4).
Apart from the anomalies, the Proserpine δ18O and δ13C average values (−7.0±
0.16 ‰ and −10±0.12 ‰ respectively) correspond with the equilibrium values
sug-10
gested by the cave monitoring indicating that the speleothem calcite is mostly de-posited in isotopic equilibrium during the last 500 years. During these equilibrium pe-riods, the studied proxies display lower-amplitude variations. Above the perturbation, theδ18O, δ13C and layer thickness values are well correlated, layers are thinner and calcite is darker than below the perturbation (Fig. 4). Theδ18O andδ13C values
grad-15
ually decrease and the layer thickness gradually increases between 1860 and 1930. After 1930, the δ18O and δ13C values increase and layer thickness decreases. Be-low the perturbation, theδ18O and layer thickness values are still correlated while the
δ13C variations undergo a different evolution; layers are thicker and calcite is whiter compared to the calcite above the perturbation. More negativeδ18O values (around
20
−7.5±0.12 ‰) and thicker layers (>0.8 mm layer−1) occur between 1479 and 1565 and between 1730 and 1770. Between 1610 and 1730δ18O values become less negative (−6.8±0.16 ‰) and layers become thinner (around 0.4 mm layer−1). Such variations
are not visible in theδ13C signal, which remains stable around−10±0.12 ‰ between 1479 and 1770.
25
neg-CPD
10, 4149–4190, 2014A 500 year seasonally resolvedδ18O/δ13C
M. Van Rampelbergh et al.
Title Page
Abstract Introduction
Conclusions References
Tables Figures
◭ ◮
◭ ◮
Back Close
Full Screen / Esc
Printer-friendly Version
Interactive Discussion
Discussion
P
a
per
|
Discus
sion
P
a
per
|
Discussion
P
a
per
|
Discussion
P
a
per
|
ative and layers are thicker. Between 1610 and 1730, whenδ18O values are less neg-ative and layers are thinner, the seasonal amplitude lowers to 0.25 ‰. Theδ13C sea-sonality mostly equals 0.7 ‰ with a superimposed period where it increases to 1.5 ‰ at 1600 followed by a gradual return to 0.7 ‰ around 1660.
5.3 Possible factors driving theδ18O andδ13C values, layer thickness
5
and calcite fabric
Variations in speleothemδ18O values deposited in equilibrium can relate to changes in temperature, rainfall amount or source of the rainfall (Fairchild et al., 2006). Rainfall sources often implyδ18O shifts in the order of several ‰ (Fleitmann et al., 2007) while theδ13C values and layer thickness values remain unchanged. The large-scaleδ18O
10
variations in the Proserpine are in the order of 1 to 2 ‰ and always occur together with large-scaleδ13C variations of the same order and a decrease in layer thickness indi-cating that the source effect is most probably not responsible for theseδ18O variations. Due to the “amount-effect” (Dansgaard, 1964) increased rainfall amounts can cause the speleothem δ18O values to increase during wetter periods, which is often observed
15
in tropical and sub-tropical speleothem δ18O signals (Fleitmann et al., 2007; Wang et al., 2008). Comparison between the Proserpineδ18O and the annual precipitation amounts measured by the Royal Meteorological Institute (RMI) in Belgium since 1833 display no link indicating that rainfall amounts are not the primary driver of the δ18O variations (Fig. 5a and e). Temperature changes can also affect the speleothemδ18O
20
value and are more commonly expected in mid-latitude temperate climates. Multimil-lennial large-scaled temperature variations such as Dansgaard/Oescher cycles cause European speleothem δ18O values to decrease with decreasing temperature (Spotl and Mangini, 2002; Genty et al., 2003). Large amplitude climatic events such as the 8.2 kyr cold event are also clearly recorded in European speleothems mostly as a
de-25
CPD
10, 4149–4190, 2014A 500 year seasonally resolvedδ18O/δ13C
M. Van Rampelbergh et al.
Title Page
Abstract Introduction
Conclusions References
Tables Figures
◭ ◮
◭ ◮
Back Close
Full Screen / Esc
Printer-friendly Version
Interactive Discussion
Discussion
P
a
per
|
Discus
sion
P
a
per
|
Discussion
P
a
per
|
Discussion
P
a
per
|
speleothems and can cause theδ18O signal to increase or decrease with decreasing temperature. The reason for this is that the temperature effect on the rainwater δ18O is opposite to the temperature effect on calcite deposition. The temperature effect on the rainwaterδ18O signal can vary between 0.17 and 0.9 ‰◦C−1, depending on the geographical location (Dansgaard, 1964; Rozanski et al., 1992; Mook, 2000; Schmidt
5
et al., 2007). Schmidt et al. (2007) suggested a dependence of 0.3 ‰◦C−1 for central Europe. The temperature dependent fractionation during calcite formation within the cave acts in the opposite direction, and is around−0.2 ‰◦C−1 for the Proserpine drip site as suggested by monitoring results (Van Rampelbergh et al., 2014). The net effect for the Proserpine would thus be 0.1 ‰◦C−1considering that the 0.3 ‰◦C−1
tempera-10
ture dependence of the rainwater is also valid for Belgium. The uncertain link between the Proserpineδ18O values and the annual temperature is further indicated by the ab-sence of a correlation with annual temperatures measured by the Belgian RMI since 1833. We therefor do not a priori expect theδ18O variations measured in the Proser-pine to be related to solely yearly temperature nor to solely yearly rainfall variations.
15
Previous studies of western European Holocene speleothems growing in a similar climate as the Han-sur-Lesse cave, have shown that speleothemδ18O values relate to winter temperatures and winter precipitation intensities rather than to yearly tem-perature and precipitation intensities (Mangini et al., 2005; Wackerbarth et al., 2010; Fohlmeister et al., 2012). Hydrological studies of the Han-sur-Lesse epikarst show that
20
the epikarst recharge mostly occurs between spring and fall with largest amounts of recharge in winter (Bonniver, 2011). Winter rainfall has a lower isotopic composition compared to the rainfall from other seasons. Consequently, during periods of lower winter recharge, less isotopically light water will be added to the epikarst reservoir and the totalδ18O composition of the epikarst water will increase, causing increasedδ18O
25
re-CPD
10, 4149–4190, 2014A 500 year seasonally resolvedδ18O/δ13C
M. Van Rampelbergh et al.
Title Page
Abstract Introduction
Conclusions References
Tables Figures
◭ ◮
◭ ◮
Back Close
Full Screen / Esc
Printer-friendly Version
Interactive Discussion
Discussion
P
a
per
|
Discus
sion
P
a
per
|
Discussion
P
a
per
|
Discussion
P
a
per
|
lation betweenδ18O and winter temperature and precipitation has been observed at a German growth site with similar climatic conditions as the Proserpine growth site (Wackerbarth et al., 2010; Fohlmeister et al., 2012).
When deposited in equilibrium, large scaledδ13C variations may relate to vegetation type changes above the cave (C3 or C4-vegetation). Such changes may induceδ13C
5
shifts of 8 to 10 ‰ (Cerling, 1984). However, the actual C3-vegetation is the normal natural flora of the environment and there are no indications of anthropogenic impact or other dramatic environmental changes that would have possibly led to substantial changes in the C3/C4-ratio. With no major vegetation changes and calcite being de-posited in equilibrium with the drip water, lowerδ13C values in temperate regions are
10
often related to an increase of soil activity, mainly occurring during warmer and humid conditions (Genty et al., 2003; Fohlmeister et al., 2012). Plant-CO2has a lower isotopic signature compared to atmospheric CO2 (δ
13
C of C3-vegetation is between−20 and
−25 ‰, while in atmospheric CO2it evolved from−7 to−8 ‰ during the studied period).
A reduced plant-CO2 input in the soil will increase theδ 13
C of the soil-CO2 reservoir
15
and consequently the dissolved inorganic carbon (DIC) in the epikarst water. However, changes in soil activity are relatively slow and expected to cause more gradual long-termδ13C variations. Theδ13C variations in the Proserpine a short-scaled (centennial and decadal) and more abrupt variations and are consequently not expected to be driven by changes in soil activity.
20
Processes with a faster reaction time such as for example prior calcite precipitation (PCP) or disequilibrium processes are more likely to be responsible for the observed
δ13C variations. During PCP, calcite is deposited from the percolating epikarst water before entering the cave as drip water. This process mostly occurs during drier periods when aerated zones become more important in the epikarst. PCP causes a
simultane-25
CPD
10, 4149–4190, 2014A 500 year seasonally resolvedδ18O/δ13C
M. Van Rampelbergh et al.
Title Page
Abstract Introduction
Conclusions References
Tables Figures
◭ ◮
◭ ◮
Back Close
Full Screen / Esc
Printer-friendly Version
Interactive Discussion
Discussion
P
a
per
|
Discus
sion
P
a
per
|
Discussion
P
a
per
|
Discussion
P
a
per
|
epikarst (Van Rampelbergh et al., 2014). PCP is responsible for the seasonality inδ13C at the Proserpine drip site and becomes more intense during the drier summer season (Van Rampelbergh et al., 2014). PCP is consequently a process that reacts quickly to discharge changes, certainly on a seasonal scale. PCP may consequently be the forcing of the decadal and centennial variations in theδ13C values. Higher δ13C
val-5
ues in the Proserpine are interpreted as caused by stronger PCP, which occurs when discharge is lower due to colder and dryer winters.
Disequilibrium processes may cause simultaneously increased δ18O and δ13C val-ues due to strongerpCO2gradient between the cave air and drip water and/or to longer drip intervals (Mühlinghaus et al., 2009; Scholz et al., 2009; Deininger et al., 2012).
Un-10
der the present-day conditions,pCO2 levels of the cave air in the Salle-du-Dôme are
low year-round and equal the outside air values.pCO2 levels may changes over time due to changes in ventilation patterns, which may change over time due to new cave openings. No such new openings that may have affected the Salle-du-Dôme ventilation occurred in the last 500 years. The effect of changingpCO2gradient on the drip water
15
δ18O and δ13C values over the studied period is thus unlikely. Longer drip intervals due to decreased drip flow may be possible. However, under the present-day condi-tions, a continuous drip water flow feeds the stalagmite, which inhibits disequilibrium effects related to longer drip interval (Mühlinghaus et al., 2009). The drip discharge consequently needs to be sufficiently decreased, beneath a certain threshold value, to
20
allow disequilibrium processes to be present. Since recharge occurs in winter (Bon-niver, 2011), a decreased drip discharge is expected to relate with significantly drier winters, that are also colder. Furthermore, during periods of lower drip discharge, PCP will occur and further increase theδ13C signal. Decreased drip discharge due to sig-nificantly drier and colder winters will consequently cause increased correlatingδ18O
25
andδ13C values with a larger increase inδ13C values compared to theδ18O values, the latter being not affected by PCP.
CPD
10, 4149–4190, 2014A 500 year seasonally resolvedδ18O/δ13C
M. Van Rampelbergh et al.
Title Page
Abstract Introduction
Conclusions References
Tables Figures
◭ ◮
◭ ◮
Back Close
Full Screen / Esc
Printer-friendly Version
Interactive Discussion
Discussion
P
a
per
|
Discus
sion
P
a
per
|
Discussion
P
a
per
|
Discussion
P
a
per
|
is primarily dependent on two factors; the discharge amount and the cave seepage water calcium ion concentration (Genty et al., 2001). Discharge at the Proserpine drip site is expected to lower during drier and colder winters. The second factor, being the amount of calcium ion concentration, depends on (i) the residence time of the water in the epikarst, (ii) soil pCO2 and/or on (iii) PCP. If the residence time of the water
5
in the epikarst (i) is longer than several days (Dreybrodt and Scholz, 2011), the wa-ter will reach calcite supersaturation. However, since the drip wawa-ter residence time in the Han-sur-Lesse epikarst is suggested to be longer than one year (Van Ram-pelbergh et al., 2014), this effect is not expected to cause variations in calcium ion concentration. A higher soil activity increases the soilpCO2 (ii) and consequently the
10
amount of CO2dissolved in the water. Water with a higherpCO2more easily dissolves CaCO3, which increases its calcium ion concentration. However, changes in soil
ac-tivity are considered a slow process causing gradual changes on millennial and multi-milennial scales (Fohlmeister et al., 2012). SoilpCO2 variations are consequently not expected to cause decadal and centennial changes in calcium ion concentration. PCP
15
(iii) decreases the Ca2+ concentration of the drip water due to precipitation of calcite in the epikarst. Cave monitoring results show that PCP is an important process in the Han-sur-Lesse epikarst that becomes more intense during the drier summer season (Van Rampelbergh et al., 2014). PCP is consequently a fast process in the Han-sur-Lesse epikarst and is expected to be responsible for the abrupt decadal and
centen-20
nial changes in calcium ion concentration in the Proserpine drip water. A decreased calcium ion concentration of the Proserpine drip water is consequently interpreted to occur when recharge is lower during drier and colder winters. The two main factors driv-ing the growth rate, bedriv-ing the drip discharge and the calcium ion concentration, both decrease when recharge is low during drier and colder winter periods. Thinner layers
25
and darker calcite, driven by decreased growth rate, are consequently interpreted to reflect drier and colder winters.
CPD
10, 4149–4190, 2014A 500 year seasonally resolvedδ18O/δ13C
M. Van Rampelbergh et al.
Title Page
Abstract Introduction
Conclusions References
Tables Figures
◭ ◮
◭ ◮
Back Close
Full Screen / Esc
Printer-friendly Version
Interactive Discussion
Discussion
P
a
per
|
Discus
sion
P
a
per
|
Discussion
P
a
per
|
Discussion
P
a
per
|
1833. Dry conditions in the cave are consequently caused by colder and drier winters, while wetter conditions in the cave are caused by wetter and warmer winters. Excep-tionally cold and dry winters shift the drip discharge under a certain threshold value allowing disequilibrium effects to increase both theδ18O andδ13C signals simultane-ously. During such exceptionally dry periods, PCP is enhanced and further increases
5
theδ13C values. Exceptionally cold and dry winters consequently cause larger shifts in theδ13C values than in theδ18O values, which are not increased by PCP. The dry conditions during such exceptionally cold and dry winters will significantly decrease the growth rate, which causes exceptionally thin layers and very dark calcite. When the dis-charge threshold is not reached,δ18O andδ13C values are expected to reflect isotopic
10
equilibrium, and display a different evolution. During equilibrium periods, higherδ18O values are expected to reflect cooler and dryer winters. Theδ13C values are expected to increase when PCP increases during cooler and dryer winters. Thinner layers and darker calcite reflect decreased discharge, which reflects cooler and dryer winters.
5.4 Anomalies in the proxy records
15
Four periods where theδ18O andδ13C values abruptly increase away from the present-day equilibrium occur in the Proserpine from 1565 to 1610, at 1730, from 1770 to 1800 and from 1880 to 1895 (Fig. 5a and b) and are interpreted as anomalies in the record. During these anomalies theδ18O values go up to−6.0±0.16 ‰ (0.5 ‰ away from
equi-librium) and theδ13C values go up to−8.0±0.12 ‰ (2 ‰ further away from equilibrium).
20
A strong decrease in layer thickness below 0.2 mm layer−1occurs in all four anomalies. As indicated by the detailed analysis of the climatic factors affecting theδ18O andδ13C signals, disequilibrium effects and extremely thin layers only occur when drip discharge lowers under a threshold value due to exceptionally cold and dry winters. However, an anomaly caused by cold and dry winters also implies darker calcite. Only the
anoma-25
be-CPD
10, 4149–4190, 2014A 500 year seasonally resolvedδ18O/δ13C
M. Van Rampelbergh et al.
Title Page
Abstract Introduction
Conclusions References
Tables Figures
◭ ◮
◭ ◮
Back Close
Full Screen / Esc
Printer-friendly Version
Interactive Discussion
Discussion
P
a
per
|
Discus
sion
P
a
per
|
Discussion
P
a
per
|
Discussion
P
a
per
|
tween 1810 and 1860 is also considered as an anomaly due to the absence of calcite deposition. A total of five anomalies occur in the Proserpine record between 1565 and 1610, at 1730, between 1770 and 1800, between 1810 and 1860 and between 1880 and 1895. More detailed discussion of each anomaly may indicate their forcing and eventual link with climate.
5
The oldest anomaly lasts from 1565 to 1610 and displays increasedδ18O andδ13C values, thinner layers and darker calcite. Detailed analysis of the forcing behind the proxy variations indicate that such simultaneous variations occur when drip discharge shifts under a certain threshold value due to colder and dryer winters. The anomaly between 1565 and 1610 is thus considered as a period with colder and dryer winters.
10
Within this anomaly, a shorter interval with more negativeδ18O andδ13C values oc-curs together with thicker layers between 1590 and 1600 (Fig. 5a–c), indicating a short interval of warmer and wetter winters within the generally cold and dry period from 1565 to 1610. Historical data of France, Belgium and the Netherlands indicate that the period of 1565 to 1610 was characterized by icy cold winters, harsh famines, low
num-15
bers of child births and weddings, and by the outbreak of the plague with its worst years from 1562 to 1570 (Le Roy Ladurie, 2004), which confirms our observations. Le Roy Ladurie (2004) interprets the shift to cold and dry conditions at 1565 AD as the onset of the second pulse of the Little Ice Age (LIA). The shorter relatively warmer and wetter interval between 1590 and 1610 is also well-described is historical archives as being
20
a wetter decade (Le Roy Ladurie, 2004). Colder conditions between 1565 and 1610 are also illustrated in proxy based temperature reconstruction from Europe (Fig. 5i) (Luterbacher et al., 2004) and from Central Europe (Fig. 5j) (Dobrovolny et al., 2010). A shift to colder conditions at 1565 is visible in the more general Northern Hemisphere temperature reconstructions, but does not display the return to relatively warmer and
25
CPD
10, 4149–4190, 2014A 500 year seasonally resolvedδ18O/δ13C
M. Van Rampelbergh et al.
Title Page
Abstract Introduction
Conclusions References
Tables Figures
◭ ◮
◭ ◮
Back Close
Full Screen / Esc
Printer-friendly Version
Interactive Discussion
Discussion
P
a
per
|
Discus
sion
P
a
per
|
Discussion
P
a
per
|
Discussion
P
a
per
|
in the state of the North Atlantic Oscillation (NAO) (Trouet et al., 2009). More nega-tive NAO conditions cause drier conditions over northwestern Europe. Such a neganega-tive NAO phase occurred in the period between 1565 and 1610 (Trouet et al., 2009) and may be the cause of the cold and dry winters suggested by the Proserpine (Fig. 5g). A smaller interval with more positive NAO conditions around 1590 may have caused
5
the warmer and wetter interval between 1590 and 1610.
The anomaly at 1730 displays extremely short and abruptly increased isotopic values and thinner layers but does not correspond with darker calcite (Fig. 5a to c). At 1730 layering is strongly disturbed with vertical layers in some parts, which are suggested to relate to rimstone structures on the paleo-surface of the stalagmite. Calcite deposition
10
conditions for such vertically orientated layers may differ from the calcite deposition conditions in horizontal layers. Therefore the observed anomaly may not relate to cli-mate. Comparison with other proxy based climate reconstructions (Van Engelen et al., 2001; Jones and Mann, 2004; Luterbacher et al., 2004; Trouet et al., 2009; Dobrovolny et al., 2010), or historical records (Le Roy Ladurie, 2004) do not suggest a climate
15
variation around 1730 and further indicate that the anomaly at 1730 is most probably not climate-driven. A more detailed study of the evolution of the isotopes along the layers in this part together with thin section analyses may provide better insights in the processes affecting theδ18O andδ13C and layer thickness values around 1730.
The anomaly between 1770 and 1800 displays increased isotopic values and
de-20
creased layer thickness followed by a very abrupt shift back to more negative isotopic values and larger layers at 1800. The calcite fabric is very matte white and may possibly be altered by non-climatic factors. For example, the heat of fires lit on the surface of the stalagmite between 1810 and 1860 may have altered the proxy signals. However, the increased isotope values and thinner layers may not fully be overprinted by the
alter-25
CPD
10, 4149–4190, 2014A 500 year seasonally resolvedδ18O/δ13C
M. Van Rampelbergh et al.
Title Page
Abstract Introduction
Conclusions References
Tables Figures
◭ ◮
◭ ◮
Back Close
Full Screen / Esc
Printer-friendly Version
Interactive Discussion
Discussion
P
a
per
|
Discus
sion
P
a
per
|
Discussion
P
a
per
|
Discussion
P
a
per
|
interval is visible in the Northern Hemisphere (Jones and Mann, 2004) suggesting that the cooling was most probably local to Europe rather than to whole Northern Hemi-sphere. A decreased NAO index (Trouet et al., 2009) could possibly be the driver of this colder and dryer winter interval in Europe.
Between 1810 and 1860, straw pieces are found embedded in the calcite crust and
5
suggest that fires were lit on the surface of the stalagmite to illuminate the chamber (Verheyden et al., 2006). Fires could only be lit on the Proserpine under the absence of drip water and indicate exceptionally dry conditions. Historical climate data from France, Belgium and the Netherlands indicates that the period between 1800 and 1860 is the last cold pulse of the Little Ice Age (LIA,±1300–1850) and is characterized by
10
exceptionally cold winters followed by warm summers (Le Roy Ladurie, 2004). The consequence of harsh winters followed by warm summers may have added to the gen-eral discontent in France that led to the onset of the French Revolution in 1789 (Mann, 2002). The warm summers and cold winters cause no significant temperature drop in the yearly average temperature reconstructions from Europe, Central Europe or the
15
Northern Netherlands (Fig. 5h–j) (Van Engelen et al., 2001; Luterbacher et al., 2004; Dobrovolny et al., 2010). However, the colder and dryer LIA pulse is well registered by a temperature drop in the Northern Hemisphere temperatures (Jones and Mann, 2004) (Fig. 5f). Between 1810 and 1860 winter NAO conditions shifted to negative values, which may have caused the exceptionally dry winter conditions recorded in the
Pros-20
erpine (Fig. 5g) (Trouet et al., 2009). A decrease in solar irradiance occurs between 1790 and 1830, referred as the Dalton Minimum, may also be responsible for this cold and dry period (Mann, 2002). Other climate reconstructions indicate that this cold and dry interval relates to the increased volcanic eruptions during that period (Wagner and Zorita, 2005). A prominent example is the 1815 eruption of the Tambora in Indonesia
25
that injected a large amount of sunlight-reflecting aerosols in the atmosphere and that is typically blamed for the following cold summer years (Mann, 2002).
The most recent anomaly occurs between 1895 and 1880 with increasedδ18O and
CPD
10, 4149–4190, 2014A 500 year seasonally resolvedδ18O/δ13C
M. Van Rampelbergh et al.
Title Page
Abstract Introduction
Conclusions References
Tables Figures
◭ ◮
◭ ◮
Back Close
Full Screen / Esc
Printer-friendly Version
Interactive Discussion
Discussion
P
a
per
|
Discus
sion
P
a
per
|
Discussion
P
a
per
|
Discussion
P
a
per
|
suggested by the proxies nicely correspond with a cold and dry period as recorded in the instrumental temperature and precipitation record measured in Belgium by the RMI since 1833 (Fig. 5d and e). The temperature drop is also clearly visible in the temperature reconstruction from the Northern Netherlands (Van Engelen et al., 2001), Europe (Luterbacher et al., 2004) and in the Northern Hemisphere (Jones and Mann,
5
2004) (Fig. 5h, i and f). A decrease in precipitation has also been recorded in the Eng-land and Wales precipitation record, where this period is known as very dry with peak dry years at 1884, 1887 and 1893 (Nicholas and Glasspoole, 1931). The exact forc-ing behind this colder and dryer period is still in discussion. A strongly negative winter NAO phase occurs between 1880 and 1900 and could be responsible for this colder
10
and dryer interval in Europe (Luterbacher et al., 2001) (Fig. 5g). The input of volcanic gasses in the atmosphere from the Krakatoa eruption in 1883 and/or lower sunspot activity during that period have certainly also added to the cold and dry conditions (Lassen and Friischristensen, 1995).
5.5 Periods of relatively colder and drier and warmer and wetter winters
15
Periods where the four measured proxies (δ18O,δ13C, layer thickness and calcite fab-ric) do not display anomalies are deposited in equilibrium with the drip water. Proxy vari-ations in these periods indicate less extreme climate varivari-ations compared to anomaly periods. A different relation between four proxies occurs above the perturbation (2001 to 1860) compared to below the perturbation (1810 to 1479). Above the perturbation,
20
calcite is generally darker with thin layers, in which less negativeδ18O and δ13C sig-nals covary (Fig. 5a–c). Below the perturbation, calcite is whiter with thicker layers that display similar variations as theδ18O values (thinner layers – less negativeδ18O val-ues), while the δ13C values display no such variations and remain constant around
−10±0.12 ‰.
25
CPD
10, 4149–4190, 2014A 500 year seasonally resolvedδ18O/δ13C
M. Van Rampelbergh et al.
Title Page
Abstract Introduction
Conclusions References
Tables Figures
◭ ◮
◭ ◮
Back Close
Full Screen / Esc
Printer-friendly Version
Interactive Discussion
Discussion
P
a
per
|
Discus
sion
P
a
per
|
Discussion
P
a
per
|
Discussion
P
a
per
|
with the layer thickness values suggests an evolution to warmer and wetter winters up to 1930 followed by an evolution to colder and dryer winters to 2001. This observation in the Proserpine proxies does not correspond with climate variations in the Northern Hemisphere (Van Engelen et al., 2001; Jones and Mann, 2004; Le Roy Ladurie, 2004; Luterbacher et al., 2004; Dobrovolny et al., 2010) or with instrumental RMI data since
5
1833. Calcite is darker in this part due to the incorporation of soot from torches used to illuminate the chamber during cave visits (Verheyden et al., 2006). Soot incorporation in the calcite structure may hamper the calcite deposition and overprint lower-amplitude climate variations. However, large-amplitude climate variations (=anomalies) such as the cold and dry period between 1880 and 1895 are still visible within this part,
indi-10
cating that the climate signal is not fully overprinted. The possible effects of soot on
δ18O andδ13C values and layer thickness need further investigation to allow deriving low-amplitude climate variations.
Below the perturbation a small interval of very negativeδ18O andδ13C values occurs between 1800 and 1810. This short interval consists of strongly disturbed calcite in
15
the form of a crust, with no layering visible. Most probably, the heat of fires lit on the Proserpine between 1810 and 1860 (Verheyden et al., 2006) caused the calcite to develop this crust structure. Isotope values are interpreted strongly disturbed and are not used to reconstruct climate variations. With the exception of this calcite crust, the
δ18O and layer thickness signals below the perturbation can be subdivided in three
20
periods; between 1479 and 1565, between 1610 and 1730 and between 1730 and 1770 (Fig. 5a and b). Between 1479 and 1565 and between 1730 and 1770, δ18O values vary around−7.5±0.16 ‰ and layer thickness is larger than 0.8 mm layer−1. The period between 1610 and 1730, falls in between the two latter periods and displays less negativeδ18O values around−6.8±0.12 ‰ and thinner layers around 0.4 mm layer−1.
25
CPD
10, 4149–4190, 2014A 500 year seasonally resolvedδ18O/δ13C
M. Van Rampelbergh et al.
Title Page
Abstract Introduction
Conclusions References
Tables Figures
◭ ◮
◭ ◮
Back Close
Full Screen / Esc
Printer-friendly Version
Interactive Discussion
Discussion
P
a
per
|
Discus
sion
P
a
per
|
Discussion
P
a
per
|
Discussion
P
a
per
|
and 1565 and between 173 and 1770 were winters were warmer and wetter. During the three above described periods (1479–1565, 1610–1730, 1730–1770), the δ13C values vary mostly around−10±0.12 ‰ indicating no major changes in PCP intensity. However, during the period with colder and drier winters between 1610 and 1730, the
δ13C display a weak gradual increase from 1700 to 1730. The dry and cool winter
5
conditions in the period between 1610 and 1730 may have started to cause a gradual increase in prior calcite precipitation, which gradually increased theδ13C signal.
The two periods with warmer and wetter winters (1479–1565 and 1730–1770) cor-respond with two clear periods of warmer Northern Hemisphere temperatures (Jones and Mann, 2004) (Fig. 5f). These two warmer pulses are also well documented in
his-10
torical records and indicated as two warmer intervals during the LIA (Le Roy Ladurie, 2004). The period with cooler and drier winters between 1610 and 1730 corresponds with decreased Northern Hemisphere temperatures. No major winter NAO changes occur during the three periods (1479–1565, 1610–1730, 1730–1770), indicating that the variations are not driven by NAO, most probably by more global climate forcing
15
mechanisms. The colder interval between 1610 and 1730 may be related to the Maun-der Minimum, being a period of decreased solar activity between 1640 and 1714. The Maunder Minimum is interpreted to have caused lower temperatures in Europe (Luter-bacher et al., 2001) and is also interpreted to be the cause of a similar colder interval in Italian speleothems (Frisia et al., 2003).
20
5.6 Seasonality inδ18O andδ13C values
The δ18O and δ13C values were measure at a seasonal scale between 1479 and 1810 and clearly display seasonal variations (Fig. 5). Cave monitoring results show that under present-day conditions, the δ18O values display a seasonality of 0.5 ‰ in response to the seasonality in cave air temperature and has a temperature dependence
25