ISSN: 1809-4430 (on-line)
_________________________
1Engº Ambiental e Sanitarista, Doutorando em Engenharia Civil, Universidade Estadual de Campinas, Faculdade de Engenharia,
Arquitetura e Urbanismo, Campinas-SP, Fone:19 982049403, [email protected]
2 Engº Agrônomo, Doutor em Engenharia Agrícola, FEAGRI-UNICAMP/Campinas – SP, [email protected] 3Engº Agrônomo, Doutorando em Engenharia Agrícola, Universidade Estadual de Campinas, Faculdade de Engenharia Agrícola,
Campinas-SP, [email protected]
4 Engº Agrônomo, Prof. Doutor, Departamento de Recursos Naturais e Proteção Ambiental, UFSCar, Araras – SP,
5 Engº Agrônomo, Prof. Doutor, Conselho Integrado de Infraestrutura Rural, Campinas-SP, [email protected]
Recebido pelo Conselho Editorial em: 21-8-2012
WET BULBS FROM THE SUBSURFACE DRIP IRRIGATION WITH WATER SUPPLY AND TREATED SEWAGE EFFLUENT
Doi:http://dx.doi.org/10.1590/1809-4430-Eng.Agric.v35n2p 242-253/2015
MARCELO L. C. ELAIUY1, LEONARDO N. S. DOS SANTOS2, ALLAN C. M. DE
SOUSA3, CLAUDINEI F. SOUZA4, EDSON E. MATSURA5
ABSTRACT: The use of treated sewage effluent (TSE) combined with the subsurface drip irrigation (SDI) method in agriculture can decrease the costs of agricultural production, in attempts to fertigate crops more efficiently. In this study it was compared the dimensions of the wet bulb formed by the application of TSE and municipal water supply (MWS) in an Oxisoil. We have evaluated the effect of water quality and discharge between drippers used in sugarcane crop. Three trenches were opened and 21 three-rod TDR probes were setup in a mesh and a dripper was buried
at 0.30 m, for each constant discharge of 1.0 L h-1 and 1.6 L h-1. Comparing results from different
wetted soil profiles it was observed that the vertical and horizontal dimensions of the wet bulb are similar for both MWS and TSE, being peculiars according to the discharges used and volume applied. Regardless the water quality, an increase of 60% in discharge decreased the deepest infiltration.
KEYWORDS: oxisoil, wastewater; TDR; water content; electrical conductivity.
BULBOS ÚMIDOS A PARTIR DA IRRIGAÇÃO POR GOTEJAMENTO
SUBSUPERFICIAL COM ÁGUA DE ABASTECIMENTO E EFLUENTE DE ESGOTO TRATADO
RESUMO: O uso de efluente de esgoto tratado (EET), combinado com o método de irrigação por gotejamento subsuperfical (IGS) na agricultura, pode reduzir os custos de produção agrícola, fertirrigando de maneira eficiente as culturas. Neste artigo, compararam-se as dimensões do bulbo úmido formado pela aplicação de EET e água de abastecimento municipal (AAM), em um Latossolo Vermelho distroférrico. Avaliou-se o efeito da qualidade da água e da vazão entre gotejadores utilizados na cultura da cana-de-açúcar. Três trincheiras foram abertas e 21 sondas de TDR com três hastes foram instaladas em malha, e um gotejador foi enterrado a 0,30 m, para cada
vazão constante de 1,0 Lh-1 e 1,6 Lh-1. Comparando os resultados de diferentes perfis de umidade do
solo, sugere-se que as dimensões vertical e horizontal do bulbo úmido sejam similares para a AAM e para o EET, sendo peculiares de acordo com as vazões utilizadas e o volume aplicado. Independentemente da qualidade da água, o aumento de 60% na vazão reduziu a infiltração em profundidade.
243
INTRODUCTION
Although profitable, irrigated agriculture is the human activity responsible for increasing water demand in worldwide generating conflicts in relation to other water uses.
Growing competition over dwindling water resources in many agricultural areas in Brazil increases the use of marginal quality water with drip irrigation, which requires sound fertigation practices that reconcile environmental concerns with viable crop production objectives. In this context, the subsurface drip irrigation system becomes gradually popular as a means to supply water more efficiently contributing to increment agricultural productivity (CAMP, 1998). In São Paulo/Brazil the use of irrigation system, such as the subsurface, is also a technical viability to rise the productivity levels of sugarcane, due to the high cost of production areas (BARROS et al., 2009).
Nowadays there is a worldwide trend aiming at using treated sewage effluent (TSE) for crop irrigation. In addition, the combined use of TSE and subsurface drip system supply more effectively the required amount of water and nutrients to the plant and it is a practice of water reuse and preservation of water resources (BEGGS et al., 2011). This practice aims the sustainable use of the hydric resources and implements the concept of modern agriculture that seeks not only to increase the tillage production, but also press for the preservation of the environment. In this case the soil is used as a debugger and decreases the contamination risk of the environment, allowing its use for the TSE application. Indeed, particular caution must be taken with this practice in agriculture, since successive TSE applications may cause soil salinization (TAVARES et al., 2011).
In the midst of various drip irrigation systems used, the subsurface applies water directly to the root zone forming the wet bulb. In this region, the soil water content keeps close to the field capacity and evaporative losses are minimized. Nevertheless, it is necessary to known the support capacity of each soil-plant system in order to establish the most appropriate application rate by preserving the integrity of natural resources. Moreover, reports on changes in soil physical properties and leaching of nitrate or other mobile contaminants have crucial importance (LEAL et al., 2009). In Brazil the use of TSE for agricultural irrigation is still a recent practice and, consequently it demands more studies with detailed information on its benefits and drawbacks under tropical conditions (Da FONSECA et al., 2007).
The wet bulb sizing assists in proper estimate the number of drippers per plant and its location relative to the plants or plant rows, directly influences the project costs of irrigation and crop yields. Unfortunately, these sizing are often overlooked and current practices in Brazil and elsewhere in the world are too often based on empirical information or on data gleaned indiscriminately from professional literature. Alternatively, according to SOUZA et al. (2009) the shape of a wetted soil volume can be measured and controlled using water content sensing equipment, such as time domain reflectometry (TDR), which measures water content and electrical conductivity using a single probe within the same soil volume. Although several studies that investigate the wet bulbs sizing in subsurface drip irrigation are available in the literature, none use the TSE with the TDR technique to monitor the dynamic of the water and the solute.
In this study we shaped and compared the dimensions of wet bulbs in subsurface drip
irrigation with MWS and TSE, for each constant discharge of 1.0 L h-1 and 1.6 L h-1. Our findings
texture, according to criteria set by (EMBRAPA, 1999). Table 1 lists the initial soil physical characteristics.
TABLE 1. Physical characteristics of the soil in field condition Depth
(m)
Bulk Density (Kg m-3)
Total Porosity
(%)
Textu re (g Kg-1) Ksat
Clay Silt Sand (m h-1)
0-0.2 1306 51.0 580 170 250 0.032
0.2-0.4 1258 49.0 590 170 240 0.031
0.4-0.6 1205 52.0 640 140 220 0.033
0.6-0.8 1186 51.0 660 130 210 0.033
Ksat saturated hydraulic conductivity
The experiment was based on the flow rate 1.0 L h-1 and 1.6 L h-1, and the water quality
classified as municipal water supply (MWS) and treated sewage effluent (TSE). The effluent used comes from the College of Agricultural Engineering, which is composed by sanitary and domestic wastes. It is treated in an up-flow ascendant sludge blanket (UASB) and subsequently forwarded to
the “wetlands” for a secondary treatment.
In Brazil the National Environment Council (CONAMA) by the resolution 357, March 17, 2005, establishes provisions for the classification of environmental directives for the framing of superficial water bodies as well as for the establishment of conditions and standards related to dumping into effluents. Specifically for irrigation, the fresh water is classified as Class 1, 2 and 3 according to quality limits for chemical, physical, and biological parameters. These limits were used to compare and discuss the results for the TSE and the MWS.
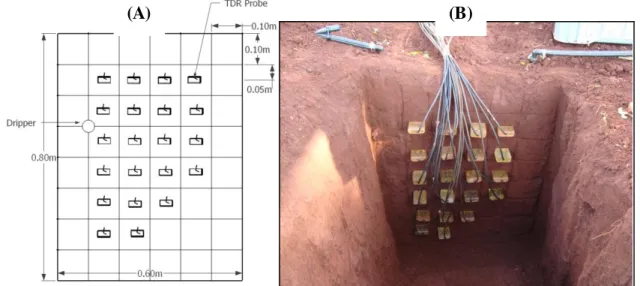
The Figure 1A shows the scheme setup of the 21 three-rod TDR probes and the dripper position. The Figure 1B illustrates the field assembly. The TDR probes were placed at 0.15,
0.25, 0.35, 0.45, 0.55 and 0.65 m – in depth, and 0.05, 0.15, 0.25 and 0.35 m – distance from the
dripper (totaling 21 probes). This layout was described in detail by BARROS et al. (2009). The three-rod probes TDR used in the experiment were built in the laboratory of hydraulic and irrigation and the constructive details are described in SOUZA et al. (2006). Each TDR probe provided spatial and temporal information on water content and solute concentration in the soil thus, enabling detailed monitoring of water and solute dynamics. In two opposite walls of each trench this
procedure was replicated using a pressure-compensating dripper (Netafim - DripNet PCT M AS
16150) buried at 0.30 m for each constant discharge of 1.0 L h-1 and 1.6 L h-1. According to PIRES
et al. (2008) this depth value is ideal for sugarcane irrigation. As recommended by BARROS et al. (2009), LOPES et al. (2010) and, LOPES et al. (2009) the irrigation was set off after two months aiming at the soil restructuring.
FIGURE 1. (A) Scheme of the experimental setup for probes and dripper; (B) Field assembly
245
Firstly the soil was irrigated with MWS for both flow rates of 1.0 L h-1 and 1.6 L h-1. The
monitoring of water distribution was performed before the irrigation with 10 L of water and afterwards. The data logger was set up to a frequency of data acquisition of 1 hour. For the MWS
evaporation, we awaited a period of 15 days to set off irrigations with (remover “the”) TSE. No
rains were reported during this period. This methodology was developed based on the research of COELHO & OR (1999).
Using the Reflectometer TDR 100 equipped with RS 232 interface and data collector CR 1000, we monitored the water content and electrical conductivity analyzing the electromagnetic signal.
The schedule of the readings were based on the application of MWS and TSE by each dripper at a time, with the 21 readings being carried out in real time using the multiplexers SDMX 50. The TDR requires a calibration equation to convert measured bulk dielectric permittivity (Ka) to soil
water content (Ѳ). In this study we used the equation based on the research of ROQUE (2007) as
follows:
(1)
Due to the estimation of apparent electrical conductivity, the TDR based on the probe characteristic impedance was obtained together with the volumetric water content values. As all the probes used in this study were constructed at the University of Campinas, the characteristic impedance parameter of the probes was measured before its installation at the field.
We used the surface mapping (Surfer 8.0) to achieve a better understanding and comparison of the dynamics of water and solute in the soil. The Kriging option was used as the interpolation method, because according to SEO (2011), using this technique is possible to predict the special values in the region of interest through the weighting linear function that is measured from the nearby known values.
RESULTS AND DISCUSSION
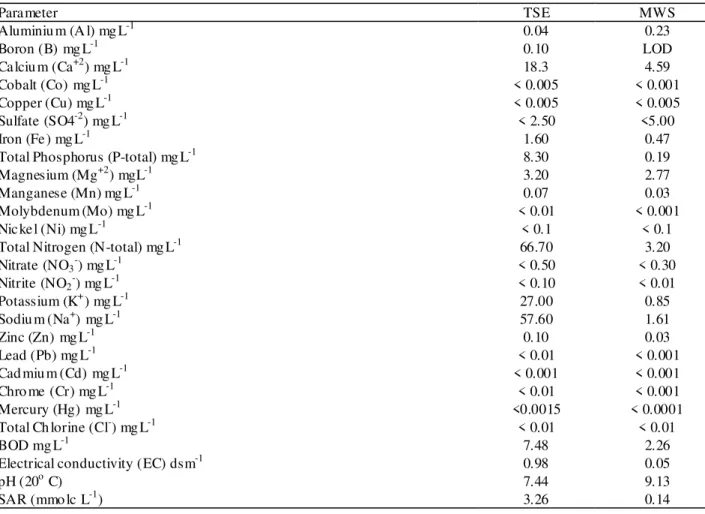
Data presented in Table 2 show the physicochemical characteristics of the TSE and the MWS, used for irrigation and analyzed based on the standard method APHA (2012).
Regarding to heavy metals, data show that Co, Cr, Zn, Cu, Ni, Mn, Pb, Cd, and Hg are under CONAMA limits in all classes, for both TSE and MWS. According to DURUIBE et al. (2007) the presence of a pollutant in the environment, such as heavy metals, has to be beyond a set or tolerance limit, which could be either a desirable or acceptable limit.
TABLE 2. Physicochemical characteristics of the TSE and the MWS
Parameter TSE MWS
Aluminiu m (A l) mg L-1 0.04 0.23
Boron (B) mg L-1 0.10 LOD
Calciu m (Ca+2) mg L-1 18.3 4.59
Cobalt (Co) mg L-1 < 0.005 < 0.001
Copper (Cu) mg L-1 < 0.005 < 0.005
Sulfate (SO4-2) mg L-1 < 2.50 <5.00
Iron (Fe) mg L-1 1.60 0.47
Total Phosphorus (P-total) mg L-1 8.30 0.19
Magnesium (Mg+2) mgL-1 3.20 2.77
Manganese (Mn) mg L-1 0.07 0.03
Molybdenum (Mo) mg L-1 < 0.01 < 0.001
Nickel (Ni) mg L-1 < 0.1 < 0.1
Total Nitrogen (N-total) mg L-1 66.70 3.20
Nitrate (NO3-) mg L-1 < 0.50 < 0.30
Nitrite (NO2-) mg L-1 < 0.10 < 0.01
Potassium (K+) mg L-1 27.00 0.85
Sodiu m (Na+) mg L-1 57.60 1.61
Zinc (Zn) mg L-1 0.10 0.03
Lead (Pb) mg L-1 < 0.01 < 0.001
Cad miu m (Cd) mg L-1 < 0.001 < 0.001
Chro me (Cr) mg L-1 < 0.01 < 0.001
Mercury (Hg) mg L-1 <0.0015 < 0.0001
Total Ch lorine (Cl-) mg L-1 < 0.01 < 0.01
BOD mg L-1 7.48 2.26
Electrical conductivity (EC) dsm-1 0.98 0.05
pH (20o C) 7.44 9.13
SAR (mmo lc L-1) 3.26 0.14
The treatments used in this field experiment were encoded to facilitate the discussion of the
results as: Municipal water supply flow rate 1.0 L h-1 (W1), Treated sewage effluent flow rate 1.0 L
h-1 (E1), Municipal water supply flow rate 1.6 L h-1 (W1.6) and Treated sewage effluent flow rate
1.6 L h-1 (E1.6). Due to the large number of figures, the wet bulbs chosen to represent the profiles
were the 1,3,5,7,10 L to 1.0 L h-1 and 1,3,5,8,10 L to 1.6 L h-1.
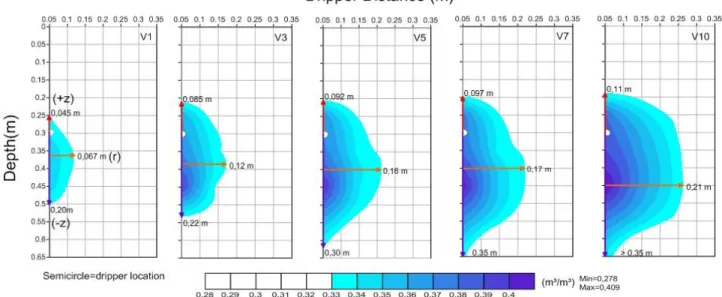
The Figures 2 and 3 show the water content profiles for each application (from 1 to 10 L) of
the MWS and the TSE using a flow rate of 1.0 L h-1. Each contour line represents an increase of
0.01 m3 m-3. The results show that the drippers’ discharge and physical properties of the soil
perform different effects on the shape of the wet bulb. In accordance with the water conte nt values obtained with the TDR can be noted that the bulbs have submitted feature forms. The volume of water applied shape bulbs, rounded and elliptical, similar to those described by ZUR (1996).
The vertical dimensions of the bulb are represented by the axes (+z) and (-z) from the emitter point shown by semicircle. The axis (r) represents the largest radial distance achieved by the wetting front during the applications.
It can be noted an accentuated downward water movement relative to lateral spreading. The downward dimension (-z) reached by the wetting front is in accordance with KOFFLER (1986), since is ideal for providing water at the effective root system of sugar cane, and avoiding water stress.
The spacing between emitters proposed by the manufacturer of the drippers, which we used in
this experiment, is 0.55 m for the flow rate of 1.0 L h-1. Evaluating the radial dimension from the
247
FIGURE 2. Soil water content profiles (m3 m-3) at the end of the infiltration process of each
application of MWS at a flow rate of 1.0 L h-1.
FIGURE 3. Soil water content profiles (m3 m-3) at the end of the infiltration process of each
application of TSE at a flow rate of 1.0 L h-1.
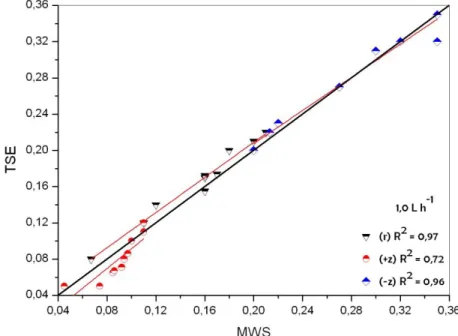
FIGURE 4. Linear regressions between the bulb dimension (+z, -z and r) for each application of
MWS and TSE and the respective correlations for 1.0 L h-1
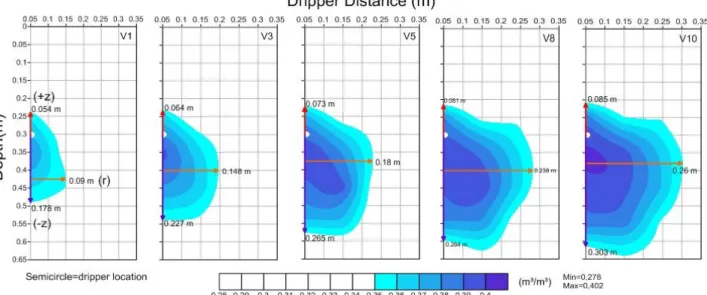
The Figures 5 and 6 present the wet bulbs for treatments W1.6 and E1.6. It is noted in these treatments that the bulbs have submitted feature forms rounded and elliptical, as described by ZUR (1996). These shapes can also be seen in KANDELOUS et al. (2011) when comparing observed and simulated water contents profiles obtained from bulbs of subsurface dripping irrigation on clay soil at 0.30 m deep.
As observed, increasing the discharge of the dripper to 1.6 L h-1 increases the horizontal
radius. However, decreasing the discharge to 1.0 L h-1 increases the vertical radius of the wet bulb.
It happens due to the change of the infiltration area according to the treatments, but it is important to notice that regardless the water quality an increase of 60% in discharge decreases the deepest infiltration. It was also described by LOPES et al. (2009), thus confirming the findings presented here. Moreover, the discharge rate is directly proportional to the soil water content around the dripper, as described by DIAMANTOPOULOS, (2009).
In addition, the spacing between emitters proposed by the manufacturer of the drippers is 0.65
m for the flow rate of 1.6 L h-1, which is the same explanation given for the horizontal dimension of
discharge of 1.0 L h-1. Therefore, we also propose an occurrence of a continuous horizontal band of
249
FIGURE 5. Soil water content profiles (m3 m-3) at the end of the infiltration process of each
application of MWS at a flow rate of 1.6 L h-1.
FIGURE 6. Soil water content profiles (m3 m-3) at the end of the infiltration process of each
application of TSE at a flow rate of 1.6 L h-1.
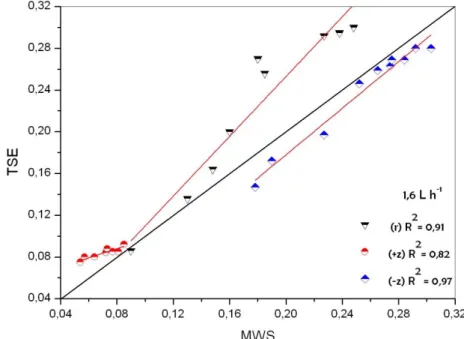
FIGURE 7. Linear regressions between the bulb dimension (+z,-z and R) for each application of
MWS and TSE and the respective correlations for 1.6 L h-1
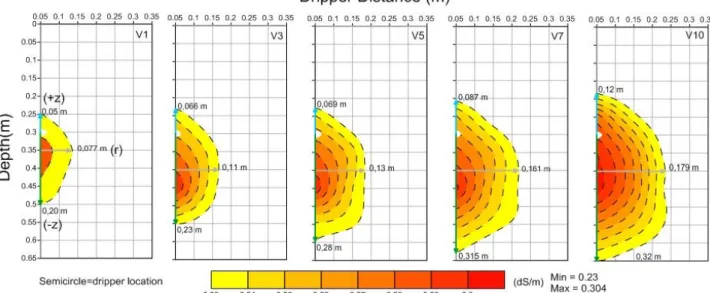
The Figures 8 and 9 show the electrical conductivity (EC) of the TSE as a function of water
content estimated by TDR. We considered the flow rates of 1.0 L h-1 and 1.6 L h-1. It can be
observed that the bulbs shaped by interpolating the values of EC show similar format when compared to the water content bulbs. However, it can be noted a reduction in the dimensions of axes (+z), (-z) and (r). LOPES et al. (2010) observed the same occurrence and suggested that the ions come forward in advance of water, and it moves slightly ahead of solutes toward to the extreme of the bulb. This delay is defined as sorption, which the speed of the chemical species is less than the speed of the groundwater. It includes the adsorption that is a physicochemical process in which the molecular attraction connects the solute to the solid surfaces such as, rock or soil particles. The materials that behave as absorbents are clays, oxy-hydroxides of Fe and Al and organic substances. Therefore, we used in this study a clay soil and its capacity to retain ions and its ion exchange explain the bulb reduction when dimensioned by the electrical conductivity parameter.
Considering as a reference the dripping point and comparing the dimension (-z) for both flow
rates 1.0 L h-1 and 1.6 L h-1 the ions in the TSE tends to reach greater depths in the lowest flow.
251
FIGURE 8. Distribution of electrical conductivity in the soil, 1.0 L h-1
FIGURE 9. Distribution of electrical conductivity in the soil, 1.6 L h-1
CONLUSIONS
The following conclusions may draw from the results: (1) There were no differences between the dimensions of the wet bulb formed from the application of MWS and TSE to the flow rate of 1.0
L h-1 in an Oxisoil at 0.30 m of depth, as well as to the flow rate of 1.6 L h-1; (2) The interactions
between the different profiles (water content versus electrical conductivity) revealed a gradient distribution of the solute in the soil near the emitter, decreasing progressively towards the wetting
front; (3) Increasing the flow rate from 1.0 L h-1 to 1.6 L h-1 raised the horizontal radius of the wet
APHA - AMERICAN PUBLIC HEALTH ASSOCIATION. Standard methods for the
examination of water and wastewater. 22th ed. Washington: APHA/AWWA/WPCF, 2012. 1496 p. BARROS, A.C.; FOLEGATTI, M. V.; SOUZA, C. F.; SANTORO B. L. Distribuição de água no
solo aplicado por gotejamento enterrado e superficial. Revista Brasileira de Engenharia Agrícola e
Ambiental, Campina Grande, v.13, n.6, p.700–707, 2009.
BEGGS, R.A.; HILLS, D.J.; TCHOBANOGLOUS, G.; HOPMANS, J.W. Fate of nitrogen for subsurface drip dispersal of effluent from small wastewater systems. Journal of Contaminant Hydrology, Amsterdam, v.126, n. 1–2, p.19-2825, Sept. 2011.
CAMP, C.R. Subsurface drip irrigation: a review. Transactions of ASAE, St. Joseph, v.41, p.1353–
1367, 1998.
COELHO, E. F.; OR, D. Root distribution and water uptake patterns of corn under surface drip irrigation. Plant and Soil, Dordrecht, v.206, p.123-136, 1999.
CONAMA - CONSELHO NACIONAL DO MEIO AMBIENTE. Resolução no 357, de 17 de março de 2005. Dispõe sobre a classificação dos corpos de água e diretrizes ambientais para o seu enquadramento, bem como estabelece as condições e padrões de lançamento de efluentes, e dá outras providências. Brasília, DF, 2005. 23p.
Da FONSECA, A.F.; HERPIN, U., PAULA, A.M.; VICTORIA, R.L.; MELFI, A.J. Agricultural
use of treated sewage effluents: agronomical–environmental implications and perspectives for
Brazil. Scientia Agricola, Piracicaba, v.64, p.194–209, 2007.
DURUIBE, J. O.; OGWUEGBU, M. O. C.; EGWURUGWU, J. N. Heavy metal pollution and human biotoxic effects nternational. Journal of Physical Sciences, v.2, n.5, p.112-118, may 2007. ELMALOGLOU, S.; DIAMANTOPOULOS, E. Simulation of soil water dynamics under
subsurface drip irrigation from line sources. Agricultural Water Management, Amsterdam, v.96, Issue 11, p.1587-1595 November. 2009.
EMBRAPA - EMPRESA BRASILEIRA DE PESQUISA AGROPECUÁRIA. Centro Nacional de Pesquisa de Solos. Sistema brasileiro de classificação de solos. Brasília: Embrapa-SPI;
EMBRAPA-CNPS, 1999. 412 p.
KANDELOUS, M. M.; SIMUNEK, J.; van GENUCHTEN, M.TH.; MALEK, K. Soil Water Content Distributions between Two Emitters of a Subsurface Drip Irrigation System. Soil Science Society of America Journal, Madison, v.75, n.2, mar./apr. 2011.
KOFFLER, N. F. A profundidade sistema radicular e o suprimento de água às plantas no cerrado.
Piracicaba: Potafós, 1986. P. 1-12.
KREITLER , C. W.; JONES, D. C. Natural Soil Nitrate: The Cause of the Nitrate Contamination of
Ground Water in Runnels County. Groundwater , Austin, v.13, n. 1, p.53–62, jan. 1975.
LEAL, R. M. P.; HERPIN, U.; FONSECA, A. F.; FIRME, L. P.; MONTES, C. R., MELFI, A. J. Sodicity and salinity in a Brazilian Oxisol cultivated with sugarcane irrigated with wastewater. Agricultural Water Management, Amsterdam, v.96, n.2, p.307-316, feb. 2009.
LOPES, L. do N.; SOUZA, C.F.; SANTORO, B. de L. Utilização da TDR para monitoramento da solução de nitrato de potássio em Latossolo Vermelho-amarelo. Engenharia Agrícola, Jaboticabal, v.30, n.5, p.932-947, 2010.
LOPES, L. do N.; MARTINS, E.; SANTORO, B. de L.; SOUZA, C.F. Caracterização da
distribuição da água no solo para irrigação por gotejamento. Irriga, Botucatu, v. 14, n. 4, p.564-577, out.-dez. 2009.
253
ROQUE, M.W. Variabilidade espacial de atributos físico-hídricos do solo cultivado com feijão irrigado submetido a diferentes sistemas de preparo. 2007. 198 f. Tese (Doutorado em Engenharia
Agrícola) – Faculdade de Engenharia Agrícola, Universidade Estadual de Campinas, Campinas,
2009.
SONCELA, R.; SAMPAIO S. C.; VILAS BOAS, M. A.; TAVARES, M. H. F.; SOUZA, C.F.; SONCELA, A. S. Electrical conductivity of soil irrigated with swine wastewater estimated by time-domain reflectometry. Revista Brasileira de Ciência do Solo, Viçosa, MG, v.35, n.4, p. 1293-1300, 2011.
SOUZA, C.F; FOLEGATTI, M.V.; OR, D. Distribution and storage characterization of soil solution
for drip irrigation. Irrigation Science, Heidelberg, n.27, p.277–288, 2009.
SOUZA, C.F.; MATSURA, E.E.; FOLEGATTI, M.V.; COELHO, E.F.; OR, D. Sondas de tdr para a estimativa da umidade e da condutividade elétrica do solo. Irriga, Botucatu, v. 11, n. 1, p. 12-25, jan./mar. 2006.
SEO, S.I.; LEE, M. K.; KIM, S.; KIM, N. Robust optimum design of a bearingless rotation motor
using the Kriging model. International Journal of Precision Engineering and Manufacturing,
Seoul, v. 12, n. 6, p. 1043-1050, dec. 2011.