Lineages Split by Environmental Heterogeneity: A Case
Study of
Primula obconica
in Subtropical China
Hai-Fei Yan1, Cai-Yun Zhang1,4, Feng-Ying Wang3, Chi-Ming Hu1, Xue-Jun Ge1, Gang Hao2*
1Key Laboratory of Plant Resources Conservation and Sustainable Utilization, South China Botanical Garden, Chinese Academy of Sciences, Guangzhou, China,2College of Life Sciences, South China Agricultural University, Guangzhou, China,3Shanghai Chenshan Plant Science Research Center, Chinese Academy of Sciences, Shanghai Chenshan Botanical Garden, Shanghai, China,4Graduate University of the Chinese Academy of Sciences, Beijing, China
Abstract
Background:Current and historical events have both affected the current distribution patterns and intraspecific divergence of plants. While numerous studies have focused on the Qinghai-Tibetan Plateau (QTP), the impacts of such events on the flora of subtropical China remain poorly understood. Subtropical China is famous for its highly complex topography and the limited impact from glaciation during the Pleistocene; this may have resulted in a different genetic legacy for species in this region compared to fully glaciated areas.
Methodology/Principal Findings:We used plastid and nuclear DNA sequence data and distribution modeling to analyze the divergence patterns and demographic history ofPrimula obconicaHance, a widespread herbaceous montane species in subtropical China. The phylogenetic analysis revealed two major lineages (lineage A and lineage B), representing a west-east split into the Yunnan and Eastern groups, and the Sichuan and Central groups, respectively. The Eastern and Central groups comprised relatively new derived haplotypes. Nested Clade Analysis and Bayesian Skyline Plot analyses both indicated that P. obconicamainly experienced a gradual expansion of populations. In addition, the simulated distribution ofP. obconica during the Last Glacial Maximum was slightly larger than its present-day distribution.
Conclusion/Significance:Our results are the first to identify a west-east migration ofP. obconica. The gradual expansion pattern and a larger potential distribution range in cold periods detected for P. obconicaindicate that the population expansion of this species is consistent with the phalanx model. In addition, the current patterns of genetic differentiation have persisted as a result of the extensive environmental heterogeneity that exists in subtropical China.
Citation:Yan H-F, Zhang C-Y, Wang F-Y, Hu C-M, Ge X-J, et al. (2012) Population Expanding with the Phalanx Model and Lineages Split by Environmental Heterogeneity: A Case Study ofPrimula obconicain Subtropical China. PLoS ONE 7(9): e41315. doi:10.1371/journal.pone.0041315
Editor:Keith A. Crandall, George Washington University, United States of America
ReceivedJanuary 5, 2012;AcceptedJune 25, 2012;PublishedSeptember 1 , 2012
Copyright:ß2012 Yan et al. This is an open-access article distributed under the terms of the Creative Commons Attribution License, which permits unrestricted use, distribution, and reproduction in any medium, provided the original author and source are credited.
Funding:This study was financially supported by the National Natural Science Foundation of China (Grant Nos. 31170205 and 30900160) and a Special Research Program of Shanghai Chenshan Botanical Garden (G102401). The funder had no role in study design, data collection and analysis, decision to publish, or preparation of the manuscript. No additional external funding received for this study.
Competing Interests:Feng-Ying Wang is affiliated to the Shanghai Chenshan Botanical Garden who supported this study via a Special Research Program (G102401). This does not alter the authors’ adherence to all the PLOS ONE policies on sharing data and materials.
* E-mail: haogang@scau.edu.cn
Introduction
The distribution patterns and evolution of plants are profoundly impacted by their life history traits, environmental heterogeneity and historical events. However, the importance of these factors in the genetic divergence within and between species, along with the importance of changes in distribution patterns, remains a contentious issue [1]. There are two population expansion models reflecting the genetic legacy of the climatic oscillations and environmental heterogeneity. The pioneer model, first described by Hewitt [2], predicts that the pioneer (or edge) population expanding from a refugium will have relatively low genetic diversity as a result of founder effects. For example, the southern regions of Europe and North America are inhabited by a much greater number of species with more numerous subspecific divisions and greater allelic diversity than their northern counter-parts [3–4], since vast areas of northern Europe and North
America were repeatedly covered by massive ice-sheets during past glaciations [5]. In contrast, the phalanx model, first documented for alpine species [3,6–7], describes the effects of slower expansions from refugia, with less significant bottlenecks than those encountered in pioneer-type expansions because many alleles are able to colonize sites over short distances [2]. Compared with the pioneer model which has been well documented in Europe and North America, the phalanx model has received comparatively little attention despite its potential importance in the evolution and demographic history of montane species.
Previous research on population expansions in China has mainly focused on the Qinhai-Tibetan Plateau (QTP), including the Himalaya-Hengduan Mountains (HHM). These studies indicated that the colonization patterns of most species in this region are consistent with the pioneer model, with populations on the QTP exhibiting relatively low genetic diversity and/or pure genetic haplotypes while those in the HHM exhibit high diversity
[8–12]. However, the historical evolutionary relationships between species inhabiting the HHM and the adjacent eastern area (especially subtropical China) remain unknown.
Subtropical China is famous for its complex topography. There is a remarkable decrease in altitude from west to east, which divided China into three geographic zones: the QTP, with an average elevation of 4000–5000 m a.s.l.; the eastern plain, which lies below 1000 m a.s.l.; and a transitional belt between the QTP and the eastern Plain ranging from 1000–2000 m a.s.l [13] (See inset map in Figure 1). Subtropical China spans all three of these zones: the HHM and the Yungui Plateau are examples of the first two, while the eastern plain is representative of the third. Additionally, there are also differences in the orientation of the mountain ranges in subtropical China. For example, many mountain ranges and large river systems that cross the HHM region run from north to south, while the Yungui Plateau and the eastern plain are oriented from west to east [13] (Figure 1). The complex topography of subtropical China provides varied micro-habitats for living organisms, which was used to explain its extremely high biodiversity compared to other areas in the region [14–16].
Subtropical China itself is thought to have been one of the most important refugia during the middle Miocene extinction (ca. 15 Mya) [17]. However, the impact of climatic oscillation during the Pleistocene on the present-day distribution of species is still being debated. One opinion, based on palaeovegetation data, is that evergreen broad-leaved forests in the subtropical region retreated southward to their present tropical zone during the Last Glacial Maximum (LGM) [18–20]. It is notable, however, that the
subtropical region was never covered by massive ice sheets in the Pleistocene [21]. Consequently, this region might have harbored multiple refugia due to its mosaic of mountains and relatively mild environment [22], which are partially supported by resent studies [23–27].
As represented above, the population expansion of montane species in subtropical China might have occurred as described by the phalanx model, with species migrating down along mountain slopes and gradually expanding during cold periods but being forced to retreat upwards and form isolated island-like populations during the warm and moist interglacial periods. If this were the case, we would expect to detect a gradual expansion in effective population size, and a simulated species distribution in cold periods that is larger than at present.
The genusPrimulaexhibits the typical Chinese radiation pattern from the southwest to southeast [28]; the majority of Primula
species in China are restricted to the southwest [29–30].Primula obconica is a unique Primula species that has a relatively wide distribution range from southwest China (Yunnan and Sichuan provinces) to east China (Fujian province) stretching from 99uto 118uE and from 25u to 31uN, which means it is distributed in subtropical China [14,29]. It mainly grows in moist thickets and deciduous forests at elevations of 500 to 3000 m [29], and its broad range suggests substantial adaptations to different environ-mental conditions. Six subspecies were recognized by morphology, viz., ssp.obconica, ssp.begoniiformis(Petitm.) W. W. Smith & Forr.; ssp.parva(I. B. Balfour) W. W. Smith & Forr.; ssp.werringtonensis
(Forr.) W. W. Smith & Forr.; ssp.nigroglandulosa(W. W. Smith & Fletcher) C. M. Hu; and ssp.fujianensisC. M. Hu & G. S. He [29–
Figure 1. Sampling locations for the 23 populations ofPrimula obconicaexamined in this study.Circles with yellow and green colors correspond to lineages A and B (based on the plastid DNA dataset), respectively. Red dashed lines denote the lineage divergences identified by TCS and phylogenetic analyses, and the black dashed line indicated the 29uN latitudinal line in the HHM. The outer circle patterns (dashed or solid) correspond to the results from the ITS dataset. The inset map indicates the geographical features of China and the distribution range examined in the present study.
31]. Of these subspecies, only ssp.obconicais distributed throughout almost the entire range. The other subspecies are all endemic and sympatric with ssp.obconicawith the exception of the most recently described subspecies ssp. fujianensis, which occurs solely in the easternmost Fujian province [30–31]. The wild P. obconica was formally reported as diploid [32], although autotetraploid form was recorded as well [33–34]. Dowrick [33] pointed out that homostyly have not been found in the diploids but are present in the tetraploids, which means homostyly is significantly correlated with the polyploidy inPrimula[35–36]. In our samplings, all wild populations were heterostylous except ssp. fujianensis, which is isolated both in distribution and reproduction from other subspecies ofP. obconica[31].
In the present study, we used P. obconicaas a model to test competing hypotheses to explain the migration and evolution of species in subtropical China by examining two polymorphic plastid loci and the complete nuclear ribosomal Internal Tran-scribed Spacer (ITS) region. Specifically, we aimed to determine: (i) whether the species originated from southwest China (or HHM), then eastward migrated; (ii) whether the phalanx or the pioneer model better describe the species’ population expansion and demographic history; and (iii) the impact of environmental heterogeneity on the species’ present-day distribution.
Materials and Methods
Ethics statement
No specific permits were required for the described field studies, since all samples were collected by researchers following current Chinese regulations. Primula obconica is not endangered nor protected in the sampled area, and none of the sampled locations are privately owned or protected by any law.
Population sampling, DNA extraction, PCR and sequencing
Twenty-three populations were sampled throughout the distri-bution range ofP. obconica, representing four subspecies (Figure 1, Table 1).Primula obconicassp.parvaand ssp.nigroglandulosacould not be sampled in this study because of their extremely limited distribution ranges [29]. Fresh leaves were immediately preserved in silica gel in the field, and total genomic DNA was extracted using the modified cetyltrimethyl ammonium bromide (CTAB) protocol [37]. Two plastid DNA regions (trnL-trnF andrps16) and a nuclear marker (ITS) were amplified [38–40]. Amplicons were purified using a DNA gel purification kit (TaKaRa) and sequenced in both directions using an ABI Big Dye Terminator Cycle-sequencing ready-reaction kit (Applied Biosystems) on an ABI 3700 DNA Analysis System (Applied Biosystems). An additional internal sequencing primer was designed to obtain the entire sequence of the rps16 region (hc-p1: 59 -GGTATGTTGCTGC-CATTTTG-39) due to homopolymer runs. All bidirectional sequencing reactions were carried out by Invitrogen Trading Shanghai Co., Ltd.
Sequence quality was checked against the original chromato-gram and assembled using SeqManTM (DNASTAR). For ITS sequencing, the presence of ‘double peaks’ at polymorphic sites for ITS in the chromatogram were check manually. Alleles (haplo-types) were first determined through haplotype subtraction [41]. Alternatively, orphaned alleles were resolved using PMD-18 vectors (TaKaRa) and by sequencing multiple clones. Resequen-cing was used to validate the occurrence of singletons for both the plastid DNA and ITS dataset. All haplotypes sequences (chlor-otypes and rib(chlor-otypes) were deposited in GenBank (Table S1).
Nucleotide diversity and intraspesific divergence
Sequences for each fragment were aligned by Clustal X 1.18 [42], and further adjusted manually. Haplotype diversity (Hd) and
nucleotide diversity (p) were calculated using DnaSP 5.0 [43]. In addition, we also calculated within-population genetic diversity (HS), total diversity (HT), and two other parameters of population
differentiation (GSTandNST) using PermutCpSSR 2.0 with 1000
permutations [44] (http://www.pierroton.inra.fr/genetics/labo/ Software/PermutCpSSR/).GSTis a parameter estimate based on
haplotype frequencies; whileNSTtakes into account the differences
between haplotypes. The comparison of GST and NST was
conducted by PermutCpSSR based on 1000 random permuta-tions.
Analysis of molecular variance (AMOVA) was performed to assess the genetic differentiation among groups and between populations within groups (identified by phylogenetic analyses) using the program Arlequin 3.0 [45], and significance tests were conducted based on 1000 permutations.
Phylogenetic reconstruction
Chlorotypes for the combined plastid fragments were generated by DnaSP 5.0 [43]. We performed Maximum Parsimony analysis (MP) and Bayesian Inference (BI) to infer the phylogenetic relationships among chlorotypes ofP. obconica. The MP analysis was conducted by PAUP*4.0b10 with a heuristic search using the random addition of sequence method (1000 replicates) with the tree-bisection-reconnection (TBR) branch swapping, MUL-TREES, and BRANCHES COLLAPSED options selected [46]. The robustness of the trees was estimated by nonparametric bootstrapping (1000 replicates) [47]. The best-fitting model of GTR+G+I, calculated using Modeltest 3.7 based on Akaike’s Information Criterion (AIC) [48], was applied to the BI analysis conducted by MrBayes 3.1.2 [49]. For each analysis, the Markov chain Monte Carlo (MCMC) algorithm was run for 2,000,000 generations with four simultaneous chains, starting from random trees and sampling one tree every 1000 generations. After the chains had become stationary, as judged from plots of likelihood and from split variances being,0.01, the first 10% of generations were discarded as burn-in. A majority rule consensus tree was constructed and posterior probabilities (PP) of nodes were calculated from the remaining samples. Based on the genus-wide phylogeny [50–51], Primula barbicalyx Wright, which, like P. obconica, belongs to the sect. ObconicolisteriBalf. f., and was used as an outgroup. In addition, a statistical parsimony network was constructed by TCS 1.13 [52]. Ambiguous connections (loops) in the networks were resolved following the procedure described by Crandall et al. [53].
Nested Clade Analyses based on Chlorotype dataset
We defined hierarchic clades for Nested Clade Analysis (NCA) using the nested design rule [54]. The program GeoDis [55] calculates two main statistics on the nested cladogram: the clade distance (Dc) and the nested clade distance (Dn). These distances
then were used to calculate an interior-tip statistic (I-Tcand I-Tn)
Inferring demographic history
In order to test whether historical demographic expansion events have ever occurred in P. obconica, two neutrality tests, Tajima’s D [57] and Fu’s Fs [58] statistics, were calculated by Arlequin 3.0. Significantly negative Tajima’sDindicates an excess of low-frequency alleles that can arise from purifying selection, rapid population expansion, and selective sweeps [59]. Fu’s Fsis expected to have significantly large and negative values under conditions of demographic expansion [58]. The statistical signif-icance of the estimates was calculated by Arlequin 3.0 with 1000 permutations.
Mismatch distribution analyses were used to examine demo-graphic changes. The distributions of the frequency of observed and simulated pairwise differences among sequences were plotted by Arlequin 3.0 [60]. The shape of the observed mismatch distribution was tested against the null hypothesis of population expansion. The sum of squared deviations (SSD) between the observed and the expected mismatch distributions [61], and the raggedness index (Rag), were used to test the goodness-of-fit of the
observation mismatch distribution to the expectation of a population expansion model [62]. If the sudden expansion model was not rejected, the relationshipt= 2mt[60] was used to estimate the age of expansion (t), wheremis the substitution rate for DNA sequences.
Despite the uncertainty of the plant molecular clock in general and the lack of reliable fossil record for the genus Primula, a conventional molecular clock for the herb trnL-trnF region (8.2461029subst. per site per yr, [63]) is employed in this study, as all species ofPrimulaare perennial or annual plants that flower every year. In order to decide whether this rate is suitable for all plastid DNA combined, net average distance (Da) under
Juke-cantor model was calculated fortrnL-trnF and the combined data, respectively.
A Bayesian Skyline Plot (BSP), a method that does not rely on a prespecified parametric model of demographic history, was used to estimate past population dynamics over time from a sample of molecular sequences using a Markov chain Monte Carlo (MCMC) algorithm [64] with BEAST 1.4.7 [65]. We used this method to Table 1.Plant material, their sources, the detected chlorotypes and the genetic diversity identified in this study.
Nos.
Population
codes Locations
Longitude (E),
Latitude (N) Taxon N p(sd) Hd(sd)
Chlorotypes (nos. of individuals)
Lineage A: Eastern group
58 0.00122 (0.000122) 0.829
1 NP Nanping, Fujian 118u129480, 26u439180 ssp.fujianensis 6 0 0 C14(6)
2 LC Lechang, Guangdong 113u009170, 25u019000 ssp.obconica 9 0.00023 (0.00010) 0.389 (0.164) C3(2), C13(7) 3 RY-1 Ruyang, Guangdong 113u039420, 24u519190 ssp.obconica 8 0.00119 (0.00065) 0.464 (0.200) C4(1), C13(7) 4 RY-2 Ruyuan, Guangdong 113u119020, 25u009400 ssp.obconica 11 0.00030 (0.00012) 0.473 (0.162) C9(1), C13(8), C15(2) 5 SZ-2 Sangzhi, Hunan 110u019180, 29u329000 ssp.obconica 9 0.00036 (0.00013) 0.556 (0.165) C5(2), C6(1), C7(6) 6 YC-1 Yichang, Hubei 111u209060, 30u539190 ssp.obconica 6 0.00020 (0.00013) 0.333 (0.215) C1(5), C2(1)
7 YC-2 Yichang, Hubei 110u599040, 30u589000 ssp.obconica 3 0 0 C8(3)
8 EMS Emeishan, Sichuan 103u249300, 29u339350 ssp.obconica 6 0.00104 (0.00041) 0.600 (0.215) C10(4), C11(1), C12(1)
Lineage A: Yunnan group
27 0.00739 (0.00055) 0.855
9 LQ Luquan, Yunnan 102u289340, 25u349090 ssp.begoniiformis 5 0 0 C19(5)
10 DL Dali, Yunnan 100u069370, 25u439300 ssp.obconica 5 0 0 C20(5)
11 WX Weixi, Yunnan 99u159480, 27u119150 ssp.obconica 5 0 0 C18(5)
12 BS-1 Baoshan, Yunnan 99u069490, 25u169420 ssp.obconica 5 0.00048 (0.00028) 0.400 (0.237) C16(4), C17(1) 13 BS-2 Baoshan, Yunnan 99u219520, 25u019550 ssp.begoniiformis 7 0.00017 (0.00012) 0.286 (0.196) C21(6), C22(1)
Lineage B: Sichuan group
28 0.00375 (0.00021) 0.804
14 WWS Wawushan, Sichuan 103u059370, 29u429210 ssp.obconica 5 0.00144 (0.00086) 0.400 (0.237) C29 (1), C30(4)
15 LD Luding, Sichuan 102u129460, 29u529560 ssp.obconica 5 0 0 C31 (5)
16 DJY-1 Dujiangyan, Sichuan 103u339560, 31u059360 ssp.obconica 5 0 0 C34(5) 17 DJY-2 Dujiangyan, Sichuan 103u349430, 31u089400 ssp.obconica 5 0 0 C34(5) 18 ML-1 Yanyuan-Muli,Sichuan 101u079590, 27u399560 ssp.werringtonensis 3 0 0 C33(3) 19 ML-2 Muli, Sichuan 101u169500, 27u569310 ssp.werringtonensis 5 0 0 C32(5)
Lineage B: Central group
26 0.00164 (0.00012) 0.815
20 SZ-1 Sangzhi, Hunan 109u599570, 29u339540 ssp.obconica 7 0.00017 (0.00012) 0.286 (0.196) C23(6), C24(1)
21 NC Nanchuan, Chongqing 107u129550, 29u029400 ssp.obconica 6 0 0 C25(6)
22 FJS Fanjingshan, Guizhou 108u429070, 27u529470 ssp.obconica 6 0 0 C28(6)
estimate changes in the effective population size (Ne) ofP. obconica since the time to the most recent common ancestor (TMRCA). We performed four MCMC runs for 10 million iterations, sampling genealogy and population size parameters every 1000 iterations and discarding the first 10% as burn-in. The linear growth model was selected for this analysis. We used an uncorrelated lognormal model [66] to account for rate variation among lineages with the nucleotide substitution model (GTR+G+I), though the mean substitution rate was fixed by an assumed molecular clock for herbs. Demographic history through time was reconstructed by the software Tracer 1.3 [67]. Time and effective population size were defined as million year andh(Net;t, generation time) for the
BSP.
Past and current distribution inference
In order to validate the impact of the length of cold periods (such as LGM) on the distribution ofP. obconica, we inferred the distribution range using an Ecological Niche Model. Assuming the species has not changed its climatic preference, we reconstructed the range ofP. obconicaduring the LGM according to its current distribution using a maximum entropy model (Maxent 3.1.0, [68]), which was considered to be more robust than other methods (cf. [69]). The current distribution information for P. obconica was estimated from collection records of the species from three main herbaria in China (IBSC, KUN and PE), and sampling sites in this study were also added to cover the whole distribution range (Table S2). Bioclimatic variables of current conditions and the LGM data at 2.59 spatial resolution were downloaded from the worldClim database (http://www.worldclim.org/, [70]). We used LGM data simulated by the Model for Interdisciplinary Research on Climate (MIROC) [71]. In a preliminary investigation, we first chose all 19 environmental parameters to model the potential distribution of the species, but discarded several parameters from further analysis due to their low contribution levels (,1% as shown by their Maxent result). We chose 10 replicate runs in each analysis to ensure more reliable results. In order to test the performance of each model, 20% of the data in each run was randomly selected by Maxent and compared with the model output created with the remaining data. The area under the receiver operating charac-teristic curves (AUC) was used to compare model performance [68].
Results
Plastid DNA sequence variation and genetic structure
For the plastid DNA dataset, a total of 34 chlorotypes was identified whentrnL-trnF andrps16 were combined, including 77 site substitutions and 6 indels. The geographical distribution of the chlorotypes was highly structured (see Figure 1 and Table 1). Populations were fixed with unique chlorotypes, except for populations RY-1, RY-2 and LC from Guangdong province and populations DJY-1 and DJY-2 from Sichuan province, which shared C13 and C34, respectively. Haplotype diversity (Hd) varied
among populations. HighHdvalues were found in central China
(e.g. SZ-2) and southeastern China (e.g. RY-1 and RY-2), while populations from southwest China always exhibited relatively low haplotype diversity (Table 1). The mean nucleotide diversity (p) also varied among populations, though the value at the species level was relatively high (0.00827). Yunnan and Sichuan group, both in southwest China, had higher p values when compared with Central and Eastern groups (Table 1). Among populations in Southwest China, WWS and EMS, both located in the eastern edge of the Sichuan basin, had relatively highp values (0.00144 and 0.00104, respectively). By contrast, the p value in RY-1
(0.00119) was the highest against that of populations from Central and Eastern groups (Table 1).
The total genetic diversity across all populations (HT= 0.98860.0096) was larger than the average
within-popula-tion diversity (HS= 0.17960.0435). High values ofGSTand NST
(0.819 and 0.976, respectively) indicated that there is significant population differentiation inP. obconica. The species was confirmed to have significant phylogeographic structure as NST was
significantly greater than GST (1000 permutations, P,0.05).
Results from analyses of the molecular variance (AMOVA) among groups and between and within populations are shown in Table 2.
ITS sequence variation
Individuals fixed for unique chlorotypes were sequenced with ITS primer pairs. ITS sequences from BS-2 and DJY-2 were not included in further analyses due to failure in amplification and/or sequencing. In cloning analyses, a total of 5–10 ITS clones was sequenced for each sample. A total of 220 sequences across the 110 individuals was obtained from the 21 populations we examined. The alignment length was 692 bp with 110 nucleotide substitution sites without indels. Sixty-six ribotypes were retrieved from the ITS matrix. The ribotypes in each population and the corresponding nucleotide parameters are shown in Table 3. The mean nucleotide diversity (p) was 0.01935 (60.00056), but it varied between populations (Table 3). Across all populations, SZ-2 from the Sangzhi region of central China had the highest nucleotide diversity (p= 0.0134). Populations from Southwest China, such as DJY-1, WWS, DL and BS-1, generally exhibited higher nucleotide diversity than that of populations from eastern and central China. The total genetic diversity across all populations (HT= 0.99460.0081) was larger than the average
within-population diversity (HS= 0.57160.0558).
We also detected significantly largerNSTvalues (0.84460.0380)
compared to GST (0.42560.0558), showing there is
phylogeo-graphic structure across the distribution range of P. obconica. AMOVA indicated that most of the variation (85.87%) related to differences between populations, while 15.13% of the variation was due to differences within populations (Table 2).
Phylogenetic reconstruction and phylogeographic structure for both datasets
Highly concordant trees were produced from MP and BI analyses for the plastid DNA dataset (Figure 2a). Chlorotypes ofP. obconica were separated into two major lineages (lineage A and lineage B) with strong supporting values (Figure 2a). Populations from Yunnan province and east China (corresponding to the Yunnan group and Eastern group, respectively) were included in lineage A, while lineage B comprised populations from the Sichuan province and central China (corresponding to the Sichuan group and Central group, respectively). It is noteworthy that chlorotypes (C10, C11 and C12) from population EMS in the Sichuan province were placed in lineage A (Figure 1, Figure 2a). The evolutionary relationships in lineage B were poorly resolved, but there was a well-supported clade (Central group) comprising populations from the Chongqing, Hunan and Guizhou provinces in central China. The haplotype network constructed by TCS also revealed the evolutionary relationships within and between several geographically-structured groups (Figure 2b), e.g. chlorotypes from Yunnan and Sichuan are considered to be older than those from central and east China, since they connect with outgroup directly and were located in an intermediate position [81] (Figure 2b).
which was supported by the Maximum Parsimony networks identified by TCS (data not shown). Ribotypes from Sichuan and Yunnan provinces are located in a central position, and each was connected with ribotypes from central and east China. However, ITS ribotypes from the EMS population were linked with other ribotypes from the Sichuan province, which contrasts with the plastid DNA results. Other difference was also found in populations ML-1 and LD (Figure 2a, b, c). In addition, ribotypes R18 and R56 from population SZ-2 were grouped with the Central group and Eastern group, respectively.
Historical demography ofPrimula obconica
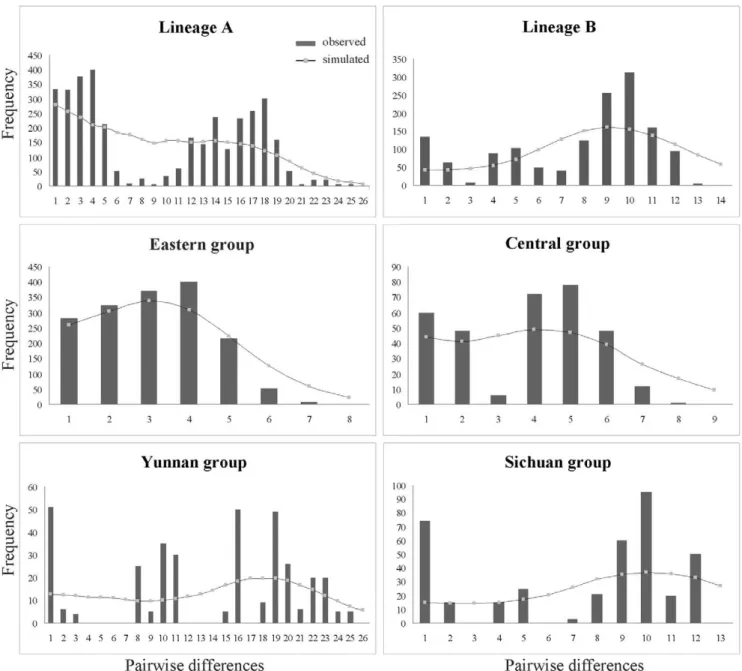
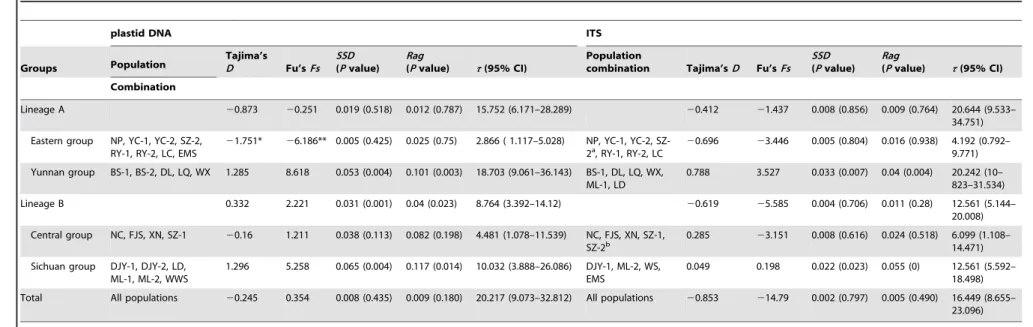
No significantly negative values for Tajima’sDor positive values for Fu’sFswere detected at the species level (Table 4). However, when the two neutrality tests were examined for each of the six groups (lineage A, lineage B, Eastern group, Central group, Sichuan group, and Yunnan group), significantly negative results were only found in the Eastern group (Table 4). Similarly, the Eastern group generated a bell-shaped unimodal curve with no significant SSDand Ragvalues in Mismatch Analysis (Figure 3, Table 4).
Net average distance (Da) between Lineage A and Lineage B was estimated to be 0.008 when all plastid DNA fragments combined, approximately equal to that oftrnL-trnF alone (0.0077). We then extended the assumed substitution rate of trnL-trnF to the combined plastid DNA data. We used the expression t= 2mt to
estimate the expansion ages of the Eastern group. Based on the aligned sequence length (1700 bp) and a estimated generation time of one year, the expansion of the Eastern group might occur at ca. 0.104 Myr (95% CI: 0.0495–0.169 Myr).
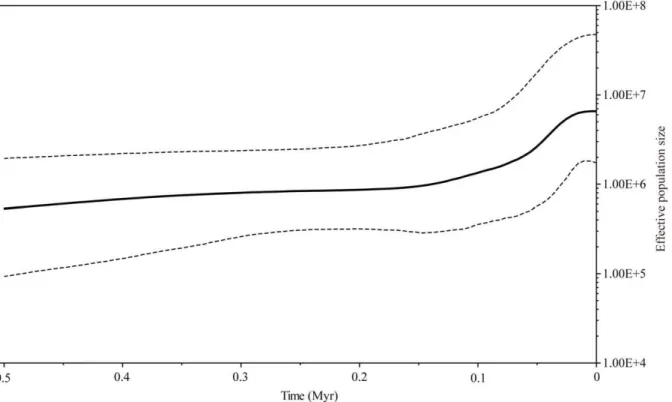
Figure 4 shows a Bayesian Skyline Plot (BSP) in which the demographic history ofP. obconicais illustrated in terms of effective population size. Prior to ca. 0.1 Myr, the effective population size seems to have been relatively stable or to have increased only gradually. Subsequently, there was a substantial growth period followed by another period of relative stability that has persisted since the onset of the Holocene.
Nested Clade Analysis results
The most parsimonious network constructed by TCS contained two ambiguous connections (loops), which were resolved using the procedure described by Crandall et al. [53]. The nested cladogram contained five hierarchical levels with 14 polymorphic clades (Figure S1, Table S3). A nested clade analysis using 1000 permutations was applied to these clades and did not reject the null hypothesis of no association with geographical location (P,0.05), except that Clade 1-1 contained chlorotypes (C3, C4, C9, C13, and C15) from the northern area of Guangdong (Nanling Mountain). According to the NCA analysis, Clade 1-1 evolved as a result of restricted gene flow due to isolation by distance, while most of the remaining clades probably resulted from previous gradual range expansions followed by fragmenta-tion or contiguous range expansion (Table S3).
Inferring distribution patterns with Ecological Niche Modeling
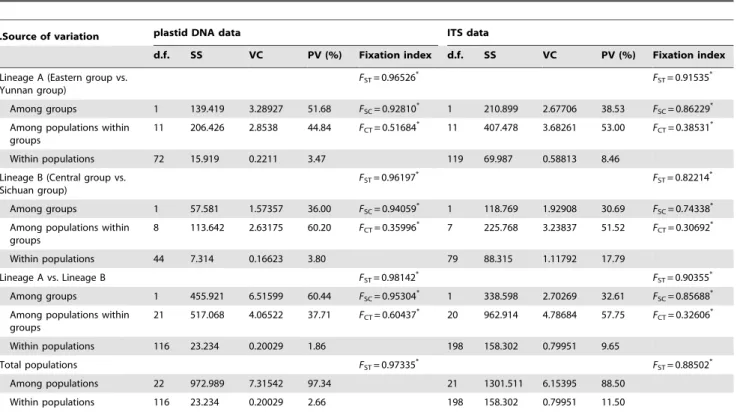
The inferred current and past (LGM) distribution of Primula obconica is shown in Figure 5. The AUC values based on both training and test presence data for the current and LGM periods Table 2.Results of analyses of molecular variance (AMOVA) for two datasets for all populations and population groups ofPrimula obconica.
.Source of variation plastid DNA data ITS data
d.f. SS VC PV (%) Fixation index d.f. SS VC PV (%) Fixation index
Lineage A (Eastern group vs. Yunnan group)
FST= 0.96526* FST= 0.91535*
Among groups 1 139.419 3.28927 51.68 FSC= 0.92810* 1 210.899 2.67706 38.53 FSC= 0.86229*
Among populations within groups
11 206.426 2.8538 44.84 FCT= 0.51684* 11 407.478 3.68261 53.00 FCT= 0.38531*
Within populations 72 15.919 0.2211 3.47 119 69.987 0.58813 8.46
Lineage B (Central group vs. Sichuan group)
FST= 0.96197* FST= 0.82214*
Among groups 1 57.581 1.57357 36.00 FSC= 0.94059* 1 118.769 1.92908 30.69 FSC= 0.74338*
Among populations within groups
8 113.642 2.63175 60.20 FCT= 0.35996* 7 225.768 3.23837 51.52 FCT= 0.30692*
Within populations 44 7.314 0.16623 3.80 79 88.315 1.11792 17.79
Lineage A vs. Lineage B FST= 0.98142* FST= 0.90355*
Among groups 1 455.921 6.51599 60.44 FSC= 0.95304* 1 338.598 2.70269 32.61 FSC= 0.85688*
Among populations within groups
21 517.068 4.06522 37.71 FCT= 0.60437* 20 962.914 4.78684 57.75 FCT= 0.32606*
Within populations 116 23.234 0.20029 1.86 198 158.302 0.79951 9.65
Total populations FST= 0.97335* FST= 0.88502*
Among populations 22 972.989 7.31542 97.34 21 1301.511 6.15395 88.50
Within populations 116 23.234 0.20029 2.66 198 158.302 0.79951 11.50
d.f., degrees of freedom; SS, sum of squares; VC, variance component;FCT, correlation of haplotypes within groups relative to total;FSC, correlation within populations relative to groups;FST, correlation within population relative to total;
‘*’,Pvalues,0.05.
were all higher than expected by chance (0.997 and 0.993, 0.996 and 0.993, respectively), which demonstrates good model perfor-mance. Compared with the two simulated distributions, it is remarkable that most suitable habitats for P. obconica occur in southwest and central China. In addition, the inferred distribution during the LGM is slightly larger than the current distribution; for example, the areas of the Sichuan basin and the eastern plain of China that were suitable for the species were both slightly larger during the LGM (Figure 5).
Discussion
Genetic differentiation between populations ofPrimula obconica
Primula obconica exhibited high genetic differentiation between populations, but extremely low genetic diversity within popula-tions (Table 2). The average genetic differentiation in angio-sperms, determined using maternally inherited markers, is 0.67 [72], but the value obtained forP. obconicais much greater than this. Plastid genomes in most angiosperm species are maternally inherited [73]. This is the case in two other primrose species [74], and it is likely true forP. obconicaas well. Gene flow estimations using plastid DNA markers are based on DNA transmission through seeds. However, all Primula species lack efficient seed
dispersal mechanisms; their seeds are ejected from the fruit capsules when they ripen and are dispersed by gravity or occasionally as a result of transport in flood waters, though seed dispersal by ants or rodents occasionally occurs in somePrimula
species [75]. According to our field observations, seeds of P. obconicaare mainly dispersed by gravity, which may be one of the main reasons for the high levels of genetic differentiation between populations.
In addition, environmental conditions in mountains at higher elevations differ markedly from those in the intervening valleys, which probably act as barriers to gene flow, and further result in high levels of inter-population genetic divergence [76–77]. Subtropical China is famous for its mosaic of mountains, which isolated populations of montane species in patch-like habitats. This is the case in most studied species of subtropical China, such as
Eurycorymbus cavaleriei [27], Dysosma versipellis [78], Dipentodon longipedicellatus [79], and Taxus wallichiana [23]. As a montane herb,Primula obconicais widely distributed across major mountain ranges of subtropical China (Figure 1) [14,29]. The species always occurs in shaded wet areas in thickets or forests with a range of varied elevation from 500–3300 m a.s.l.. Considering the fact of the mosaic of mountains and cultivated land area in low-elevation mountains, the mixed evergreen and deciduous broadleaved forests in subtropical China are fragmented, which lead to Table 3.The ribotypes detected from the ITS dataset and the corresponding genetic diversity.
Nos. Populations codes N p(sd) Hd(sd) Ribotypes (nos. of individuals)
Lineage A: Eastern group 43 0.00865 (0.00263) 0.852 (0.030)
1 NP 6 0.00044 (0.00021) 0.303 (0.147) R53(10),R54(2)
2 LC 7 0.00078 (0.00009) 0.538 (0.06) R48(8), R51(6),
3 RY-1 8 0.00066 (0.00014) 0.458 (0.095) R48(11),R52(5)
4 RY-2 8 0.00086 (0.00026) 0.525 (0.137) R48(11), R49(2), R50(2), R52(1)
5 SZ-2 * 6 0.0134 (0.00151) 0.545 (0.062) R18(6), R56(6)
6 YC-1 5 0.00170 (0.00037) 0.800 (0.100) R42(1), R43(1), R44(1), R45(4), R55(3)
7 YC-2 3 0.00077 (0.00025) 0.533 (0.172) R46(4), R47(2)
Lineage A: Yunnan group 26 0.01727 (0.00521) 0.919 (0.017)
8 ML-1 2 0 0 R57(4)
9 DL 3 0.00983 (0.00475) 0.867 (0.129) R63(2), R64(1), R65(2), R66(1)
10 WX 5 0.00058 (0.00030) 0.378 (0.181) R31(8), R32(1), R33(1)
11 BS-1 4 0.00924 (0.00336) 0.750 (0.139) R1(4), R2(2), R61(1), R62(1)
12 LD 4 0.00983 (0.00475) 0.867 (0.129) R58(4), R59(3), R60(1)
13 LQ 8 0.00077 (0.00007) 0.533 (0.046) R34(8), R35(8)
Lineage B: Sichuan group 20 0.01495 (0.00480) 0.921 (0.025)
14 EMS 5 0.00029 (0.00022) 0.200 (0.154) R20(9), R21(1)
15 WWS 6 0.01036 (0.00151) 0.848 (0.074) R36(2), R37(1), R38(1), R39(3), R40(1),
R41(4)
16 DJY-1 4 0.00991 (0.00297) 0.929 (0.084) R22(1), R23(1), R27(2), R28(1), R29(1),
R30(2)
17 ML-2 5 0.00148 (0.00024) 0.689 (0.104) R24(5), R25(2), R26(3)
Lineage B: Central group 21 0.00504 (0.00190) 0.887 (0.031)
18 SZ-1 6 0.00024 (0.00019) 0.167 (0.134) R3(11), R4(1)
19 NC 4 0.00320 (0.00057) 0.929 (0.084) R8(2), R9(1), R10(1), R11(2), R12(1),
R13(1)
20 XN 7 0.00152 (0.0037) 0.659 (0.123) R14(1), R15(8),R16(3), R17(1), R19(1)
21 FJS 4 0.00160 (0.00027) 0.679 (0.122) R5(4), R6(1), R7(3)
patch-like habitats ofP. obconica. In the present study, the result that the majority of the populations were fixed with unique haplotypes suggests that there is limited gene flow between populations. Although there is some variation in the morpholog-ical traits ofP. obconica, we did not find any correlation between haplotypes and subspecies since all haplotypes were mixed with each other in both plastid DNA and ITS datasets (Figure 2a, b, c). Adaptation to local environments may have resulted in genetic and morphological differentiation, but the populations have not had enough time to sort their lineages out (incomplete lineage sorting).
The area of origin and underlying migration events
Based on extensive data for the genus Primula, Hu [80] suggested that southwest China is the biodiversity and distribution centre for this genus, although whether the region acted as the origin area or a refugium in cold periods remains unknown. In theory, older haplotypes have a greater probability of becoming interior haplotypes than younger haplotypes in a network [81]. In the present study, the relatively older haplotypes along with the increased divergence of haplotypes in southwest China (Yunnan and West Sichuan) clearly indicate thatP. obconicaoriginated there (Figure 2b).
Since theory predicts that genetic drift should be reduced in an exponentially growing population, and that the replacement of
ancestral haplotypes is enhanced at the leading edge of an expanding population [25], we were able to infer the likely expansion direction from the positions of specific haplotypes. The fact that older haplotypes were all found in southwest China indicated that there were two eastward migration routes (Yunnan to east China, and Sichuan to central China). This result strongly supports the hypothesis of eastward migration routes in subtropical China proposed by Wang [82–83]. Wang hypothesized that many plants originated from southwest China and migrated to the east along several mountain ranges, such as Qin-Daba Mountains in the north, the Dalou and the Wuling Mountains in central China, and the Nanling Mountains in south China [82–83] (Figure 1). We did not identify any migration fingerprints along mountains and/ or river systems flowing east or west. However, the Nanling Mountains might actually be a barrier rather than a corridor forP. obconica, since the mountain populations only contained newly evolved chlorotypes (such as Clade 2-1, Table S3). NCA results also confirmed the occurrence of migration events (Table S3).
It is noteworthy that many chlorotypes of lineage A are missing in the geographic gap between Yunnan and east China (with the exception of the chlorotypes of the EMS population) (Figure 1, Figure 2a, b). During the Holocene, the greatest effective precipitation caused by the East Asian and Indian monsoons resulted in large and well-developed Karst areas in the southeast Yungui plateau (Guizhou and Guangxi Provinces) [84]. Moreover, severe rocky desertification in the region due to anthropogenic
Figure 2. Phylogenetic relationships among haplotypes and lineage subdivergence detected inPrimula obconica.(a) The phylogenetic topography based on plastid DNA dataset. Bootstrap values of Maximum Parsimony analysis and posterior probabilities of Bayesian inference are given above and below branches, respectively. (b) Maximum Parsimony networks of chlorotypes identified by TCS. Each solid line between circles represents one mutational step between two chlorotypes based on most parsimonious algorithm. The small open circles indicate the missing chlorotypes (not sampled or extinct). The solid line in the middle position of the network represents the two main lineages identified in the phylogenetic analysis, while the dashed line indicates the subdivision in each main lineage. The arrow indicated the connection betweenPrimua obconicaandPrimula barbicalyx. Yellow and green circles in (a) and (b) correspond to lineage A and lineage B, respectively, as shown in Figure 1. (c) The strict consensus of the Maximum Parsimony trees of ribotypes. The two main lineages are circled by a solid line, while a dashed line in each circle represents the subdivision in each main lineage. The terminal of each branch represents haplotype recovered from plastid DNA and ITS datasets (See Table 1 and 3).
activity might increase the likelihood of losing key haplotypes linking the Yunnan and east China lineages [85].
The expansion model ofPrimula obconica
Given the highly complex topography in Subtropical China [13] and the limited impact of glaciation during the Pleistocene [21,86], it is less likely to find population expansion patterns that are best described by the pioneer model [2]. The preference for montane habitats ofP. obconicamight result in the limited dispersal distance that allowed constant subsequent dispersal in a manner of the phalanx model [6–7]. In this study, gradual expansion events were frequently identified in many clades (Figure S1; Table S3), and a gradually increasing or stable effective population size was indicated by the BSP analysis (Figure 4). Results from Mismatch Analysis and neutrality test also supported its relatively stable
population size (Table 4). As shown in the phalanx model, the gradual population expansion in this species might reflect a slower expansion rate from refugia, as the warm and moist environmental conditions in the interglacial periods caused the species to retreat up into higher elevations forming isolated patch-like populations [7].
The phalanx model for P. obconica was further validated by modeling the distribution of the species, as it had a slightly larger distribution range in cold periods (i.e. during the LGM) than in warm periods (the present-day distribution) (Figure 5). Range expansion in this subtropical species following the phalanx model is likely to support the hypothesis of multiple refugia within the subtropical region [23–27], but stands in contrast to the traditional idea that there were three main refugia across the region based on their high level of endemism [15].
Figure 3. Mismatch distribution analysis of the plastid DNA dataset for lineage A, lineage B, the Eastern group, the Central group, the Sichuan group and the Yunnan group.Histograms correspond to observed frequencies of pairwise nucleotide differences, and lines represent the simulated frequencies under the sudden expansion model.
Table 4.Results of historical demographic analyses and population genetics statistics based on two datasets for population groups.
plastid DNA ITS
Groups Population
Tajima’s
D Fu’sFs
SSD
(Pvalue)
Rag
(Pvalue) t(95% CI)
Population
combination Tajima’sD Fu’sFs SSD
(Pvalue)
Rag
(Pvalue) t(95% CI)
Combination
Lineage A 20.873 20.251 0.019 (0.518) 0.012 (0.787) 15.752 (6.171–28.289) 20.412 21.437 0.008 (0.856) 0.009 (0.764) 20.644 (9.533– 34.751)
Eastern group NP, YC-1, YC-2, SZ-2, RY-1, RY-2, LC, EMS
21.751* 26.186** 0.005 (0.425) 0.025 (0.75) 2.866 ( 1.117–5.028) NP, YC-1, YC-2,
SZ-2a, RY-1, RY-2, LC 20.696 23.446
0.005 (0.804) 0.016 (0.938) 4.192 (0.792– 9.771)
Yunnan group BS-1, BS-2, DL, LQ, WX 1.285 8.618 0.053 (0.004) 0.101 (0.003) 18.703 (9.061–36.143) BS-1, DL, LQ, WX, ML-1, LD
0.788 3.527 0.033 (0.007) 0.04 (0.004) 20.242 (10– 823–31.534)
Lineage B 0.332 2.221 0.031 (0.001) 0.04 (0.023) 8.764 (3.392–14.12) 20.619 25.585 0.004 (0.706) 0.011 (0.28) 12.561 (5.144– 20.008)
Central group NC, FJS, XN, SZ-1 20.16 1.211 0.038 (0.113) 0.082 (0.198) 4.481 (1.078–11.539) NC, FJS, XN, SZ-1, SZ-2b
0.285 23.151 0.008 (0.616) 0.024 (0.518) 6.099 (1.108– 14.471)
Sichuan group DJY-1, DJY-2, LD, ML-1, ML-2, WWS
1.296 5.258 0.065 (0.004) 0.117 (0.014) 10.032 (3.888–26.086) DJY-1, ML-2, WS, EMS
0.049 0.198 0.022 (0.023) 0.055 (0) 12.561 (5.592– 18.498)
Total All populations 20.245 0.354 0.008 (0.435) 0.009 (0.180) 20.217 (9.073–32.812) All populations 20.853 214.79 0.002 (0.797) 0.005 (0.490) 16.449 (8.655– 23.096)
‘*’,Pvalues,0.05;
‘**’,Pvalues,0.01; superscript ‘a’, individuals fixed with ribotypes R56; superscript ‘b’, individuals fixed with R18;SSD, sum-of-squared deviations;Rag, Raggedness index.
doi:10.1371/journal.pone.0041315.t004 Phylogeograp
hy
of
Primula
obconica
ONE
|
www.ploson
e.org
10
September
2012
|
Volume
7
|
Issue
9
|
Although the phalanx model probably explains the general gradual range expansions ofP. obconica, different environments will have affected the historical demography of the species. For example, we found that the Eastern group has been expanding rapidly on the eastern plain of China approximately since the last 0.104 Myr (Figure 3, Table 4). This region contains many plains
and hills with elevations below 1000 m a.s.l. These low altitudes are likely to have played an important role in the demography of
P. obconicaacross its range (Figure 5, Table 4), where individuals migrated down from hills, and spread across the plains in cold periods. Unfortunately, despite the rapid expansion simulated in our study, there are relatively few populations remaining in eastern
Figure 4. Bayesian Skyline Plot representing the historical demographic trend in plastid lineages ofPrimula obconica.The x-axis units are years before present and was estimated based on a substitution rate of 8.2461029subst. per site per yr. The y-axis shows an estimate of effective population size (Net), the product of effective population size and generation length in million years (Myr). The bold black line represents the median estimates through time from the Bayesian posterior distribution, while the dashed line shows the 95% highest posterior density (HPD) boundaries. doi:10.1371/journal.pone.0041315.g004
Figure 5. Inferred distribution range ofPrimula obconicain subtropical China simulated by an Ecological Niche Model (ENM) using bioclimatic variables.(a) The current potential distribution and (b) the simulated distribution range at the Last Glacial Maximum (LGM). Marginal to optimal habitat are shown in green (marginal) to red (optimal). Black circles represent collecting records included in our analysis.
China. The limited and scattered current distribution ofP. obconica
is likely due to climatic warming since the Holocene and overexploitation by humans. In addition to the historical demography of P. obconica, more genetic differentiations have been identified in different environments, which are discussed below.
The effects of environmental heterogeneity on lineage divergence
East Asia can be divided into three geographical zones, with a pronounced decrease in altitude from west to east [13] (See inset map in Figture 1). The lineage differentiation in P. obconica
coincides almost perfectly with this geographic division. For example, the lineage split of Lineage B (Sichuan and Central groups) is consistent with the division between the HHM and the Yungui Plateau (Figure 1).
In this study, a more significant lineage division (Central group and Eastern group) occurred in the transitional belt between the Yungui Plateau and the eastern plain (Figure 1). In particular, chlorotypes SZ-1 and SZ-2, which were located at different elevations in the Taiping Mountain, belonged to Eastern group and Central group, respectively. The occurrence of lineage divergence between the two regions was further supported by the ITS data. Furthermore, two ribotypes (R18 and R56) in population SZ-2 belonged to different lineages (Figure 2c), respectively, and caused the highest nucleotide diversity in this population (Table 3). The pattern of different coexisting lineages in the region is similar to the category II intraspecific pattern suggested by Avise [87], which means the suture line is a secondary admixture zone between allopatrically evolved popula-tions [87]. Following the interpretation of Mismatch Analysis results of Pauls et al. [88], we were able to detect expansion signal in Eastern group (Figure 3, Table 4), although the Central group might have experienced a gradual expansion (Table S3, see Clade 3–9).
Another interesting division occurred in the HHM. Recent surveys of flora in this region have shown a major change in species composition across the 29uN latitudinal line in the HHM, dividing it into southern and northern sub-regions [89–90]. There are a series of high mountains and plateaus along the 29uN latitudinal line, including Mt. Gongga and 28 other surrounding mountains in the east, Meili Snow Mountain and the Mangkang Plateau in the west, and the Litang-Daocheng Plateau in the center [91–92]. Especially, the fact that many peaks in excess of 5500 m a.s.l. in the Litang-Daocheng Plateau, probably resulted in the earliest and largest glaciation during the Pleistocene in the HHM (so-called Daocheng glaciation, [21]). The special topogra-phy across the latitudinal line may result in the major difference in flora in the HHM, since these mountains and plateaus form a significant barrier for the dispersal of species across the region [90]. In the current study, two ancestral lineages ofP. obconica(the Yunnan and Sichuan lineages) are located in the HHM, which
split geographically with the 29uN latitudinal line. Similar genetic patterns were also found in other alpine plants in this area, such as
Primula secundiflora [93] and Ligularia tongolensis[94]. Our results, based on intraspecific genetic data, support the hypothesis of a 29uN latitudinal geographic barrier, but warrants further evidenc-es.
Conclusion
In this study, we identified two main lineages inP. obconica, each comprising two subclades. We found that the species originated from Southwest China and then migrated to eastern and central China, since the relatively older lineages occurred in Southwest China. We also detected thatP. obconicapopulations experienced a gradual expansion and had relatively larger distribution range during LGM than at present, which firstly provided the evidence to support the hypothesis of the phalanx model as a main expansion manner for montane species in subtropical China. Finally, we found that lineage divergence was highly correlated with many geographical divisions, highlighting the importance of environmental heterogeneity in maintaining the present-day lineage differentiation in subtropical China.
Supporting Information
Figure S1 The nested cladogram of chlorotypes of Primula obconica.
(DOC)
Table S1 GenBank accession numbers identified in this study. (DOC)
Table S2 The distribution information of Primula obconica
examined in this study. (DOC)
Table S3 Nested contingency analysis of geographical structure based on 1000 permutation and chain of inference based on GeoDis inference key.
(DOC)
Acknowledgments
We are grateful to Prof. Hua-Gu Ye, Mr. Lian-Cheng Tian, Da-Peng Yu, Yu-Bin Wang, and Dr Bing-Qiang Xu for help in collecting samples. We are also grateful to Drs Wei Gong, Tie-Yao Tu, Jing Wang, Yi-Fei Liu, and Hui-Run Huang for providing technical assistance with the data analyses and map production. We also thank Keith A. Crandall and three anonymous reviewers for their critical comments and suggestions.
Author Contributions
Conceived and designed the experiments: GH XJG. Performed the experiments: HFY FYW. Analyzed the data: HFY GH FYW. Contributed reagents/materials/analysis tools: CMH GH FYW. Wrote the paper: HFY CYZ GH.
References
1. Hewitt GM (1999) Post-glacial re-colonization of European biota. Biological Journal of the Linnean Society 68: 87–112.
2. Hewitt GM (1996) Some genetic consequences of ice ages, and their role in divergence and speciation. Biological Journal of the Linnean Society 58: 247– 276.
3. Hewitt G (2000) The genetic legacy of the Quaternary ice ages. Nature 405: 907–913.
4. Soltis DE, Morris AB, McLachlan JS, Manos PS, Soltis PS (2006) Comparative phylogeography of unglaciated eastern North America. Molecular Ecology 15: 4261–4293.
5. Comes HP, Kadereit JW (1998) The effect of quaternary climatic changes on plant distribution and evolution. Trends in Plant Science 3: 432–438.
6. Chiang TY, Schaal BA (2006) Phylogeography of plants in Taiwan and the Ryukyu archipelago. Taxon 55: 31–41.
7. DeChaine EG, Martin AP (2004) Historic cycles of fragmentation and expansion in Parnassius smintheus (Papilionidae) inferred using mitochondrial DNA. Evolution 58: 113–127.
8. Qu Y, Lei F, Zhang R, Lu X (2010) Comparative phylogeography of five avian species: implications for Pleistocene evolutionary history in the Qinghai-Tibetan plateau. Molecular Ecology 19: 338–351.
10. Wang L, Wu ZQ, Bystriakova N, Ansell SW, Xiang QP, et al. (2011) Phylogeography of the Sino-Himalayan FernLepisorus clathratuson ‘‘The Roof of the World’’. Plos One 6.
11. Yang FS, Li YF, Ding X, Wang XQ (2008) Extensive population expansion of Pedicularis longiflora(Orobanchaceae) on the Qinghai-Tibetan Plateau and its correlation with the Quaternary climate change. Molecular Ecology 17: 5135– 5145.
12. Zhang Q, Chiang TY, George M, Liu JQ, Abbott RJ (2005) Phylogeography of the Qinghai-Tibetan Plateau endemic Juniperus przewalskii (Cupressaceae) inferred from chloroplast DNA sequence variation. Molecular Ecology 14: 3513–3524.
13. Committee of Chinese Academy of Sciences for Physical Geography of China (1985) Physical geography of China: pandect. Beijing, China: Science Press. 14. Wu ZY (1980) China’s vegetation. Beijing, China: Science Press.
15. Ying TS (2001) Species diversity and distribution pattern of seed plants in China. Biodiversity Science 9: 393–398.
16. Ying TS, zhang YL, Boufford DE, editors (1993) The Endemic genera of seed plants of China. Beijing, China: Science Press.
17. Axelrod DI, Al-Shehbaz I, Raven PH (1996) History of the modern flora of China. In: Zhang AL, Wu SG, editors. Proceedings of the first internationl symposium on floristic characteristics and diversity of East Asian plants. Beijing: China Higher Education Press. pp. 43–55.
18. Members of China Quaternary Pollen Data Base (2000) Pollen-based biome reconstruction at Middle Holecene (6 ka BP) and Last Glacial Maximum (18 ka BP) in China. Acta Botanica Sinica 42: 1201–1209.
19. Harrison SP, Yu G, Takahara H, Prentice IC (2001) Palaeovegetation -Diversity of temperate plants in east Asia. Nature 413: 129–130.
20. Yu G, Chen X, Ni J, Cheddadi R, Guiot J, et al. (2000) Palaeovegetation of China: a pollen data-based synthesis for the mid-Holocene and last glacial maximum. Journal of Biogeography 27: 635–664.
21. Zheng BX (2005) Quaternary Glaciations in the Hengduan Mountains. In: Shi YF, editor. The Quaterary Glaciations and environmental variations in China. Shijiazhuang, China: Hebei Science and Technology Publishing House. 22. Qian H, Ricklefs RE (2000) Large-scale processes and the Asian bias in species
diversity of temperate plants. Nature 407: 180–182.
23. Gao LM, Moeller M, Zhang XM, Hollingsworth ML, Liu J, et al. (2007) High variation and strong phylogeographic pattern among cpDNA haplotypes in Taxus wallichiana(Taxaceae) in China and North Vietnam. Molecular Ecology 16: 4684–4698.
24. Gong W, Chen C, Dobes C, Fu CX, Koch MA (2008) Phylogeography of a living fossil: Pleistocene glaciations forcedGinkgo bilobaL. (Ginkgoaceae) into two refuge areas in China with limited subsequent postglacial expansion. Molecular Phylogenetics and Evolution 48: 1094–1105.
25. Li SH, Yeung CKL, Feinstein J, Han LX, Manh HL, et al. (2009) Sailing through the Late Pleistocene: unusual historical demography of an East Asian endemic, the Chinese Hwamei (Leucodioptron canorum canorum), during the last glacial period. Molecular Ecology 18: 622–633.
26. Song G, Qu YH, Yin ZH, Li SS, Liu NF, et al. (2009) Phylogeography of the Alcippe morrisonia (Aves: Timaliidae): long population history beyond late Pleistocene glaciations. Bmc Evolutionary Biology 9.
27. Wang J, Gao PX, Kang M, Lowe AJ, Huang HW (2009) Refugia within refugia: the case study of a canopy tree (Eurycorymbus cavaleriei) in subtropical China. Journal of Biogeography 36: 2156–2164.
28. Qian H (2002) A comparison of the taxonomic richness of temperate plants in East Asia and North America. American Journal of Botany 89: 1818–1825. 29. Hu CM (1990) Primulaceae; Chen FW, Hu CM, editors. Beijing: Science Press. 30. Hu CM, Kelso S (1996) Primulaceae; Wu ZY, Raven PH, editors. Beijing:
Science Press; St. Louis: Missouri Botanical Garden Press.
31. He GS, Hu CM (2002) A new subspecies of Primula obconica Hance from Eastern China. Acta Phytotaxonomica Sinica 40: 551–552.
32. Sarkar AK (1988) Primulaceae - its evolution and assessment in status as jugded through cytotaxonomy. Feddes Repertorium 99: 113–132.
33. Dowrick VPJ (1956) Heterostyly and homostyty inPrimula obconica. Heredity 10: 219–236.
34. Richards J (2003) Primula. Portland, OR, , USA: Timber Press.
35. Guggisberg A, Mansion G, Kelso S, Conti E (2006) Evolution of biogeographic patterns, ploidy levels, and breeding systems in a diploid-polyploid species complex ofPrimula. New Phytologist 171: 617–632.
36. Kelso S (1992) The genusPrimulaas a model for evolution in the Alaskan flora. Arctic and Alpine Research 24: 82–87.
37. Doyle JJ, Doyle JL (1987) A rapid DNA isolation procedure for small quantities of fresh leaf tissue. Phytochemical Bulletin 19: 11–15.
38. Oxelman B, Liden M, Berglund D (1997) Chloroplast rps16 intron phylogeny of the tribeSileneae(Caryophyllaceae). Plant Systematics and Evolution 206: 393– 410.
39. Taberlet P, Gielly L, Pautou G, Bouvet J (1991) Universal primers for amplification of 3 noncoding regions of Chloroplast DNA. Plant Molecular Biology 17: 1105–1109.
40. White TJ, Bruns T, Lee S, Taylor J (1990) Amplication and direct sequencing of fungal ribosomal RNA genes for phylogenetics. In: Innis M, Gelfand D, Sninsky J, White TJ, editors. PCR protocols: A guide to methods and applications. San Diego: Academic Press. pp. 315–322.
41. Clark AG (1990) Inference of haplotypes from PCR-amplified samples of diploid populations. Molecular Biology and Evolution 7: 111–122.
42. Thompson JD, Gibson TJ, Plewniak F, Jeanmougin F, Higgins DG (1997) The CLUSTAL_X windows interface: flexible strategies for multiple sequence alignment aided by quality analysis tools. Nucleic Acids Research 25: 4876– 4882.
43. Librado P, Rozas J (2009) DnaSP v5: a software for comprehensive analysis of DNA polymorphism data. Bioinformatics 25: 1451–1452.
44. Pons O, Petit RJ (1996) Measuring and testing genetic differentiation with ordered versus unordered alleles. Genetics 144: 1237–1245.
45. Excoffier L, Laval G, Schneider S (2005) Arlequin (version 3.0): An integrated software package for population genetics data analysis. Evolutionary Bioinfor-matics 1: 47–50.
46. Swofford DL (2002) PAUP*: Phylogenetic analysis using parsimony (*and other methods), version 4.0b10. Sunderland: Sinauer.
47. Felsenstein J (1985) Confidence-Limits on Phylogenies - an Approach Using the Bootstrap. Evolution 39: 783–791.
48. Posada D, Crandall KA (1998) MODELTEST: testing the model of DNA substitution. Bioinformatics 14: 817–818.
49. Ronquist F, Huelsenbeck JP (2003) MrBayes 3: Bayesian phylogenetic inference under mixed models. Bioinformatics 19: 1572–1574.
50. Mast AR, Kelso S, Conti E (2006) Are any primroses (Primula) primitively monomorphic? New Phytologist 171: 605–616.
51. Yan HF, He CH, Peng CI, Hu CM, Hao G (2010) Circumscription ofPrimula subgenusAuganthus(Primulaceae) based on chloroplast DNA sequences. Journal of Systematics and Evolution 48: 123–132.
52. Clement M, Posada D, Crandall KA (2000) TCS: a computer program to estimate gene genealogies. Molecular Ecology 9: 1657–1659.
53. Crandall KA, Templeton AR (1993) Empirical tests of some predictions from coalescent theory with applications to intraspecific phylogeny reconstruction. Genetics 134: 959–969.
54. Templeton AR, Sing CF (1993) A cladistic-analysis of phenotypic associations with haplotypes inferred from restriction endonuclease mapping .4. nested analyses with cladogram uncertainty and recombination. Genetics 134: 659– 669.
55. Posada D, Crandall KA, Templeton AR (2000) GeoDis: a program for the cladistic nested analysis of the geographical distribution of genetic haplotypes. Molecular Ecology 9: 487–488.
56. Posada D, Crandall KA, Templeton AR (2006) Nested clade analysis statistics. Molecular Ecology Notes 6: 590–593.
57. Tajima F (1989) Statistical-method for testing the neutral mutation hypothesis by DNA polymorphism. Genetics 123: 585–595.
58. Fu YX (1997) Statistical tests of neutrality of mutations against population growth, hitchhiking and background selection. Genetics 147: 915–925. 59. Chiang YC, Schaal BA, Ge XJ, Chiang TY (2004) Range expansion leading to
departures from neutrality in the nonsymbiotic hemoglobin gene and the cpDNA trnL-trnF intergenic spacer in Trema dielsiana (Ulmaceae). Molecular Phylogenetics and Evolution 31: 929–942.
60. Rogers AR, Harpending H (1992) Population-growth makes waves in the distribution of pairwise genetic-differences. Molecular Biology and Evolution 9: 552–569.
61. Schneider S, Excoffier L (1999) Estimation of past demographic parameters from the distribution of pairwise differences when the mutation rates very among sites: Application to human mitochondrial DNA. Genetics 152: 1079–1089. 62. Harpending HC (1994) Signature of ancient population-growth in a
low-resolution Mitochondrial-DNA mismatch distribution. Human Biology 66: 591– 600.
63. Richardson JE, Pennington RT, Pennington TD, Hollingsworth PM (2001) Rapid diversification of a species-rich genus of neotropical rain forest trees. Science 293: 2242–2245.
64. Drummond AJ, Rambaut A, Shapiro B, Pybus OG (2005) Bayesian coalescent inference of past population dynamics from molecular sequences. Molecular Biology and Evolution 22: 1185–1192.
65. Drummond AJ, Rambaut A (2007) BEAST: Bayesian evolutionary analysis by sampling trees. Bmc Evolutionary Biology 7.
66. Drummond AJ, Ho SYW, Phillips MJ, Rambaut A (2006) Relaxed phylogenetics and dating with confidence. Plos Biology 4: 699–710. 67. Rambaut A, Drummond AJ (2005) Tracer v1.5. 1.3 ed. http://tree.bio.ed.ac.
uk/software/tracer/.
68. Phillips SJ, Anderson RP, Schapire RE (2006) Maximum entropy modeling of species geographic distributions. Ecological Modelling 190: 231–259. 69. Flanders J, Wei L, Rossiter SJ, Zhang SY (2011) Identifying the effects of the
Pleistocene on the greater horseshoe bat, Rhinolophus ferrumequinum, in East Asia using ecological niche modelling and phylogenetic analyses. Journal of Biogeography 38: 439–452.
70. Hijmans RJ, Cameron SE, Parra JL, Jones PG, Jarvis A (2005) Very high resolution interpolated climate surfaces for global land areas. International Journal of Climatology 25: 1965–1978.
71. Hasumi H, Emori S (2004) K-1 coupled GCM (MIROC) description. In: Hasumi H, Emori S, editors. K-1 technical report No 1, September, 2004 Center for Climate System Research, University of Tokyo. Tokyo.
73. Petit RJ, Vendramin GG (2007) Plant phylogeography based on organelle genes: an introduction. In: Weiss S, Ferrand N, editors. Phylogeography of southern European Refugia. New York: Springer. pp. 23–97.
74. Zhang Q, Liu Y, Sodmergen(2003) Examination of the cytoplasmic DNA in male reproductive cells to determine the potential for cytoplasmic inheritance in 295 angiosperm species. Plant and Cell Physiology 44: 941–951.
75. Van Geert A, Van Rossum F, Triest L (2008) Genetic diversity in adult and seedling populations ofPrimula vulgarisin a fragmented agricultural landscape. Conservation Genetics 9: 845–853.
76. Shepard DB, Burbrink FT (2008) Lineage diversification and historical demography of a sky island salamander,Plethodon ouachitae, from the Interior Highlands. Molecular Ecology 17: 5315–5335.
77. Shepard DB, Burbrink FT (2009) Phylogeographic and demographic effects of Pleistocene climatic fluctuations in a montane salamander,Plethodon fourchensis. Molecular Ecology 18: 2243–2262.
78. Qiu YX, Guan BC, Fu CX, Comes HP (2009) Did glacials and/or interglacials promote allopatric incipient speciation in East Asian temperate plants? Phylogeographic and coalescent analyses on refugial isolation and divergence inDysosma versipellis. Molecular Phylogenetics and Evolution 51: 281–293. 79. Yuan QJ, Zhang ZY, Peng H, Ge S (2008) Chloroplast phylogeography of
Dipentodon (Dipentodontaceae) in southwest China and northern Vietnam. Molecular Ecology 17: 1054–1065.
80. Hu CM (1994) On the geographical distribution of the Primulaceae. Journal of Tropical and Subtropical Botany 2: 1–14.
81. Posada D, Crandall KA (2001) Intraspecific gene genealogies: trees grafting into networks. Trends in Ecology & Evolution 16: 37–45.
82. Wang WT (1992a) On some distribution patterns and some migration routes found in the eastern Asiatic region. Acta Phytotaxonomica Sinica 30: 1–24. 83. Wang WT (1992b) On some distribution patterns and some migration routes
found in the eastern Asiatic region (cont.). Acta Phytotaxonomica Sinica 30: 97– 117.
84. Wu XH, An ZS, Wang SM, Liu XD, li XQ, et al. (1994) The temporal and spatial variation of East-Asian summer monsoon in Holocene optimum in China. Quaternary Sciences: 24–37.
85. Wang SJ, Liu QM, Zhang DF (2004) Karst rocky desertification in southwestern China: Geomorphology, landuse, impact and rehabilitation. Land Degradation & Development 15: 115–121.
86. Cui ZJ, Zhang W, Yang JQ (2005) Remains of the Quaternary Glaciations and their characteristics in the Eastern region of China. In: Shi YF, editor. The Quaterary Glaciations and environmental variations in China. Shijiazhuang, China: Hebei Science and Technology Publishing House.
87. Avise JC (2000) Phylogeography: The history and formation of species. Cambridge: Harvard University Press.
88. Pauls SU, Lumbsch HT, Haase P (2006) Phylogeography of the montane caddisflyDrusus discolor: evidence for multiple refugia and periglacial survival. Molecular Ecology 15: 2153–2169.
89. Wu ZY, Sun H, Zhou ZK, li DZ, Peng H (2011) Florisics of Seed plants from China. Beijing: Science Press.
90. Zhang DC, Boufford DE, Ree RH, Sun H (2009) The 29 degrees N latitudinal line: an important division in the Hengduan Mountains, a biodiversity hotspot in southwest China. Nordic Journal of Botany 27: 405–412.
91. Li BY (1989) Geomorphologic regionalization of the Hengduan Mountainous Region. Journal of Mountain Research 7: 13–20.
92. Zhang RZ, Zheng D, Yang QY, Liu LH (1997) Physical geography of Hengduan Mountains. Beijing: Science Press.
93. Wang FY, Gong X, Hu CM, Hao G (2008) Phylogeography of an alpine species Primula secundiflora inferred from the chloroplast DNA sequence variation. Journal of Systematics and Evolution 46: 13–22.